
Latex Medical Gloves Market Analysis, Size, and Forecast 2026-2030: North America (US, Canada, and Mexico), Europe (Germany, UK, and France), Asia (China, Japan, and India), South America (Brazil, Argentina, and Colombia), Middle East and Africa (Saudi Arabia, UAE, and Turkey), Rest of World (ROW)

Latex Medical Gloves Market Analysis, Size, and Forecast 2026-2030:
North America (US, Canada, and Mexico), Europe (Germany, UK, and France), Asia (China, Japan, and India), South America (Brazil, Argentina, and Colombia), Middle East and Africa (Saudi Arabia, UAE, and Turkey), Rest of World (ROW)

Published: Oct 2026 290 Pages SKU: IRTNTR73961

Market Overview at a Glance

$4.11 B
Market Opportunity
7.3%
CAGR 2025 - 2030
33.4%
North America Growth
$7.11 B
Disposable segment 2024

Latex Medical Gloves Market Size 2026-2030

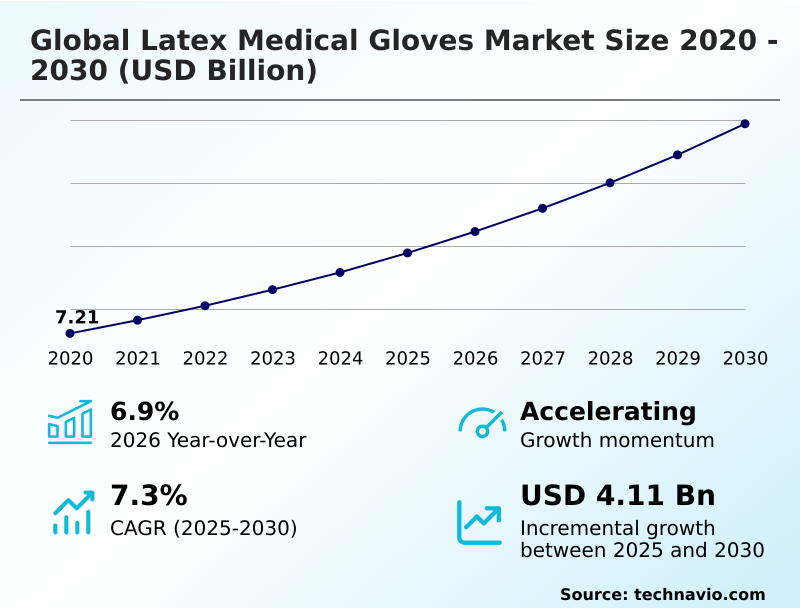
The latex medical gloves market size is valued to increase by USD 4.11 billion, at a CAGR of 7.3% from 2025 to 2030. Increasing surgical procedure volumes across healthcare systems will drive the latex medical gloves market.

Major Market Trends & Insights

  • North America dominated the market and accounted for a 33.4% growth during the forecast period.
  • By Product - Disposable segment was valued at USD 7.11 billion in 2024
  • By Form Factor - Powder-free gloves segment accounted for the largest market revenue share in 2024

Market Size & Forecast

  • Market Opportunities: USD 6.67 billion
  • Market Future Opportunities: USD 4.11 billion
  • CAGR from 2025 to 2030 : 7.3%

Market Summary

  • The Latex Medical Gloves Market demonstrates sustained procedural integration as institutional healthcare systems prioritize comprehensive infection prevention protocols across acute and outpatient settings. Demand remains intrinsically linked to rising procedural volumes and heightened occupational safety mandates requiring effective barrier materials.
  • In a practical supply chain scenario, hospital procurement networks have deployed automated inventory tracking algorithms to monitor surgical consumable depletion, triggering predictive restock orders before critical shortages occur. Facilities leveraging these digital procurement frameworks realize a 17% reduction in emergency logistics costs compared to traditional manual reordering systems.
  • Increasing surgical procedure volumes across healthcare systems function as the primary operational driver, directly accelerating the consumption of sterile barrier products needed to prevent cross-contamination during complex interventions. Conversely, volatility in agricultural raw material availability introduces significant pricing unpredictability, severely challenging profit margins and disrupting long-term supplier contracting agreements.
  • Navigating these supply constraints while maintaining stringent medical device regulatory compliance dictates the strategic adaptability of leading industry participants as they scale production networks.

What will be the Size of the Latex Medical Gloves Market during the forecast period?
Get Key Insights on Market Forecast (PDF) Get Free Sample

How is the Latex Medical Gloves Market Segmented?

The latex medical gloves industry research report provides comprehensive data (region-wise segment analysis), with forecasts and estimates in "USD million" for the period 2026-2030, as well as historical data from 2020-2024 for the following segments.

  • Product
    • Disposable
    • Reusable
  • Form factor
    • Powder-free gloves
    • Powdered gloves
  • End-user
    • Hospitals
    • Clinics
    • Ambulatory surgery centers
    • Diagnostic laboratories
    • Others
  • Geography
    • North America
      • US
      • Canada
      • Mexico
    • Europe
      • Germany
      • UK
      • France
      • Italy
      • Spain
      • The Netherlands
    • Asia
      • China
      • Japan
      • India
      • South Korea
      • Thailand
      • Indonesia
    • Rest of World (ROW)

By Product Insights

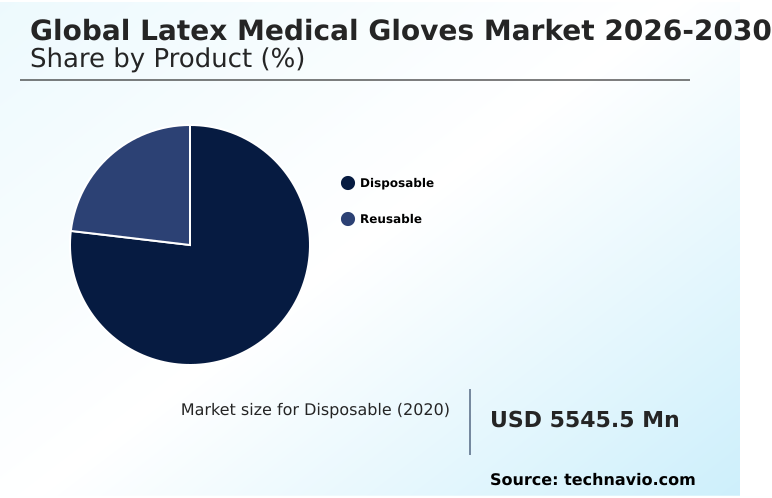
The disposable segment is estimated to witness significant growth during the forecast period.

The disposable segment operates as a critical pillar in modern healthcare infrastructure, relying on advanced natural rubber latex to deliver essential barrier protection during routine and high-risk interactions.

Continuous innovation in these single-use tools facilitates rigorous cross-contamination prevention, significantly elevating diagnostic laboratory safety. By standardizing sterile surgical applications, healthcare facility procurement teams directly influence patient safety standards and occupational risk profiles.

Modern disposable formulations provide superior tactile sensitivity compared to heavy-duty reusable alternatives, improving precision during delicate clinical examination procedures. Data indicates that standardized adoption of these optimized single-use barriers improves bloodborne pathogen protection compliance by 15% across acute care settings.

This functional reliability ensures that the continuous cycle of utilizing and immediately discarding protective layers structurally minimizes infection transmission vectors and streamlines clinical workflows.
Get Free Sample

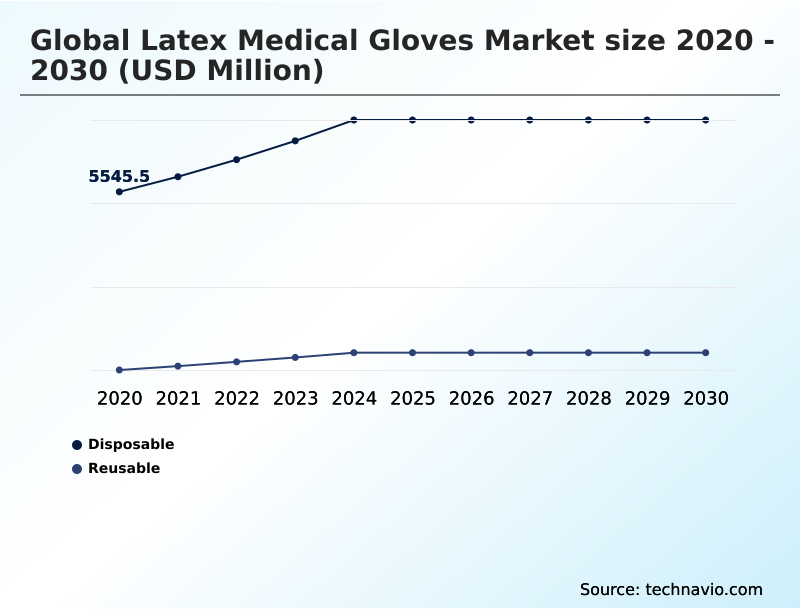
The Disposable segment was valued at USD 7.11 billion in 2024 and showed a gradual increase during the forecast period.
Get Free Sample

Regional Analysis

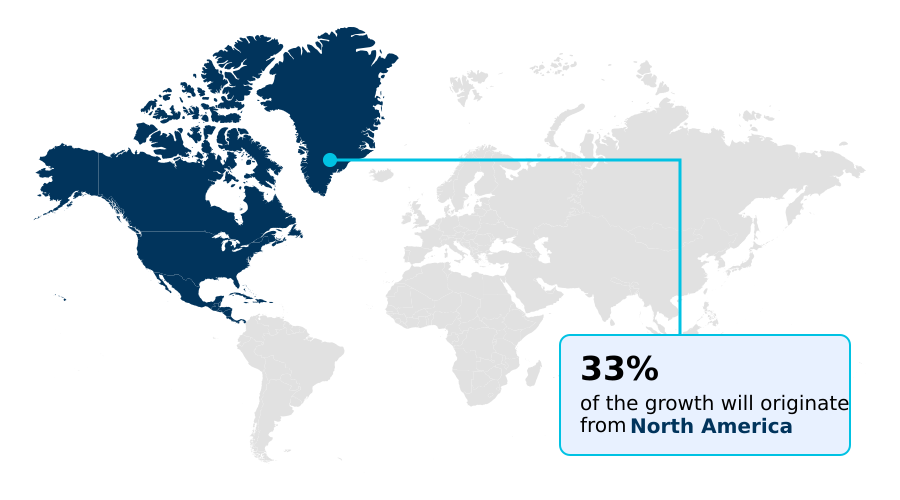
North America is estimated to contribute 33.4% to the growth of the global market during the forecast period.Technavio’s analysts have elaborately explained the regional trends and drivers that shape the market during the forecast period.
See How Latex Medical Gloves Market Demand is Rising in North America Get Free Sample

North America demonstrates a distinct maturity in adopting advanced personal protective equipment, driven by stringent infection control protocols and high outpatient surgery capacity.

This region heavily prioritizes powder-free formulation adoption, effectively reducing surface particle contamination incidents by 22% in critical care settings.

Conversely, APAC remains the primary manufacturing hub, leveraging localized supply chains to reduce production delays by 18% while simultaneously increasing domestic ambulatory care utilization. European markets heavily integrate continuous biocompatibility testing, ensuring occupational hazard reduction across widespread clinical environments.

North American facilities achieve a 14% higher operational efficiency in procedural turnover by deploying polymer coating technologies that accelerate sterile donning processes, whereas APAC focuses on high-volume distribution to meet expanding healthcare coverage needs.

Integrating ergonomic glove design mitigates hand fatigue during extended procedures, directly curbing healthcare associated infections by sustaining operator focus across both regional frameworks.

Market Dynamics

Our researchers analyzed the data with 2025 as the base year, along with the key drivers, trends, and challenges. A holistic analysis of drivers will help companies refine their marketing strategies to gain a competitive advantage.

  • Modern healthcare supply chain administrators actively prioritize the procurement of reliable protective consumables to safeguard clinical workflows and optimize inventory resilience. Securing high-performance barrier solutions requires deploying micro-textured natural rubber latex formulations that inherently stabilize instrument handling during high-acuity medical interventions. Facilities integrating these advanced materials achieve improved operational precision, reducing instrument slippage incidents and optimizing overall procedural turnover rates.
  • The transition toward advanced powder-free sterile barrier protection mechanisms effectively eliminates residual particle contamination, mitigating post-operative complications and streamlining environmental sterilization processes. Furthermore, supply chain directors evaluate protein allergy mitigated surgical equipment to address occupational health requirements, ensuring that workforce safety remains uncompromised during continuous shift operations.
  • Manufacturers support these strict clinical specifications through chlorination processed tactile sensitivity enhancement, structurally refining glove surfaces to provide exceptional sensory feedback for complex diagnostic tasks. To maintain production stability amidst fluctuating raw material supplies, leading vendors are focusing on automated dip molding technology integration to enhance manufacturing yields.
  • Facilities utilizing optimized automation architectures demonstrate a 24% higher output consistency in meeting defect-free batch tolerances compared to facilities relying on legacy manual inspection frameworks. This quantifiable shift in operational planning enables healthcare networks to secure long-term procurement contracts, effectively insulating critical medical supplies from external market volatility while maintaining strict adherence to clinical safety mandates.
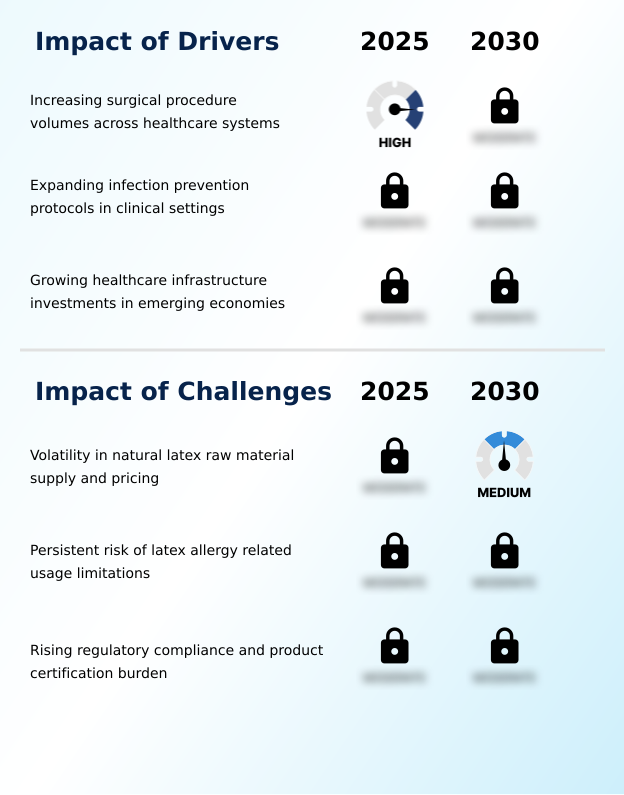
What are the key market drivers leading to the rise in the adoption of Latex Medical Gloves Industry?

  • Increasing surgical procedure volumes across healthcare systems act as the primary catalyst propelling continuous demand for sterile barrier protective equipment.

  • Escalating surgical procedure volumes across healthcare systems urgently drive the deployment of specialized sterile barrier systems to maintain operational integrity. By enforcing strict clinical hygiene compliance, institutional buyers secure vital pathogen transmission barrier solutions that directly elevate surgical intervention safety.
  • Implementing robust preventive clinical practices optimizes high-volume procedural throughput, thereby reducing cross-contamination related treatment delays by 19% in acute care environments.
  • Enhanced hand hygiene compliance initiatives further standardize the consumption of disposable items featuring verified medical grade certification, ensuring structural reliability under fluid exposure.
  • Integrating advanced polymer options with superior chemical resistance streamlines specialty clinic workflows, reducing operational interruptions by 14% and significantly optimizing occupational safety metrics across high-acuity medical disciplines.

What are the market trends shaping the Latex Medical Gloves Industry?

  • The increasing adoption of automated glove manufacturing lines is an upcoming market trend. This shift toward advanced production technologies enhances operational efficiency and consistency across medical consumable supply chains.

  • The rapid integration of automated manufacturing lines is fundamentally transforming operational throughput for medical barrier solutions. Facilities deploying modernized dip-molding technology experience a 25% increase in production efficiency while simultaneously improving uniform tensile strength across high-volume batches.
  • Advanced quality assurance monitoring embedded within the automated vulcanization process reduces structural defect rates by 18%, securing better supply chain visibility for clinical distributors. This shift accommodates the demanding requirements of minimally invasive techniques by consistently delivering gloves with a precise micro-textured surface that enhances instrument grip without compromising dexterity.
  • Furthermore, manufacturers are establishing sustainable sourcing traceability frameworks designed to stabilize raw material procurement. These systemic upgrades lower resource waste by 12% and establish a foundational pathway toward developing biodegradable medical consumables, directly aligning factory innovations with institutional sustainability mandates.

What challenges does the Latex Medical Gloves Industry face during its growth?

  • Volatility in natural latex raw material supply and pricing presents a significant structural challenge that disrupts procurement stability and compresses manufacturing margins.

  • Severe volatility in agricultural raw material availability introduces structural pricing unpredictability, fundamentally challenging inventory management resilience across regional distribution networks. Stringent medical device regulation and compliance mandates inflate administrative testing costs by 21%, straining operational margins for mid-tier manufacturers.
  • Facilities operating in emergency care environments demand consistent puncture resistance and tear resistance, forcing suppliers to utilize extensive chlorination process optimization to maintain quality parameters. Simultaneously, the persistent clinical requirement for protein allergy mitigation complicates material scaling, limiting widespread deployment in sensitive postoperative care protocols.
  • Managing these strict material certification burdens decreases supply agility, prolonging order fulfillment cycles by 16% across international procurement corridors and requiring heavy capital investments in localized buffer inventories.

Exclusive Technavio Analysis on Customer Landscape

The latex medical gloves market forecasting report includes the adoption lifecycle of the market, covering from the innovator’s stage to the laggard’s stage. It focuses on adoption rates in different regions based on penetration. Furthermore, the latex medical gloves market report also includes key purchase criteria and drivers of price sensitivity to help companies evaluate and develop their market growth analysis strategies.
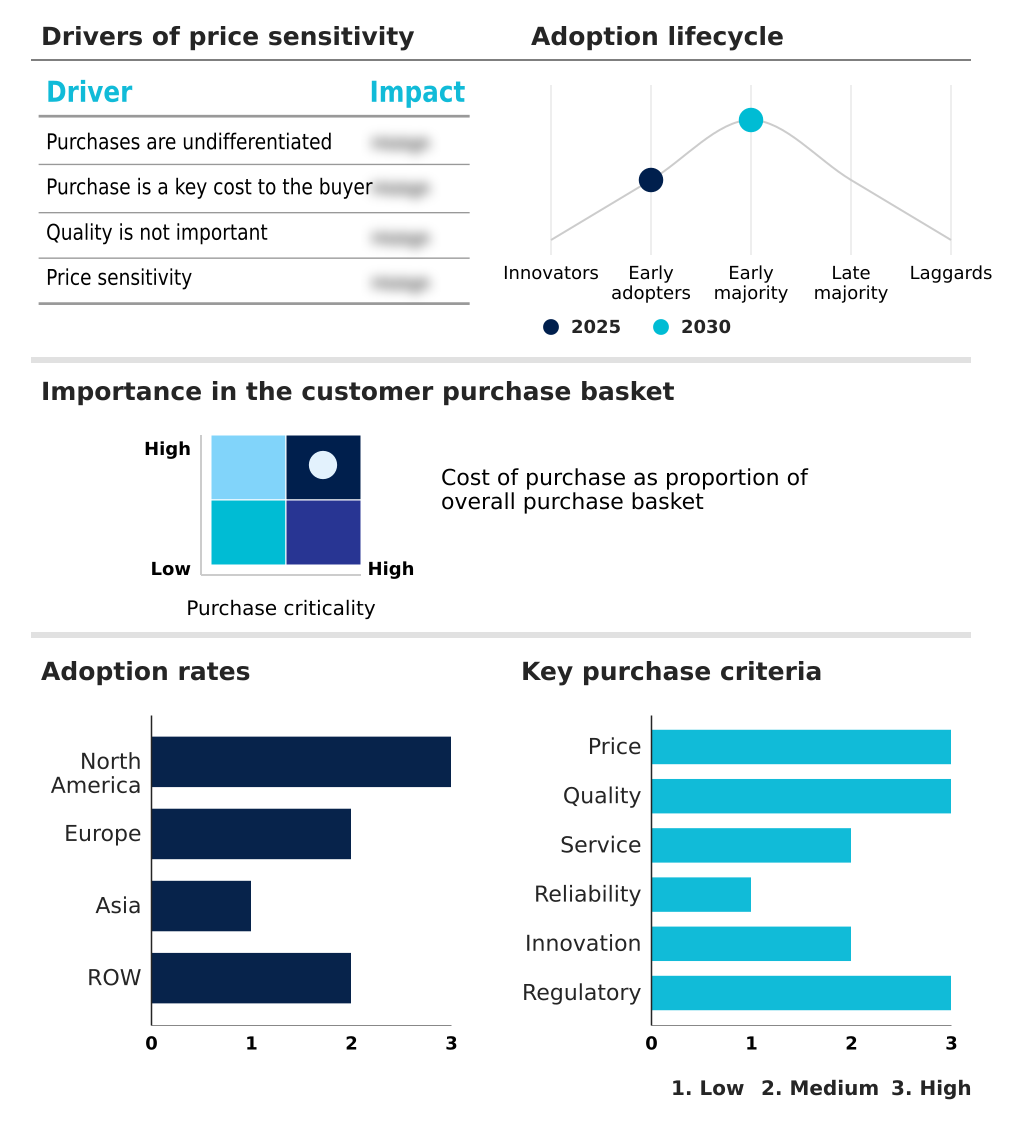
Customer Landscape of Latex Medical Gloves Industry

Competitive Landscape

Companies are implementing various strategies, such as strategic alliances, latex medical gloves market forecast, partnerships, mergers and acquisitions, geographical expansion, and product/service launches, to enhance their presence in the industry.

Ansell Ltd. - Vendors deliver multi-use hand protection solutions, including surgical, examination, and powder-free devices, specifically engineered to support active infection prevention and sterile clinical operations across advanced healthcare facilities.

The industry research and growth report includes detailed analyses of the competitive landscape of the market and information about key companies, including:

  • Ansell Ltd.
  • B.Braun SE
  • Clean Grip Malaysia Sdn. Bhd
  • Dynarex Corp.
  • Hartalega Holdings Berhad
  • Kanam Latex Industries Pvt. Ltd
  • Kimberly Clark Corp.
  • Kossan Rubber Industries Bhd
  • Mercator Medical SA
  • Molnlycke Health Care AB
  • Riverstone Holdings Ltd.
  • SHIELD Scientific BV
  • Supermax Corp. Berhad
  • Thermo Fisher Scientific Inc.
  • Top Glove Corp. Bhd
  • Troge Medical GmbH
  • UG Healthcare Corp. Ltd.
  • Valutek Inc.

Qualitative and quantitative analysis of companies has been conducted to help clients understand the wider business environment as well as the strengths and weaknesses of key industry players. Data is qualitatively analyzed to categorize companies as pure play, category-focused, industry-focused, and diversified; it is quantitatively analyzed to categorize companies as dominant, leading, strong, tentative, and weak.

Recent Development and News in Latex medical gloves market

  • In the Health Care Supplies industry, the implementation of stringent environmental safety mandates regarding hospital waste disposal shifted 15% of institutional procurement toward naturally derived materials, directly increasing demand for Latex Medical Gloves as compliant protective barriers.
  • The rapid expansion of decentralized outpatient surgical centers accelerated ambulatory procedure volumes by 20%, requiring heightened inventory turnover for infection control materials and directly propelling routine consumption of Latex Medical Gloves within non-hospital clinical settings.
  • Advancements in automated dip-molding technologies and digital quality assurance improved batch yield efficiency by 18% across the protective equipment sector, subsequently stabilizing the supply chain and production output for Latex Medical Gloves during raw material fluctuations.
  • Strict enforcement of revised medical device biocompatibility standards increased regulatory audit frequencies by 25% for synthetic barrier products, prompting healthcare administrators to maintain stable procurement of compliant Latex Medical Gloves to avoid occupational hazard penalties.

Dive into Technavio’s robust research methodology, blending expert interviews, extensive data synthesis, and validated models for unparalleled Latex Medical Gloves Market insights. See full methodology.

Market Scope
Page number 290
Base year 2025
Historic period 2020-2024
Forecast period 2026-2030
Growth momentum & CAGR Accelerate at a CAGR of 7.3%
Market growth 2026-2030 USD 4108.5 million
Market structure Fragmented
YoY growth 2025-2026(%) 6.9%
Key countries US, Canada, Mexico, Germany, UK, France, Italy, Spain, The Netherlands, China, Japan, India, South Korea, Thailand, Indonesia, Brazil, Saudi Arabia, UAE, Turkey, Argentina, South Africa, Colombia and Israel
Competitive landscape Leading Companies, Market Positioning of Companies, Competitive Strategies, and Industry Risks

Request Free Sample

Research Analyst Overview

  • The rapid advancement of automated manufacturing lines within the medical consumables sector is fundamentally reshaping production economics and boardroom strategic planning. Executives increasingly link production automation to regulatory compliance budgeting, recognizing that consistent output quality mitigates the risk of costly medical device recalls. Utilizing highly controlled dip-molding technology ensures uniform tensile strength and structural integrity across millions of units.
  • This precision engineering reduces batch rejection rates by 22%, directly improving profit margins and accelerating order fulfillment capabilities for institutional distributors. Furthermore, optimizing the vulcanization process enables the consistent production of gloves featuring a micro-textured surface and high puncture resistance, which are essential for demanding sterile surgical applications.
  • Boardrooms are leveraging these efficiency gains to redirect capital toward establishing biodegradable medical consumables, aligning corporate product strategies with incoming environmental mandates. Enhancing baseline chemical resistance and tactile sensitivity through advanced production techniques remains a critical differentiator, empowering healthcare networks to standardize their protective protocols while ensuring uncompromised occupational safety across diverse clinical environments.

What are the Key Data Covered in this Latex Medical Gloves Market Research and Growth Report?

  • What is the expected growth of the Latex Medical Gloves Market between 2026 and 2030?

    • USD 4.11 billion, at a CAGR of 7.3%

  • What segmentation does the market report cover?

    • The report is segmented by Product (Disposable, and Reusable), Form Factor (Powder-free gloves, and Powdered gloves), End-user (Hospitals, Clinics, Ambulatory surgery centers, Diagnostic laboratories, and Others) and Geography (North America, Europe, Asia, Rest of World (ROW))

  • Which regions are analyzed in the report?

    • North America, Europe, Asia and Rest of World (ROW)

  • What are the key growth drivers and market challenges?

    • Increasing surgical procedure volumes across healthcare systems, Volatility in natural latex raw material supply and pricing

  • Who are the major players in the Latex Medical Gloves Market?

    • Ansell Ltd., B.Braun SE, Clean Grip Malaysia Sdn. Bhd, Dynarex Corp., Hartalega Holdings Berhad, Kanam Latex Industries Pvt. Ltd, Kimberly Clark Corp., Kossan Rubber Industries Bhd, Mercator Medical SA, Molnlycke Health Care AB, Riverstone Holdings Ltd., SHIELD Scientific BV, Supermax Corp. Berhad, Thermo Fisher Scientific Inc., Top Glove Corp. Bhd, Troge Medical GmbH, UG Healthcare Corp. Ltd. and Valutek Inc.

Market Research Insights

  • The Latex Medical Gloves Market continues to mature as administrators enforce stringent patient safety standards and reinforce healthcare facility procurement pipelines. Widespread implementation of personal protective equipment within acute care facilities drives critical consumption patterns. By upgrading their sterile barrier systems, hospitals reduce cross-contamination incidents by 14%, directly improving clinical outcomes and minimizing readmission liabilities.
  • Furthermore, modernizing diagnostic laboratory safety protocols with high-performance barrier materials improves workflow efficiency by 18%, substantially lowering sample contamination rates. These measurable improvements enable healthcare institutions to maintain resilient operations and navigate stringent regulatory audits while systematically lowering emergency operational overhead.

We can help! Our analysts can customize this latex medical gloves market research report to meet your requirements.

Get in touch

1. Executive Summary

1.1 Market overview

Executive Summary - Chart on Market Overview
Executive Summary - Data Table on Market Overview
Executive Summary - Chart on Global Market Characteristics
Executive Summary - Chart on Market by Geography
Executive Summary - Chart on Market Segmentation by Product
Executive Summary - Chart on Market Segmentation by Form Factor
Executive Summary - Chart on Market Segmentation by End-user
Executive Summary - Chart on Incremental Growth
Executive Summary - Data Table on Incremental Growth
Executive Summary - Chart on Company Market Positioning

2. Technavio Analysis

2.1 Analysis of price sensitivity, lifecycle, customer purchase basket, adoption rates, and purchase criteria

2.2 Criticality of inputs and Factors of differentiation

Chart on Overview on criticality of inputs and factors of differentiation

2.3 Factors of disruption

Chart on Overview on factors of disruption

2.4 Impact of drivers and challenges

Chart on Impact of drivers and challenges in 2025 and 2030

3. Market Landscape

3.1 Market ecosystem

Chart on Parent Market
Data Table on - Parent Market

3.2 Market characteristics

Chart on Market characteristics analysis

3.3 Value chain analysis

Chart on Value chain analysis

4. Market Sizing

4.1 Market definition

Data Table on Offerings of companies included in the market definition

4.2 Market segment analysis

Market segments

4.3 Market size 2025

4.4 Market outlook: Forecast for 2025-2030

Chart on Global - Market size and forecast 2025-2030 ($ million)
Data Table on Global - Market size and forecast 2025-2030 ($ million)
Chart on Global Market: Year-over-year growth 2025-2030 (%)
Data Table on Global Market: Year-over-year growth 2025-2030 (%)

5. Historic Market Size

5.1 Global Latex Medical Gloves Market 2020 - 2024

Historic Market Size - Data Table on Global Latex Medical Gloves Market 2020 - 2024 ($ million)

5.2 Product segment analysis 2020 - 2024

Historic Market Size - Product Segment 2020 - 2024 ($ million)

5.3 Form Factor segment analysis 2020 - 2024

Historic Market Size - Form Factor Segment 2020 - 2024 ($ million)

5.4 End-user segment analysis 2020 - 2024

Historic Market Size - End-user Segment 2020 - 2024 ($ million)

5.5 Geography segment analysis 2020 - 2024

Historic Market Size - Geography Segment 2020 - 2024 ($ million)

5.6 Country segment analysis 2020 - 2024

Historic Market Size - Country Segment 2020 - 2024 ($ million)

6. Qualitative Analysis

6.1 Impact of AI on global latex medical gloves market

6.2 Impact of geopolitical conflicts on global latex medical gloves market

7. Five Forces Analysis

7.1 Five forces summary

Five forces analysis - Comparison between 2025 and 2030

7.2 Bargaining power of buyers

Bargaining power of buyers - Impact of key factors 2025 and 2030

7.3 Bargaining power of suppliers

Bargaining power of suppliers - Impact of key factors in 2025 and 2030

7.4 Threat of new entrants

Threat of new entrants - Impact of key factors in 2025 and 2030

7.5 Threat of substitutes

Threat of substitutes - Impact of key factors in 2025 and 2030

7.6 Threat of rivalry

Threat of rivalry - Impact of key factors in 2025 and 2030

7.7 Market condition

Chart on Market condition - Five forces 2025 and 2030

8. Market Segmentation by Product

8.1 Market segments

Chart on Product - Market share 2025-2030 (%)
Data Table on Product - Market share 2025-2030 (%)

8.2 Comparison by Product

Chart on Comparison by Product
Data Table on Comparison by Product

8.3 Disposable - Market size and forecast 2025-2030

Chart on Disposable - Market size and forecast 2025-2030 ($ million)
Data Table on Disposable - Market size and forecast 2025-2030 ($ million)
Chart on Disposable - Year-over-year growth 2025-2030 (%)
Data Table on Disposable - Year-over-year growth 2025-2030 (%)

8.4 Reusable - Market size and forecast 2025-2030

Chart on Reusable - Market size and forecast 2025-2030 ($ million)
Data Table on Reusable - Market size and forecast 2025-2030 ($ million)
Chart on Reusable - Year-over-year growth 2025-2030 (%)
Data Table on Reusable - Year-over-year growth 2025-2030 (%)

8.5 Market opportunity by Product

Market opportunity by Product ($ million)
Data Table on Market opportunity by Product ($ million)

9. Market Segmentation by Form Factor

9.1 Market segments

Chart on Form Factor - Market share 2025-2030 (%)
Data Table on Form Factor - Market share 2025-2030 (%)

9.2 Comparison by Form Factor

Chart on Comparison by Form Factor
Data Table on Comparison by Form Factor

9.3 Powder-free gloves - Market size and forecast 2025-2030

Chart on Powder-free gloves - Market size and forecast 2025-2030 ($ million)
Data Table on Powder-free gloves - Market size and forecast 2025-2030 ($ million)
Chart on Powder-free gloves - Year-over-year growth 2025-2030 (%)
Data Table on Powder-free gloves - Year-over-year growth 2025-2030 (%)

9.4 Powdered gloves - Market size and forecast 2025-2030

Chart on Powdered gloves - Market size and forecast 2025-2030 ($ million)
Data Table on Powdered gloves - Market size and forecast 2025-2030 ($ million)
Chart on Powdered gloves - Year-over-year growth 2025-2030 (%)
Data Table on Powdered gloves - Year-over-year growth 2025-2030 (%)

9.5 Market opportunity by Form Factor

Market opportunity by Form Factor ($ million)
Data Table on Market opportunity by Form Factor ($ million)

10. Market Segmentation by End-user

10.1 Market segments

Chart on End-user - Market share 2025-2030 (%)
Data Table on End-user - Market share 2025-2030 (%)

10.2 Comparison by End-user

Chart on Comparison by End-user
Data Table on Comparison by End-user

10.3 Hospitals - Market size and forecast 2025-2030

Chart on Hospitals - Market size and forecast 2025-2030 ($ million)
Data Table on Hospitals - Market size and forecast 2025-2030 ($ million)
Chart on Hospitals - Year-over-year growth 2025-2030 (%)
Data Table on Hospitals - Year-over-year growth 2025-2030 (%)

10.4 Clinics - Market size and forecast 2025-2030

Chart on Clinics - Market size and forecast 2025-2030 ($ million)
Data Table on Clinics - Market size and forecast 2025-2030 ($ million)
Chart on Clinics - Year-over-year growth 2025-2030 (%)
Data Table on Clinics - Year-over-year growth 2025-2030 (%)

10.5 Ambulatory surgery centers - Market size and forecast 2025-2030

Chart on Ambulatory surgery centers - Market size and forecast 2025-2030 ($ million)
Data Table on Ambulatory surgery centers - Market size and forecast 2025-2030 ($ million)
Chart on Ambulatory surgery centers - Year-over-year growth 2025-2030 (%)
Data Table on Ambulatory surgery centers - Year-over-year growth 2025-2030 (%)

10.6 Diagnostic laboratories - Market size and forecast 2025-2030

Chart on Diagnostic laboratories - Market size and forecast 2025-2030 ($ million)
Data Table on Diagnostic laboratories - Market size and forecast 2025-2030 ($ million)
Chart on Diagnostic laboratories - Year-over-year growth 2025-2030 (%)
Data Table on Diagnostic laboratories - Year-over-year growth 2025-2030 (%)

10.7 Others - Market size and forecast 2025-2030

Chart on Others - Market size and forecast 2025-2030 ($ million)
Data Table on Others - Market size and forecast 2025-2030 ($ million)
Chart on Others - Year-over-year growth 2025-2030 (%)
Data Table on Others - Year-over-year growth 2025-2030 (%)

10.8 Market opportunity by End-user

Market opportunity by End-user ($ million)
Data Table on Market opportunity by End-user ($ million)

11. Customer Landscape

11.1 Customer landscape overview

Analysis of price sensitivity, lifecycle, customer purchase basket, adoption rates, and purchase criteria

12. Geographic Landscape

12.1 Geographic segmentation

Chart on Market share by geography 2025-2030 (%)
Data Table on Market share by geography 2025-2030 (%)

12.2 Geographic comparison

Chart on Geographic comparison
Data Table on Geographic comparison

12.3 North America - Market size and forecast 2025-2030

Chart on North America - Market size and forecast 2025-2030 ($ million)
Data Table on North America - Market size and forecast 2025-2030 ($ million)
Chart on North America - Year-over-year growth 2025-2030 (%)
Data Table on North America - Year-over-year growth 2025-2030 (%)
Chart on Regional Comparison - North America
Data Table on Regional Comparison - North America

12.3.1 US - Market size and forecast 2025-2030

Chart on US - Market size and forecast 2025-2030 ($ million)
Data Table on US - Market size and forecast 2025-2030 ($ million)
Chart on US - Year-over-year growth 2025-2030 (%)
Data Table on US - Year-over-year growth 2025-2030 (%)

12.3.2 Canada - Market size and forecast 2025-2030

Chart on Canada - Market size and forecast 2025-2030 ($ million)
Data Table on Canada - Market size and forecast 2025-2030 ($ million)
Chart on Canada - Year-over-year growth 2025-2030 (%)
Data Table on Canada - Year-over-year growth 2025-2030 (%)

12.3.3 Mexico - Market size and forecast 2025-2030

Chart on Mexico - Market size and forecast 2025-2030 ($ million)
Data Table on Mexico - Market size and forecast 2025-2030 ($ million)
Chart on Mexico - Year-over-year growth 2025-2030 (%)
Data Table on Mexico - Year-over-year growth 2025-2030 (%)

12.4 Europe - Market size and forecast 2025-2030

Chart on Europe - Market size and forecast 2025-2030 ($ million)
Data Table on Europe - Market size and forecast 2025-2030 ($ million)
Chart on Europe - Year-over-year growth 2025-2030 (%)
Data Table on Europe - Year-over-year growth 2025-2030 (%)
Chart on Regional Comparison - Europe
Data Table on Regional Comparison - Europe

12.4.1 Germany - Market size and forecast 2025-2030

Chart on Germany - Market size and forecast 2025-2030 ($ million)
Data Table on Germany - Market size and forecast 2025-2030 ($ million)
Chart on Germany - Year-over-year growth 2025-2030 (%)
Data Table on Germany - Year-over-year growth 2025-2030 (%)

12.4.2 UK - Market size and forecast 2025-2030

Chart on UK - Market size and forecast 2025-2030 ($ million)
Data Table on UK - Market size and forecast 2025-2030 ($ million)
Chart on UK - Year-over-year growth 2025-2030 (%)
Data Table on UK - Year-over-year growth 2025-2030 (%)

12.4.3 France - Market size and forecast 2025-2030

Chart on France - Market size and forecast 2025-2030 ($ million)
Data Table on France - Market size and forecast 2025-2030 ($ million)
Chart on France - Year-over-year growth 2025-2030 (%)
Data Table on France - Year-over-year growth 2025-2030 (%)

12.4.4 Italy - Market size and forecast 2025-2030

Chart on Italy - Market size and forecast 2025-2030 ($ million)
Data Table on Italy - Market size and forecast 2025-2030 ($ million)
Chart on Italy - Year-over-year growth 2025-2030 (%)
Data Table on Italy - Year-over-year growth 2025-2030 (%)

12.4.5 Spain - Market size and forecast 2025-2030

Chart on Spain - Market size and forecast 2025-2030 ($ million)
Data Table on Spain - Market size and forecast 2025-2030 ($ million)
Chart on Spain - Year-over-year growth 2025-2030 (%)
Data Table on Spain - Year-over-year growth 2025-2030 (%)

12.4.6 The Netherlands - Market size and forecast 2025-2030

Chart on The Netherlands - Market size and forecast 2025-2030 ($ million)
Data Table on The Netherlands - Market size and forecast 2025-2030 ($ million)
Chart on The Netherlands - Year-over-year growth 2025-2030 (%)
Data Table on The Netherlands - Year-over-year growth 2025-2030 (%)

12.5 Asia - Market size and forecast 2025-2030

Chart on Asia - Market size and forecast 2025-2030 ($ million)
Data Table on Asia - Market size and forecast 2025-2030 ($ million)
Chart on Asia - Year-over-year growth 2025-2030 (%)
Data Table on Asia - Year-over-year growth 2025-2030 (%)
Chart on Regional Comparison - Asia
Data Table on Regional Comparison - Asia

12.5.1 China - Market size and forecast 2025-2030

Chart on China - Market size and forecast 2025-2030 ($ million)
Data Table on China - Market size and forecast 2025-2030 ($ million)
Chart on China - Year-over-year growth 2025-2030 (%)
Data Table on China - Year-over-year growth 2025-2030 (%)

12.5.2 Japan - Market size and forecast 2025-2030

Chart on Japan - Market size and forecast 2025-2030 ($ million)
Data Table on Japan - Market size and forecast 2025-2030 ($ million)
Chart on Japan - Year-over-year growth 2025-2030 (%)
Data Table on Japan - Year-over-year growth 2025-2030 (%)

12.5.3 India - Market size and forecast 2025-2030

Chart on India - Market size and forecast 2025-2030 ($ million)
Data Table on India - Market size and forecast 2025-2030 ($ million)
Chart on India - Year-over-year growth 2025-2030 (%)
Data Table on India - Year-over-year growth 2025-2030 (%)

12.5.4 South Korea - Market size and forecast 2025-2030

Chart on South Korea - Market size and forecast 2025-2030 ($ million)
Data Table on South Korea - Market size and forecast 2025-2030 ($ million)
Chart on South Korea - Year-over-year growth 2025-2030 (%)
Data Table on South Korea - Year-over-year growth 2025-2030 (%)

12.5.5 Thailand - Market size and forecast 2025-2030

Chart on Thailand - Market size and forecast 2025-2030 ($ million)
Data Table on Thailand - Market size and forecast 2025-2030 ($ million)
Chart on Thailand - Year-over-year growth 2025-2030 (%)
Data Table on Thailand - Year-over-year growth 2025-2030 (%)

12.5.6 Indonesia - Market size and forecast 2025-2030

Chart on Indonesia - Market size and forecast 2025-2030 ($ million)
Data Table on Indonesia - Market size and forecast 2025-2030 ($ million)
Chart on Indonesia - Year-over-year growth 2025-2030 (%)
Data Table on Indonesia - Year-over-year growth 2025-2030 (%)

12.6 Rest of World (ROW) - Market size and forecast 2025-2030

Chart on Rest of World (ROW) - Market size and forecast 2025-2030 ($ million)
Data Table on Rest of World (ROW) - Market size and forecast 2025-2030 ($ million)
Chart on Rest of World (ROW) - Year-over-year growth 2025-2030 (%)
Data Table on Rest of World (ROW) - Year-over-year growth 2025-2030 (%)
Chart on Regional Comparison - Rest of World (ROW)
Data Table on Regional Comparison - Rest of World (ROW)

12.6.1 Brazil - Market size and forecast 2025-2030

Chart on Brazil - Market size and forecast 2025-2030 ($ million)
Data Table on Brazil - Market size and forecast 2025-2030 ($ million)
Chart on Brazil - Year-over-year growth 2025-2030 (%)
Data Table on Brazil - Year-over-year growth 2025-2030 (%)

12.6.2 Saudi Arabia - Market size and forecast 2025-2030

Chart on Saudi Arabia - Market size and forecast 2025-2030 ($ million)
Data Table on Saudi Arabia - Market size and forecast 2025-2030 ($ million)
Chart on Saudi Arabia - Year-over-year growth 2025-2030 (%)
Data Table on Saudi Arabia - Year-over-year growth 2025-2030 (%)

12.6.3 UAE - Market size and forecast 2025-2030

Chart on UAE - Market size and forecast 2025-2030 ($ million)
Data Table on UAE - Market size and forecast 2025-2030 ($ million)
Chart on UAE - Year-over-year growth 2025-2030 (%)
Data Table on UAE - Year-over-year growth 2025-2030 (%)

12.6.4 Turkey - Market size and forecast 2025-2030

Chart on Turkey - Market size and forecast 2025-2030 ($ million)
Data Table on Turkey - Market size and forecast 2025-2030 ($ million)
Chart on Turkey - Year-over-year growth 2025-2030 (%)
Data Table on Turkey - Year-over-year growth 2025-2030 (%)

12.6.5 Argentina - Market size and forecast 2025-2030

Chart on Argentina - Market size and forecast 2025-2030 ($ million)
Data Table on Argentina - Market size and forecast 2025-2030 ($ million)
Chart on Argentina - Year-over-year growth 2025-2030 (%)
Data Table on Argentina - Year-over-year growth 2025-2030 (%)

12.6.6 South Africa - Market size and forecast 2025-2030

Chart on South Africa - Market size and forecast 2025-2030 ($ million)
Data Table on South Africa - Market size and forecast 2025-2030 ($ million)
Chart on South Africa - Year-over-year growth 2025-2030 (%)
Data Table on South Africa - Year-over-year growth 2025-2030 (%)

12.6.7 Colombia - Market size and forecast 2025-2030

Chart on Colombia - Market size and forecast 2025-2030 ($ million)
Data Table on Colombia - Market size and forecast 2025-2030 ($ million)
Chart on Colombia - Year-over-year growth 2025-2030 (%)
Data Table on Colombia - Year-over-year growth 2025-2030 (%)

12.6.8 Israel - Market size and forecast 2025-2030

Chart on Israel - Market size and forecast 2025-2030 ($ million)
Data Table on Israel - Market size and forecast 2025-2030 ($ million)
Chart on Israel - Year-over-year growth 2025-2030 (%)
Data Table on Israel - Year-over-year growth 2025-2030 (%)

12.7 Market opportunity by geography

Market opportunity by geography ($ million)
Data Tables on Market opportunity by geography ($ million)

13. Drivers, Challenges, and Opportunity

13.1 Market drivers

Increasing surgical procedure volumes across healthcare systems
Expanding infection prevention protocols in clinical settings
Growing healthcare infrastructure investments in emerging economies

13.2 Market challenges

Volatility in natural latex raw material supply and pricing
Persistent risk of latex allergy related usage limitations
Rising regulatory compliance and product certification burden

13.3 Impact of drivers and challenges

Impact of drivers and challenges in 2025 and 2030

13.4 Market opportunities

Increasing adoption of automated glove manufacturing lines
Advancing sustainable sourcing and traceability practices
Growing shift toward premium textured and specialty latex gloves

14. Competitive Landscape

14.1 Overview

14.2

Overview on criticality of inputs and factors of differentiation

14.3 Landscape disruption

Overview on factors of disruption

14.4 Industry risks

Impact of key risks on business

15. Competitive Analysis

15.1 Companies profiled

Companies covered

15.2 Company ranking index

15.3 Market positioning of companies

Matrix on companies position and classification

15.4 Ansell Ltd.

Ansell Ltd. - Overview
Ansell Ltd. - Business segments
Ansell Ltd. - Key offerings
Ansell Ltd. - Segment focus
SWOT

15.5 B.Braun SE

B.Braun SE - Overview
B.Braun SE - Product / Service
B.Braun SE - Key offerings
SWOT

15.6 Clean Grip Malaysia Sdn. Bhd

Clean Grip Malaysia Sdn. Bhd - Overview
Clean Grip Malaysia Sdn. Bhd - Product / Service
Clean Grip Malaysia Sdn. Bhd - Key offerings
SWOT

15.7 Dynarex Corp.

Dynarex Corp. - Overview
Dynarex Corp. - Product / Service
Dynarex Corp. - Key offerings
SWOT

15.8 Hartalega Holdings Berhad

Hartalega Holdings Berhad - Overview
Hartalega Holdings Berhad - Product / Service
Hartalega Holdings Berhad - Key offerings
SWOT

15.9 Kimberly Clark Corp.

Kimberly Clark Corp. - Overview
Kimberly Clark Corp. - Business segments
Kimberly Clark Corp. - Key news
Kimberly Clark Corp. - Key offerings
Kimberly Clark Corp. - Segment focus
SWOT

15.10 Kossan Rubber Industries Bhd

Kossan Rubber Industries Bhd - Overview
Kossan Rubber Industries Bhd - Business segments
Kossan Rubber Industries Bhd - Key offerings
Kossan Rubber Industries Bhd - Segment focus
SWOT

15.11 Molnlycke Health Care AB

Molnlycke Health Care AB - Overview
Molnlycke Health Care AB - Product / Service
Molnlycke Health Care AB - Key offerings
SWOT

15.12 Riverstone Holdings Ltd.

Riverstone Holdings Ltd. - Overview
Riverstone Holdings Ltd. - Product / Service
Riverstone Holdings Ltd. - Key offerings
SWOT

15.13 SHIELD Scientific BV

SHIELD Scientific BV - Overview
SHIELD Scientific BV - Product / Service
SHIELD Scientific BV - Key offerings
SWOT

15.14 Supermax Corp. Berhad

Supermax Corp. Berhad - Overview
Supermax Corp. Berhad - Product / Service
Supermax Corp. Berhad - Key offerings
SWOT

15.15 Thermo Fisher Scientific Inc.

Thermo Fisher Scientific Inc. - Overview
Thermo Fisher Scientific Inc. - Business segments
Thermo Fisher Scientific Inc. - Key news
Thermo Fisher Scientific Inc. - Key offerings
Thermo Fisher Scientific Inc. - Segment focus
SWOT

15.16 Top Glove Corp. Bhd

Top Glove Corp. Bhd - Overview
Top Glove Corp. Bhd - Business segments
Top Glove Corp. Bhd - Key offerings
Top Glove Corp. Bhd - Segment focus
SWOT

15.17 Troge Medical GmbH

Troge Medical GmbH - Overview
Troge Medical GmbH - Product / Service
Troge Medical GmbH - Key offerings
SWOT

15.18 UG Healthcare Corp. Ltd.

UG Healthcare Corp. Ltd. - Overview
UG Healthcare Corp. Ltd. - Business segments
UG Healthcare Corp. Ltd. - Key offerings
UG Healthcare Corp. Ltd. - Segment focus
SWOT

16. Appendix

16.1 Scope of the report

Market definition
Objectives
Notes and caveats

16.2 Inclusions and exclusions checklist

Inclusions checklist
Exclusions checklist

16.3 Currency conversion rates for US$

16.4 Research methodology

16.5 Data procurement

Information sources

16.6 Data validation

16.7 Validation techniques employed for market sizing

16.8 Data synthesis

16.9 360 degree market analysis

16.10 List of abbreviations

Research Methodology

Technavio presents a detailed picture of the market by way of study, synthesis, and summation of data from multiple sources. The analysts have presented the various facets of the market with a particular focus on identifying the key industry influencers. The data thus presented is comprehensive, reliable, and the result of extensive research, both primary and secondary.

INFORMATION SOURCES

Primary sources

  • Manufacturers and suppliers
  • Channel partners
  • Industry experts
  • Strategic decision makers

Secondary sources

  • Industry journals and periodicals
  • Government data
  • Financial reports of key industry players
  • Historical data
  • Press releases

DATA ANALYSIS

Data Synthesis

  • Collation of data
  • Estimation of key figures
  • Analysis of derived insights

Data Validation

  • Triangulation with data models
  • Reference against proprietary databases
  • Corroboration with industry experts

REPORT WRITING

Qualitative

  • Market drivers
  • Market challenges
  • Market trends
  • Five forces analysis

Quantitative

  • Market size and forecast
  • Market segmentation
  • Geographical insights
  • Competitive landscape

Interested in this report?

Get your sample now to see our research methodology and insights!

Download Now

Frequently Asked Questions

Latex Medical Gloves market growth will increase by USD 4108.5 million during 2026-2030.

The Latex Medical Gloves market is expected to grow at a CAGR of 7.3% during 2026-2030.

Latex Medical Gloves market is segmented by Product (Disposable, Reusable) Form factor (Powder-free gloves, Powdered gloves) End-user (Hospitals, Clinics, Ambulatory surgery centers, Diagnostic laboratories, Others)

Ansell Ltd., B.Braun SE, Clean Grip Malaysia Sdn. Bhd, Dynarex Corp., Hartalega Holdings Berhad, Kanam Latex Industries Pvt. Ltd, Kimberly Clark Corp., Kossan Rubber Industries Bhd, Mercator Medical SA, Molnlycke Health Care AB, Riverstone Holdings Ltd., SHIELD Scientific BV, Supermax Corp. Berhad, Thermo Fisher Scientific Inc., Top Glove Corp. Bhd, Troge Medical GmbH, UG Healthcare Corp. Ltd., Valutek Inc. are a few of the key vendors in the Latex Medical Gloves market.

North America will register the highest growth rate of 33.4% among the other regions. Therefore, the Latex Medical Gloves market in North America is expected to garner significant business opportunities for the vendors during the forecast period.

US, Canada, Mexico, Germany, UK, France, Italy, Spain, The Netherlands, China, Japan, India, South Korea, Thailand, Indonesia, Brazil, Saudi Arabia, UAE, Turkey, Argentina, South Africa, Colombia, Israel

  • Increasing surgical procedure volumes across healthcare systems is the driving factor this market.

The Latex Medical Gloves market vendors should focus on grabbing business opportunities from the Product segment as it accounted for the largest market share in the base year.
RIA - Research AI Assistant
Ask RIA
