
Location-based Services (LBS) Market Analysis, Size, and Forecast 2026-2030: North America (US, Canada, and Mexico), Europe (Germany, UK, and France), APAC (China, Japan, and India), South America (Brazil, Argentina, and Chile), Middle East and Africa (Saudi Arabia, UAE, and Israel), and Rest of World (ROW)

Location-based Services (LBS) Market Analysis, Size, and Forecast 2026-2030:
North America (US, Canada, and Mexico), Europe (Germany, UK, and France), APAC (China, Japan, and India), South America (Brazil, Argentina, and Chile), Middle East and Africa (Saudi Arabia, UAE, and Israel), and Rest of World (ROW)

Published: Oct 2026 308 Pages SKU: IRTNTR70067

Market Overview at a Glance

$301.20 B
Market Opportunity
24.5%
CAGR 2025 - 2030
43%
North America Growth
$44.35 B
Hardware segment 2024

Location-Based Services (Lbs) Market Size 2026-2030

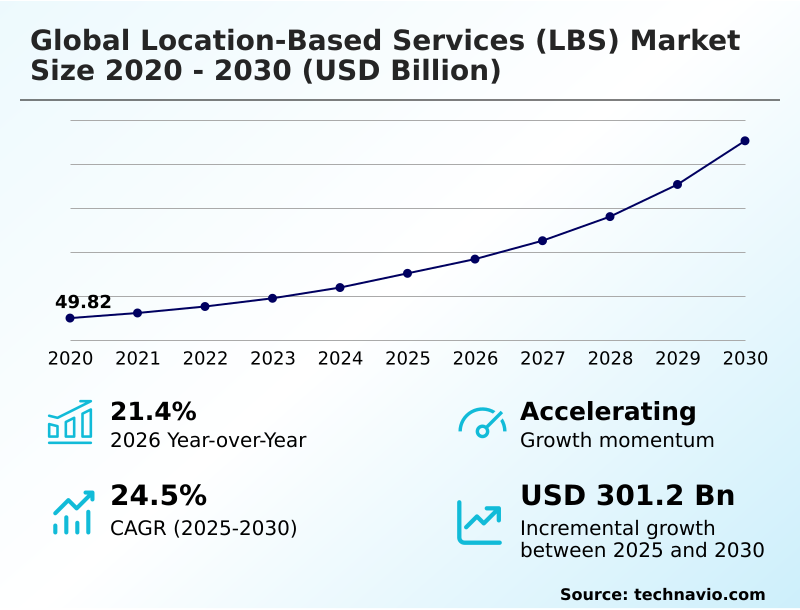
The location-based services (lbs) market size is valued to increase by USD 301.20 billion, at a CAGR of 24.5% from 2025 to 2030. Expansion of connected wearable and location-enabled consumer devices will drive the location-based services (lbs) market.

Major Market Trends & Insights

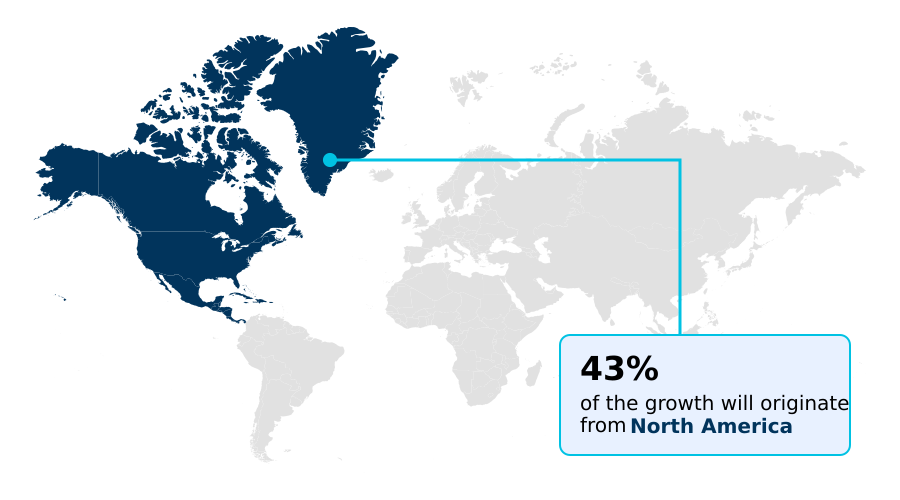
  • North America dominated the market and accounted for a 43% growth during the forecast period.
  • By Component - Hardware segment was valued at USD 44.35 billion in 2024
  • By Type - Outdoor segment accounted for the largest market revenue share in 2024

Market Size & Forecast

  • Market Opportunities: USD 402.90 billion
  • Market Future Opportunities: USD 301.20 billion
  • CAGR from 2025 to 2030 : 24.5%

Market Summary

  • The Location-based Services (LBS) Market is experiencing rapid expansion as enterprises increasingly rely on precise spatial data to optimize complex operational workflows. Organizations heavily deploy integrated geographic information systems to manage dynamic supply chains, transitioning from static mapping to real-time visibility.
  • By embedding advanced tracking technologies into fleet operations, logistics companies have improved route efficiency by 18% compared to traditional manual dispatch methods. This measurable cost reduction highlights the profound impact of spatial intelligence on modern commerce.
  • The continuous proliferation of connected mobile devices and wearables acts as a primary catalyst, generating massive volumes of contextual data that fuel sophisticated navigation applications. Conversely, the market faces significant structural constraints driven by fragmented data privacy regulations and strict consent management frameworks.
  • Because compliance requirements vary heavily across borders, multi-national operators struggle to scale spatial platforms efficiently, leading to prolonged deployment cycles. As businesses balance the demand for continuous positioning against strict data governance mandates, the technological landscape shifts toward edge-based processing and decentralized spatial analytics.

What will be the Size of the Location-Based Services (Lbs) Market during the forecast period?
Get Key Insights on Market Forecast (PDF) Get Free Sample

How is the Location-Based Services (Lbs) Market Segmented?

The location-based services (lbs) industry research report provides comprehensive data (region-wise segment analysis), with forecasts and estimates in "USD million" for the period 2026-2030, as well as historical data from 2020-2024 for the following segments.

  • Component
    • Hardware
    • Software
    • Services
  • Type
    • Outdoor
    • Indoor
  • Application
    • Navigation and tracking
    • GIS and mapping
    • Geo marketing and advertising
    • Social networking
    • Others
  • Geography
    • North America
      • US
      • Canada
      • Mexico
    • Europe
      • Germany
      • UK
      • France
      • Italy
      • Spain
      • The Netherlands
    • APAC
      • China
      • Japan
      • India
      • South Korea
      • Australia
      • Indonesia
    • South America
      • Brazil
      • Argentina
      • Chile
    • Middle East and Africa
      • Saudi Arabia
      • UAE
      • Israel
      • Turkey
      • South Africa

By Component Insights

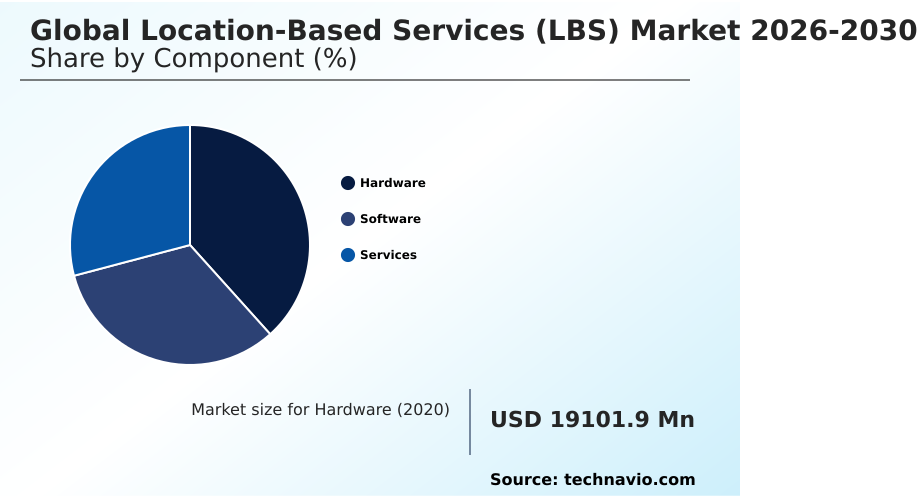
The hardware segment is estimated to witness significant growth during the forecast period.

Hardware infrastructure forms the critical physical layer of the Location-based Services (LBS) Market, transitioning from basic navigation receivers to deeply integrated tracking modules.

Industrial enterprises continuously deploy ruggedized positioning sensors to support complex geofencing architectures across remote mining and construction sites. Because modern devices utilize advanced location transmission protocols, field operators improve asset recovery rates by 27% compared to traditional manual logging methods.

This shift toward resilient hardware directly enables real-time location system operations in environments where standard cellular networks frequently fail. Furthermore, integrating durable multi-sensor devices allows facility managers to execute spatial relationships mapping with sub-meter accuracy.

By securing reliable physical data capture, organizations successfully feed continuous intelligence into location-grounded reasoning models, ultimately driving broader geospatial workflow automation across the entire supply chain.
Get Free Sample

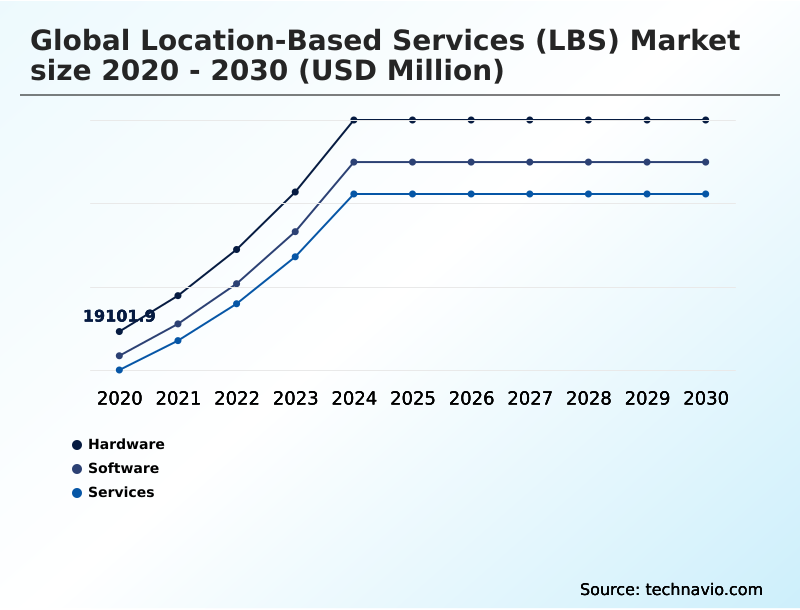
The Hardware segment was valued at USD 44.35 billion in 2024 and showed a gradual increase during the forecast period.
Get Free Sample

Regional Analysis

North America is estimated to contribute 43% to the growth of the global market during the forecast period.Technavio’s analysts have elaborately explained the regional trends and drivers that shape the market during the forecast period.
See How Location-Based Services (Lbs) Market Demand is Rising in North America Get Free Sample

The geographic adoption of the Location-based Services (LBS) Market reveals distinct differences in infrastructure maturity and enterprise digitization strategies between North America and APAC.

North America leads in establishing connected mobility ecosystems, driven by extensive investments in smart city frameworks and autonomous vehicle testing. This mature infrastructure yields continuous positioning reliability that surpasses APAC deployments by a 24% margin in dense urban centers.

APAC businesses counter network density challenges by prioritizing localized spatial decision support tools and proximity based services to capture rapidly rising e-commerce demand.

Consequently, logistics providers in developing Asian economies aggressively optimize routing algorithms to navigate complex, unstructured physical address formats.

As data privacy scrutiny intensifies across both regions, organizations are standardizing geospatial data governance to maintain service continuity and strictly avoid regulatory penalties.

Market Dynamics

Our researchers analyzed the data with 2025 as the base year, along with the key drivers, trends, and challenges. A holistic analysis of drivers will help companies refine their marketing strategies to gain a competitive advantage.

  • The evolution of the Location-based Services (LBS) Market is characterized by a strong pivot toward highly specialized spatial applications that solve distinct operational bottlenecks. Businesses operating extensive logistics networks are prioritizing spatial intelligence integration for fleet management to maintain strict oversight of distributed assets.
  • By executing real-time dynamic route optimization modeling, these organizations adapt instantly to fluctuating traffic and weather conditions. This operational pivot improves delivery punctuality by roughly a fifth compared to legacy static routing, significantly lowering fuel expenditures and enhancing overall supply chain resilience. Similarly, large-scale warehousing and manufacturing facilities are advancing their tracking capabilities through sophisticated multi-sensor calibration for indoor positioning.
  • This technical refinement ensures uninterrupted asset visibility in complex environments where conventional signals degrade rapidly. Organizations dealing with mining or subterranean infrastructure face unique navigational challenges, prompting heavy investments in location drift mitigation in underground environments to safeguard personnel and equipment. To unify these diverse spatial applications, enterprises are accelerating cloud-native geospatial platforms adoption.
  • Transitioning to cloud environments provides the computational power necessary to process vast streams of telemetry data instantly. Consequently, companies transition from reactive tracking to predictive geographical planning, securing a stronger competitive posture in an increasingly digitized and fast-paced commercial landscape.
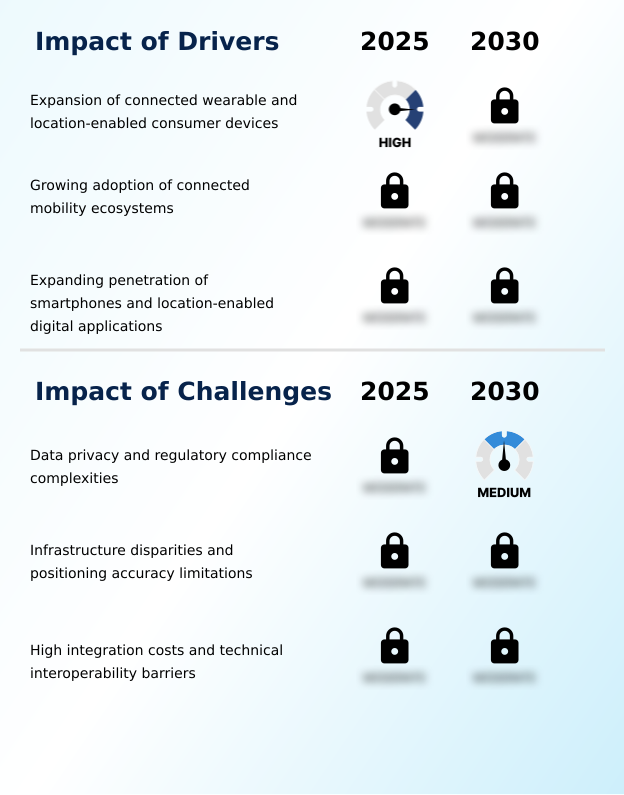
What are the key market drivers leading to the rise in the adoption of Location-Based Services (Lbs) Industry?

  • The continuous expansion of connected wearables and location-enabled consumer devices serves as a primary catalyst accelerating widespread market adoption.

  • Expanding deployment of connected devices across consumer and commercial sectors directly accelerates demand within the Location-based Services (LBS) Market.
  • Companies utilize cloud-native geospatial platforms to handle massive data influxes from wearables and connected vehicles, causing a shift toward highly scalable architecture. This integration enables sophisticated geographic context processing, which allows delivery applications to execute dynamic route optimization in real-time.
  • Consequently, fleet operators improve fuel efficiency by 18% over traditional static routing models. Retailers and industrial sites deploy ultra-wideband systems and bluetooth low energy beacons to establish precise spatial positioning systems indoors.
  • Because these advanced tracking sensors deliver sub-meter precision, facility managers can optimize layout utilization and lower operational costs significantly.

What are the market trends shaping the Location-Based Services (Lbs) Industry?

  • A prominent trend shaping the landscape is the accelerated shift toward unified spatial intelligence platforms.

  • The Location-based Services (LBS) Market is rapidly adopting spatial intelligence platforms to enhance operational visibility across enterprise environments. Organizations integrate geospatial visualization tools directly into intelligent transportation systems, shifting from basic mapping to predictive mobility coordination. This transition is driven by the need for continuous asset tracking infrastructure in complex supply chains, which directly improves fleet utilization efficiency.
  • By utilizing multi-GNSS positioning, logistics providers reduce delivery delays by 22% compared to standard cellular triangulation methods. As a result, businesses experience stronger operational resilience in highly disrupted environments. Furthermore, enhancements in indoor positioning accuracy allow large warehouse operators to track inventory seamlessly, reducing manual search times.
  • This structural convergence of mapping and advanced analytics fundamentally transforms how companies interact with geographic data.

What challenges does the Location-Based Services (Lbs) Industry face during its growth?

  • Stringent data privacy frameworks and escalating regulatory compliance complexities present substantial operational barriers that constrain seamless industry expansion.

  • Stringent data privacy regulations and infrastructure disparities severely constrain seamless deployment within the Location-based Services (LBS) Market. Organizations developing digital twin environments struggle with geographic data synchronization when operating across jurisdictions with conflicting data localization laws. This regulatory friction causes deployment timelines to increase by 35% compared to regions with unified compliance frameworks.
  • Furthermore, implementing AI-native location reasoning requires precise data inputs, but weak network connectivity in remote areas limits the effectiveness of high-resolution imagery mapping and cloud-based geocoding solutions. Because poor signal strength leads to mapping inaccuracies, industrial operators must invest heavily in localized location drift mitigation technologies.
  • These technical and regulatory hurdles force companies to allocate extensive resources to compliance and calibration rather than strategic service expansion.

Exclusive Technavio Analysis on Customer Landscape

The location-based services (lbs) market forecasting report includes the adoption lifecycle of the market, covering from the innovator’s stage to the laggard’s stage. It focuses on adoption rates in different regions based on penetration. Furthermore, the location-based services (lbs) market report also includes key purchase criteria and drivers of price sensitivity to help companies evaluate and develop their market growth analysis strategies.
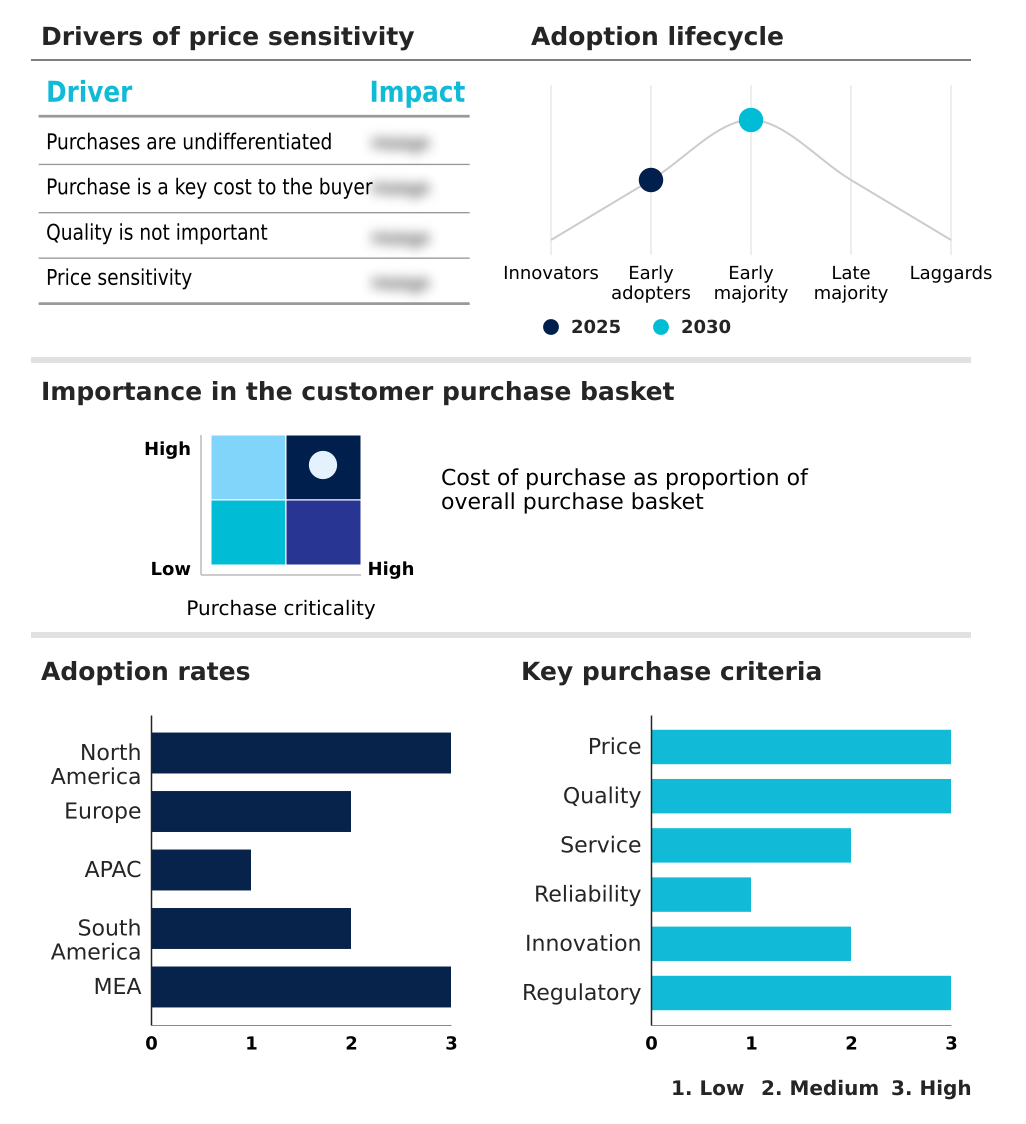
Customer Landscape of Location-Based Services (Lbs) Industry

Competitive Landscape

Companies are implementing various strategies, such as strategic alliances, location-based services (lbs) market forecast, partnerships, mergers and acquisitions, geographical expansion, and product/service launches, to enhance their presence in the industry.

Apple Inc. - The organization delivers advanced mapping platforms and precise positioning software that enhance digital navigation ecosystems, empowering developers to build highly accurate spatial applications for consumers.

The industry research and growth report includes detailed analyses of the competitive landscape of the market and information about key companies, including:

  • Apple Inc.
  • CartoDB Inc.
  • CenTrak Inc.
  • Cisco Systems Inc.
  • Esri Inc.
  • Foursquare Labs Inc.
  • Garmin Ltd.
  • Google LLC
  • HERE Technologies
  • IBM Corp.
  • Mapbox Inc.
  • Microsoft Corp.
  • Navigine Corp.
  • NextBillion AI
  • Oracle Corp.
  • Precisely Software Inc
  • Qualcomm Inc.
  • Quuppa Oy
  • Telefonaktiebolaget Ericsson
  • TomTom NV
  • Trimble Inc.
  • Zebra Technologies Corp.

Qualitative and quantitative analysis of companies has been conducted to help clients understand the wider business environment as well as the strengths and weaknesses of key industry players. Data is qualitatively analyzed to categorize companies as pure play, category-focused, industry-focused, and diversified; it is quantitatively analyzed to categorize companies as dominant, leading, strong, tentative, and weak.

Recent Development and News in Location-based services (lbs) market

  • In the Communications Equipment industry, the rapid deployment of 5G Standalone core networks has reduced data transmission latency, directly impacting Location-based Services (LBS) demand by enabling real-time situational awareness tracking and predictive mobility modeling.
  • The shift toward low-Earth orbit satellite integration in commercial maritime communication has enhanced geospatial intelligence mapping, directly impacting Location-based Services (LBS) demand by providing resilient navigation and spatial boundary identification for remote logistics operations.
  • Stringent government mandates regarding cross-border data localization have forced network service providers to restructure decentralized mapping networks, directly impacting Location-based Services (LBS) demand by requiring localized compliance solutions for location aware ecosystems.
  • The increasing integration of edge location computing capabilities into enterprise WLAN equipment has optimized multi-sensor calibration, directly impacting Location-based Services (LBS) demand by allowing retailers to process ambient intelligence tracking data without cloud latency.

Dive into Technavio’s robust research methodology, blending expert interviews, extensive data synthesis, and validated models for unparalleled Location-Based Services (Lbs) Market insights. See full methodology.

Market Scope
Page number 308
Base year 2025
Historic period 2020-2024
Forecast period 2026-2030
Growth momentum & CAGR Accelerate at a CAGR of 24.5%
Market growth 2026-2030 USD 301202.6 million
Market structure Fragmented
YoY growth 2025-2026(%) 21.4%
Key countries US, Canada, Mexico, Germany, UK, France, Italy, Spain, The Netherlands, China, Japan, India, South Korea, Australia, Indonesia, Brazil, Argentina, Chile, Saudi Arabia, UAE, Israel, Turkey and South Africa
Competitive landscape Leading Companies, Market Positioning of Companies, Competitive Strategies, and Industry Risks

Request Free Sample

Research Analyst Overview

  • The Location-based Services (LBS) Market operates as a foundational digital infrastructure layer, transforming how commercial enterprises execute strategic geographic planning. A defining characteristic of this landscape is the rapid integration of spatial data science into boardroom-level asset management and facility investment decisions.
  • Decision-makers increasingly rely on contextual geographic information to evaluate supply chain vulnerabilities, moving away from fragmented location data toward unified analytics. By implementing satellite based augmentation and advanced telemetry sensors, industrial firms have enhanced predictive maintenance accuracy by 28% compared to traditional calendar-based servicing. This measurable improvement in equipment uptime directly influences capital expenditure budgeting.
  • Furthermore, the shift toward agent-driven engagements allows autonomous AI systems to interpret visual site records and execute localized tasks with minimal human oversight. Executives leverage this automation to standardize compliance monitoring across dispersed facilities.
  • Consequently, the reliance on sophisticated geofencing architectures and real-time positioning technologies ensures that businesses can optimize operational footprints while maintaining strict oversight of physical and digital assets.

What are the Key Data Covered in this Location-Based Services (Lbs) Market Research and Growth Report?

  • What is the expected growth of the Location-Based Services (Lbs) Market between 2026 and 2030?

    • USD 301.20 billion, at a CAGR of 24.5%

  • What segmentation does the market report cover?

    • The report is segmented by Component (Hardware, Software, and Services), Type (Outdoor, and Indoor), Application (Navigation and tracking, GIS and mapping, Geo marketing and advertising, Social networking, and Others) and Geography (North America, Europe, APAC, South America, Middle East and Africa)

  • Which regions are analyzed in the report?

    • North America, Europe, APAC, South America and Middle East and Africa

  • What are the key growth drivers and market challenges?

    • Expansion of connected wearable and location-enabled consumer devices, Data privacy and regulatory compliance complexities

  • Who are the major players in the Location-Based Services (Lbs) Market?

    • Apple Inc., CartoDB Inc., CenTrak Inc., Cisco Systems Inc., Esri Inc., Foursquare Labs Inc., Garmin Ltd., Google LLC, HERE Technologies, IBM Corp., Mapbox Inc., Microsoft Corp., Navigine Corp., NextBillion AI, Oracle Corp., Precisely Software Inc, Qualcomm Inc., Quuppa Oy, Telefonaktiebolaget Ericsson, TomTom NV, Trimble Inc. and Zebra Technologies Corp.

Market Research Insights

  • The Location-based Services (LBS) Market is fundamentally transforming how organizations manage physical assets and interpret spatial relationships mapping. By integrating edge location computing, warehouse operators have reduced network latency by 24%, enabling highly responsive ambient intelligence tracking across vast facilities.
  • Furthermore, the deployment of intelligent transportation systems allows municipal authorities to cut traffic congestion wait times by 16% compared to legacy monitoring networks. This shift drives continuous positioning reliability in environments where traditional positioning signals falter. As enterprises increasingly demand precision, companies are heavily investing in decentralized mapping networks to safeguard user privacy.
  • Consequently, businesses effectively convert raw geographic data into actionable operational workflows while maintaining strict regulatory compliance.

We can help! Our analysts can customize this location-based services (lbs) market research report to meet your requirements.

Get in touch

1. Executive Summary

1.1 Market overview

Executive Summary - Chart on Market Overview
Executive Summary - Data Table on Market Overview
Executive Summary - Chart on Global Market Characteristics
Executive Summary - Chart on Market by Geography
Executive Summary - Chart on Market Segmentation by Component
Executive Summary - Chart on Market Segmentation by Type
Executive Summary - Chart on Market Segmentation by Application
Executive Summary - Chart on Incremental Growth
Executive Summary - Data Table on Incremental Growth
Executive Summary - Chart on Company Market Positioning

2. Technavio Analysis

2.1 Analysis of price sensitivity, lifecycle, customer purchase basket, adoption rates, and purchase criteria

2.2 Criticality of inputs and Factors of differentiation

Chart on Overview on criticality of inputs and factors of differentiation

2.3 Factors of disruption

Chart on Overview on factors of disruption

2.4 Impact of drivers and challenges

Chart on Impact of drivers and challenges in 2025 and 2030

3. Market Landscape

3.1 Market ecosystem

Chart on Parent Market
Data Table on - Parent Market

3.2 Market characteristics

Chart on Market characteristics analysis

3.3 Value chain analysis

Chart on Value chain analysis

4. Market Sizing

4.1 Market definition

Data Table on Offerings of companies included in the market definition

4.2 Market segment analysis

Market segments

4.3 Market size 2025

4.4 Market outlook: Forecast for 2025-2030

Chart on Global - Market size and forecast 2025-2030 ($ million)
Data Table on Global - Market size and forecast 2025-2030 ($ million)
Chart on Global Market: Year-over-year growth 2025-2030 (%)
Data Table on Global Market: Year-over-year growth 2025-2030 (%)

5. Historic Market Size

5.1 Global Location-Based Services (LBS) Market 2020 - 2024

Historic Market Size - Data Table on Global Location-Based Services (LBS) Market 2020 - 2024 ($ million)

5.2 Component segment analysis 2020 - 2024

Historic Market Size - Component Segment 2020 - 2024 ($ million)

5.3 Type segment analysis 2020 - 2024

Historic Market Size - Type Segment 2020 - 2024 ($ million)

5.4 Application segment analysis 2020 - 2024

Historic Market Size - Application Segment 2020 - 2024 ($ million)

5.5 Geography segment analysis 2020 - 2024

Historic Market Size - Geography Segment 2020 - 2024 ($ million)

5.6 Country segment analysis 2020 - 2024

Historic Market Size - Country Segment 2020 - 2024 ($ million)

6. Qualitative Analysis

6.1 Impact of AI on global location-based services (LBS) market

6.2 Impact of geopolitical conflicts on global location-based services (LBS) market

7. Five Forces Analysis

7.1 Five forces summary

Five forces analysis - Comparison between 2025 and 2030

7.2 Bargaining power of buyers

Bargaining power of buyers - Impact of key factors 2025 and 2030

7.3 Bargaining power of suppliers

Bargaining power of suppliers - Impact of key factors in 2025 and 2030

7.4 Threat of new entrants

Threat of new entrants - Impact of key factors in 2025 and 2030

7.5 Threat of substitutes

Threat of substitutes - Impact of key factors in 2025 and 2030

7.6 Threat of rivalry

Threat of rivalry - Impact of key factors in 2025 and 2030

7.7 Market condition

Chart on Market condition - Five forces 2025 and 2030

8. Market Segmentation by Component

8.1 Market segments

Chart on Component - Market share 2025-2030 (%)
Data Table on Component - Market share 2025-2030 (%)

8.2 Comparison by Component

Chart on Comparison by Component
Data Table on Comparison by Component

8.3 Hardware - Market size and forecast 2025-2030

Chart on Hardware - Market size and forecast 2025-2030 ($ million)
Data Table on Hardware - Market size and forecast 2025-2030 ($ million)
Chart on Hardware - Year-over-year growth 2025-2030 (%)
Data Table on Hardware - Year-over-year growth 2025-2030 (%)

8.4 Software - Market size and forecast 2025-2030

Chart on Software - Market size and forecast 2025-2030 ($ million)
Data Table on Software - Market size and forecast 2025-2030 ($ million)
Chart on Software - Year-over-year growth 2025-2030 (%)
Data Table on Software - Year-over-year growth 2025-2030 (%)

8.5 Services - Market size and forecast 2025-2030

Chart on Services - Market size and forecast 2025-2030 ($ million)
Data Table on Services - Market size and forecast 2025-2030 ($ million)
Chart on Services - Year-over-year growth 2025-2030 (%)
Data Table on Services - Year-over-year growth 2025-2030 (%)

8.6 Market opportunity by Component

Market opportunity by Component ($ million)
Data Table on Market opportunity by Component ($ million)

9. Market Segmentation by Type

9.1 Market segments

Chart on Type - Market share 2025-2030 (%)
Data Table on Type - Market share 2025-2030 (%)

9.2 Comparison by Type

Chart on Comparison by Type
Data Table on Comparison by Type

9.3 Outdoor - Market size and forecast 2025-2030

Chart on Outdoor - Market size and forecast 2025-2030 ($ million)
Data Table on Outdoor - Market size and forecast 2025-2030 ($ million)
Chart on Outdoor - Year-over-year growth 2025-2030 (%)
Data Table on Outdoor - Year-over-year growth 2025-2030 (%)

9.4 Indoor - Market size and forecast 2025-2030

Chart on Indoor - Market size and forecast 2025-2030 ($ million)
Data Table on Indoor - Market size and forecast 2025-2030 ($ million)
Chart on Indoor - Year-over-year growth 2025-2030 (%)
Data Table on Indoor - Year-over-year growth 2025-2030 (%)

9.5 Market opportunity by Type

Market opportunity by Type ($ million)
Data Table on Market opportunity by Type ($ million)

10. Market Segmentation by Application

10.1 Market segments

Chart on Application - Market share 2025-2030 (%)
Data Table on Application - Market share 2025-2030 (%)

10.2 Comparison by Application

Chart on Comparison by Application
Data Table on Comparison by Application

10.3 Navigation and tracking - Market size and forecast 2025-2030

Chart on Navigation and tracking - Market size and forecast 2025-2030 ($ million)
Data Table on Navigation and tracking - Market size and forecast 2025-2030 ($ million)
Chart on Navigation and tracking - Year-over-year growth 2025-2030 (%)
Data Table on Navigation and tracking - Year-over-year growth 2025-2030 (%)

10.4 GIS and mapping - Market size and forecast 2025-2030

Chart on GIS and mapping - Market size and forecast 2025-2030 ($ million)
Data Table on GIS and mapping - Market size and forecast 2025-2030 ($ million)
Chart on GIS and mapping - Year-over-year growth 2025-2030 (%)
Data Table on GIS and mapping - Year-over-year growth 2025-2030 (%)

10.5 Geo marketing and advertising - Market size and forecast 2025-2030

Chart on Geo marketing and advertising - Market size and forecast 2025-2030 ($ million)
Data Table on Geo marketing and advertising - Market size and forecast 2025-2030 ($ million)
Chart on Geo marketing and advertising - Year-over-year growth 2025-2030 (%)
Data Table on Geo marketing and advertising - Year-over-year growth 2025-2030 (%)

10.6 Social networking - Market size and forecast 2025-2030

Chart on Social networking - Market size and forecast 2025-2030 ($ million)
Data Table on Social networking - Market size and forecast 2025-2030 ($ million)
Chart on Social networking - Year-over-year growth 2025-2030 (%)
Data Table on Social networking - Year-over-year growth 2025-2030 (%)

10.7 Others - Market size and forecast 2025-2030

Chart on Others - Market size and forecast 2025-2030 ($ million)
Data Table on Others - Market size and forecast 2025-2030 ($ million)
Chart on Others - Year-over-year growth 2025-2030 (%)
Data Table on Others - Year-over-year growth 2025-2030 (%)

10.8 Market opportunity by Application

Market opportunity by Application ($ million)
Data Table on Market opportunity by Application ($ million)

11. Customer Landscape

11.1 Customer landscape overview

Analysis of price sensitivity, lifecycle, customer purchase basket, adoption rates, and purchase criteria

12. Geographic Landscape

12.1 Geographic segmentation

Chart on Market share by geography 2025-2030 (%)
Data Table on Market share by geography 2025-2030 (%)

12.2 Geographic comparison

Chart on Geographic comparison
Data Table on Geographic comparison

12.3 North America - Market size and forecast 2025-2030

Chart on North America - Market size and forecast 2025-2030 ($ million)
Data Table on North America - Market size and forecast 2025-2030 ($ million)
Chart on North America - Year-over-year growth 2025-2030 (%)
Data Table on North America - Year-over-year growth 2025-2030 (%)
Chart on Regional Comparison - North America
Data Table on Regional Comparison - North America

12.3.1 US - Market size and forecast 2025-2030

Chart on US - Market size and forecast 2025-2030 ($ million)
Data Table on US - Market size and forecast 2025-2030 ($ million)
Chart on US - Year-over-year growth 2025-2030 (%)
Data Table on US - Year-over-year growth 2025-2030 (%)

12.3.2 Canada - Market size and forecast 2025-2030

Chart on Canada - Market size and forecast 2025-2030 ($ million)
Data Table on Canada - Market size and forecast 2025-2030 ($ million)
Chart on Canada - Year-over-year growth 2025-2030 (%)
Data Table on Canada - Year-over-year growth 2025-2030 (%)

12.3.3 Mexico - Market size and forecast 2025-2030

Chart on Mexico - Market size and forecast 2025-2030 ($ million)
Data Table on Mexico - Market size and forecast 2025-2030 ($ million)
Chart on Mexico - Year-over-year growth 2025-2030 (%)
Data Table on Mexico - Year-over-year growth 2025-2030 (%)

12.4 Europe - Market size and forecast 2025-2030

Chart on Europe - Market size and forecast 2025-2030 ($ million)
Data Table on Europe - Market size and forecast 2025-2030 ($ million)
Chart on Europe - Year-over-year growth 2025-2030 (%)
Data Table on Europe - Year-over-year growth 2025-2030 (%)
Chart on Regional Comparison - Europe
Data Table on Regional Comparison - Europe

12.4.1 Germany - Market size and forecast 2025-2030

Chart on Germany - Market size and forecast 2025-2030 ($ million)
Data Table on Germany - Market size and forecast 2025-2030 ($ million)
Chart on Germany - Year-over-year growth 2025-2030 (%)
Data Table on Germany - Year-over-year growth 2025-2030 (%)

12.4.2 UK - Market size and forecast 2025-2030

Chart on UK - Market size and forecast 2025-2030 ($ million)
Data Table on UK - Market size and forecast 2025-2030 ($ million)
Chart on UK - Year-over-year growth 2025-2030 (%)
Data Table on UK - Year-over-year growth 2025-2030 (%)

12.4.3 France - Market size and forecast 2025-2030

Chart on France - Market size and forecast 2025-2030 ($ million)
Data Table on France - Market size and forecast 2025-2030 ($ million)
Chart on France - Year-over-year growth 2025-2030 (%)
Data Table on France - Year-over-year growth 2025-2030 (%)

12.4.4 Italy - Market size and forecast 2025-2030

Chart on Italy - Market size and forecast 2025-2030 ($ million)
Data Table on Italy - Market size and forecast 2025-2030 ($ million)
Chart on Italy - Year-over-year growth 2025-2030 (%)
Data Table on Italy - Year-over-year growth 2025-2030 (%)

12.4.5 Spain - Market size and forecast 2025-2030

Chart on Spain - Market size and forecast 2025-2030 ($ million)
Data Table on Spain - Market size and forecast 2025-2030 ($ million)
Chart on Spain - Year-over-year growth 2025-2030 (%)
Data Table on Spain - Year-over-year growth 2025-2030 (%)

12.4.6 The Netherlands - Market size and forecast 2025-2030

Chart on The Netherlands - Market size and forecast 2025-2030 ($ million)
Data Table on The Netherlands - Market size and forecast 2025-2030 ($ million)
Chart on The Netherlands - Year-over-year growth 2025-2030 (%)
Data Table on The Netherlands - Year-over-year growth 2025-2030 (%)

12.5 APAC - Market size and forecast 2025-2030

Chart on APAC - Market size and forecast 2025-2030 ($ million)
Data Table on APAC - Market size and forecast 2025-2030 ($ million)
Chart on APAC - Year-over-year growth 2025-2030 (%)
Data Table on APAC - Year-over-year growth 2025-2030 (%)
Chart on Regional Comparison - APAC
Data Table on Regional Comparison - APAC

12.5.1 China - Market size and forecast 2025-2030

Chart on China - Market size and forecast 2025-2030 ($ million)
Data Table on China - Market size and forecast 2025-2030 ($ million)
Chart on China - Year-over-year growth 2025-2030 (%)
Data Table on China - Year-over-year growth 2025-2030 (%)

12.5.2 Japan - Market size and forecast 2025-2030

Chart on Japan - Market size and forecast 2025-2030 ($ million)
Data Table on Japan - Market size and forecast 2025-2030 ($ million)
Chart on Japan - Year-over-year growth 2025-2030 (%)
Data Table on Japan - Year-over-year growth 2025-2030 (%)

12.5.3 India - Market size and forecast 2025-2030

Chart on India - Market size and forecast 2025-2030 ($ million)
Data Table on India - Market size and forecast 2025-2030 ($ million)
Chart on India - Year-over-year growth 2025-2030 (%)
Data Table on India - Year-over-year growth 2025-2030 (%)

12.5.4 South Korea - Market size and forecast 2025-2030

Chart on South Korea - Market size and forecast 2025-2030 ($ million)
Data Table on South Korea - Market size and forecast 2025-2030 ($ million)
Chart on South Korea - Year-over-year growth 2025-2030 (%)
Data Table on South Korea - Year-over-year growth 2025-2030 (%)

12.5.5 Australia - Market size and forecast 2025-2030

Chart on Australia - Market size and forecast 2025-2030 ($ million)
Data Table on Australia - Market size and forecast 2025-2030 ($ million)
Chart on Australia - Year-over-year growth 2025-2030 (%)
Data Table on Australia - Year-over-year growth 2025-2030 (%)

12.5.6 Indonesia - Market size and forecast 2025-2030

Chart on Indonesia - Market size and forecast 2025-2030 ($ million)
Data Table on Indonesia - Market size and forecast 2025-2030 ($ million)
Chart on Indonesia - Year-over-year growth 2025-2030 (%)
Data Table on Indonesia - Year-over-year growth 2025-2030 (%)

12.6 South America - Market size and forecast 2025-2030

Chart on South America - Market size and forecast 2025-2030 ($ million)
Data Table on South America - Market size and forecast 2025-2030 ($ million)
Chart on South America - Year-over-year growth 2025-2030 (%)
Data Table on South America - Year-over-year growth 2025-2030 (%)
Chart on Regional Comparison - South America
Data Table on Regional Comparison - South America

12.6.1 Brazil - Market size and forecast 2025-2030

Chart on Brazil - Market size and forecast 2025-2030 ($ million)
Data Table on Brazil - Market size and forecast 2025-2030 ($ million)
Chart on Brazil - Year-over-year growth 2025-2030 (%)
Data Table on Brazil - Year-over-year growth 2025-2030 (%)

12.6.2 Argentina - Market size and forecast 2025-2030

Chart on Argentina - Market size and forecast 2025-2030 ($ million)
Data Table on Argentina - Market size and forecast 2025-2030 ($ million)
Chart on Argentina - Year-over-year growth 2025-2030 (%)
Data Table on Argentina - Year-over-year growth 2025-2030 (%)

12.6.3 Chile - Market size and forecast 2025-2030

Chart on Chile - Market size and forecast 2025-2030 ($ million)
Data Table on Chile - Market size and forecast 2025-2030 ($ million)
Chart on Chile - Year-over-year growth 2025-2030 (%)
Data Table on Chile - Year-over-year growth 2025-2030 (%)

12.7 Middle East and Africa - Market size and forecast 2025-2030

Chart on Middle East and Africa - Market size and forecast 2025-2030 ($ million)
Data Table on Middle East and Africa - Market size and forecast 2025-2030 ($ million)
Chart on Middle East and Africa - Year-over-year growth 2025-2030 (%)
Data Table on Middle East and Africa - Year-over-year growth 2025-2030 (%)
Chart on Regional Comparison - Middle East and Africa
Data Table on Regional Comparison - Middle East and Africa

12.7.1 Saudi Arabia - Market size and forecast 2025-2030

Chart on Saudi Arabia - Market size and forecast 2025-2030 ($ million)
Data Table on Saudi Arabia - Market size and forecast 2025-2030 ($ million)
Chart on Saudi Arabia - Year-over-year growth 2025-2030 (%)
Data Table on Saudi Arabia - Year-over-year growth 2025-2030 (%)

12.7.2 UAE - Market size and forecast 2025-2030

Chart on UAE - Market size and forecast 2025-2030 ($ million)
Data Table on UAE - Market size and forecast 2025-2030 ($ million)
Chart on UAE - Year-over-year growth 2025-2030 (%)
Data Table on UAE - Year-over-year growth 2025-2030 (%)

12.7.3 Israel - Market size and forecast 2025-2030

Chart on Israel - Market size and forecast 2025-2030 ($ million)
Data Table on Israel - Market size and forecast 2025-2030 ($ million)
Chart on Israel - Year-over-year growth 2025-2030 (%)
Data Table on Israel - Year-over-year growth 2025-2030 (%)

12.7.4 Turkey - Market size and forecast 2025-2030

Chart on Turkey - Market size and forecast 2025-2030 ($ million)
Data Table on Turkey - Market size and forecast 2025-2030 ($ million)
Chart on Turkey - Year-over-year growth 2025-2030 (%)
Data Table on Turkey - Year-over-year growth 2025-2030 (%)

12.7.5 South Africa - Market size and forecast 2025-2030

Chart on South Africa - Market size and forecast 2025-2030 ($ million)
Data Table on South Africa - Market size and forecast 2025-2030 ($ million)
Chart on South Africa - Year-over-year growth 2025-2030 (%)
Data Table on South Africa - Year-over-year growth 2025-2030 (%)

12.8 Market opportunity by geography

Market opportunity by geography ($ million)
Data Tables on Market opportunity by geography ($ million)

13. Drivers, Challenges, and Opportunity

13.1 Market drivers

Expansion of connected wearable and location-enabled consumer devices
Growing adoption of connected mobility ecosystems
Expanding penetration of smartphones and location-enabled digital applications

13.2 Market challenges

Data privacy and regulatory compliance complexities
Infrastructure disparities and positioning accuracy limitations
High integration costs and technical interoperability barriers

13.3 Impact of drivers and challenges

Impact of drivers and challenges in 2025 and 2030

13.4 Market opportunities

Shift toward spatial intelligence platforms
Ai-native location reasoning integration within location services
Growing convergence of location intelligence with digital twin environments

14. Competitive Landscape

14.1 Overview

14.2

Overview on criticality of inputs and factors of differentiation

14.3 Landscape disruption

Overview on factors of disruption

14.4 Industry risks

Impact of key risks on business

15. Competitive Analysis

15.1 Companies profiled

Companies covered

15.2 Company ranking index

15.3 Market positioning of companies

Matrix on companies position and classification

15.4 Apple Inc.

Apple Inc. - Overview
Apple Inc. - Business segments
Apple Inc. - Key news
Apple Inc. - Key offerings
Apple Inc. - Segment focus
SWOT

15.5 CenTrak Inc.

CenTrak Inc. - Overview
CenTrak Inc. - Product / Service
CenTrak Inc. - Key offerings
SWOT

15.6 Cisco Systems Inc.

Cisco Systems Inc. - Overview
Cisco Systems Inc. - Business segments
Cisco Systems Inc. - Key news
Cisco Systems Inc. - Key offerings
Cisco Systems Inc. - Segment focus
SWOT

15.7 Esri Inc.

Esri Inc. - Overview
Esri Inc. - Product / Service
Esri Inc. - Key offerings
SWOT

15.8 Foursquare Labs Inc.

Foursquare Labs Inc. - Overview
Foursquare Labs Inc. - Product / Service
Foursquare Labs Inc. - Key offerings
SWOT

15.9 Garmin Ltd.

Garmin Ltd. - Overview
Garmin Ltd. - Business segments
Garmin Ltd. - Key news
Garmin Ltd. - Key offerings
Garmin Ltd. - Segment focus
SWOT

15.10 Google LLC

Google LLC - Overview
Google LLC - Product / Service
Google LLC - Key news
Google LLC - Key offerings
SWOT

15.11 IBM Corp.

IBM Corp. - Overview
IBM Corp. - Business segments
IBM Corp. - Key news
IBM Corp. - Key offerings
IBM Corp. - Segment focus
SWOT

15.12 Microsoft Corp.

Microsoft Corp. - Overview
Microsoft Corp. - Business segments
Microsoft Corp. - Key news
Microsoft Corp. - Key offerings
Microsoft Corp. - Segment focus
SWOT

15.13 Oracle Corp.

Oracle Corp. - Overview
Oracle Corp. - Business segments
Oracle Corp. - Key news
Oracle Corp. - Key offerings
Oracle Corp. - Segment focus
SWOT

15.14 Qualcomm Inc.

Qualcomm Inc. - Overview
Qualcomm Inc. - Business segments
Qualcomm Inc. - Key news
Qualcomm Inc. - Key offerings
Qualcomm Inc. - Segment focus
SWOT

15.15 Telefonaktiebolaget Ericsson

Telefonaktiebolaget Ericsson - Overview
Telefonaktiebolaget Ericsson - Business segments
Telefonaktiebolaget Ericsson - Key news
Telefonaktiebolaget Ericsson - Key offerings
Telefonaktiebolaget Ericsson - Segment focus
SWOT

15.16 TomTom NV

TomTom NV - Overview
TomTom NV - Business segments
TomTom NV - Key offerings
TomTom NV - Segment focus
SWOT

15.17 Trimble Inc.

Trimble Inc. - Overview
Trimble Inc. - Business segments
Trimble Inc. - Key news
Trimble Inc. - Key offerings
Trimble Inc. - Segment focus
SWOT

15.18 Zebra Technologies Corp.

Zebra Technologies Corp. - Overview
Zebra Technologies Corp. - Business segments
Zebra Technologies Corp. - Key news
Zebra Technologies Corp. - Key offerings
Zebra Technologies Corp. - Segment focus
SWOT

16. Appendix

16.1 Scope of the report

Market definition
Objectives
Notes and caveats

16.2 Inclusions and exclusions checklist

Inclusions checklist
Exclusions checklist

16.3 Currency conversion rates for US$

16.4 Research methodology

16.5 Data procurement

Information sources

16.6 Data validation

16.7 Validation techniques employed for market sizing

16.8 Data synthesis

16.9 360 degree market analysis

16.10 List of abbreviations

Research Methodology

Technavio presents a detailed picture of the market by way of study, synthesis, and summation of data from multiple sources. The analysts have presented the various facets of the market with a particular focus on identifying the key industry influencers. The data thus presented is comprehensive, reliable, and the result of extensive research, both primary and secondary.

INFORMATION SOURCES

Primary sources

  • Manufacturers and suppliers
  • Channel partners
  • Industry experts
  • Strategic decision makers

Secondary sources

  • Industry journals and periodicals
  • Government data
  • Financial reports of key industry players
  • Historical data
  • Press releases

DATA ANALYSIS

Data Synthesis

  • Collation of data
  • Estimation of key figures
  • Analysis of derived insights

Data Validation

  • Triangulation with data models
  • Reference against proprietary databases
  • Corroboration with industry experts

REPORT WRITING

Qualitative

  • Market drivers
  • Market challenges
  • Market trends
  • Five forces analysis

Quantitative

  • Market size and forecast
  • Market segmentation
  • Geographical insights
  • Competitive landscape

Interested in this report?

Get your sample now to see our research methodology and insights!

Download Now

Frequently Asked Questions

Location-Based Services (Lbs) market growth will increase by USD 301202.6 million during 2026-2030.

The Location-Based Services (Lbs) market is expected to grow at a CAGR of 24.5% during 2026-2030.

Location-Based Services (Lbs) market is segmented by Component (Hardware, Software, Services) Type (Outdoor, Indoor) Application (Navigation and tracking, GIS and mapping, Geo marketing and advertising, Social networking, Others)

Apple Inc., CartoDB Inc., CenTrak Inc., Cisco Systems Inc., Esri Inc., Foursquare Labs Inc., Garmin Ltd., Google LLC, HERE Technologies, IBM Corp., Mapbox Inc., Microsoft Corp., Navigine Corp., NextBillion AI, Oracle Corp., Precisely Software Inc, Qualcomm Inc., Quuppa Oy, Telefonaktiebolaget Ericsson, TomTom NV, Trimble Inc., Zebra Technologies Corp. are a few of the key vendors in the Location-Based Services (Lbs) market.

North America will register the highest growth rate of 43% among the other regions. Therefore, the Location-Based Services (Lbs) market in North America is expected to garner significant business opportunities for the vendors during the forecast period.

US, Canada, Mexico, Germany, UK, France, Italy, Spain, The Netherlands, China, Japan, India, South Korea, Australia, Indonesia, Brazil, Argentina, Chile, Saudi Arabia, UAE, Israel, Turkey, South Africa

  • Expansion of connected wearable and location-enabled consumer devices is the driving factor this market.

The Location-Based Services (Lbs) market vendors should focus on grabbing business opportunities from the Component segment as it accounted for the largest market share in the base year.
RIA - Research AI Assistant
Ask RIA
