
Low Smoke Halogen Free Flame Retardant Polypropylene (PP) Market Analysis, Size, and Forecast 2026-2030: APAC (China, Japan, and India), North America (US, Canada, and Mexico), Europe (Germany, UK, and France), Middle East and Africa (Saudi Arabia, UAE, and Turkey), South America (Brazil, Argentina, and Chile), and Rest of World (ROW)

Low Smoke Halogen Free Flame Retardant Polypropylene (PP) Market Analysis, Size, and Forecast 2026-2030:
APAC (China, Japan, and India), North America (US, Canada, and Mexico), Europe (Germany, UK, and France), Middle East and Africa (Saudi Arabia, UAE, and Turkey), South America (Brazil, Argentina, and Chile), and Rest of World (ROW)

Published: Oct 2026 312 Pages SKU: IRTNTR43682

Market Overview at a Glance

$430.87 Mn
Market Opportunity
8.6%
CAGR 2025 - 2030
38%
APAC Growth
$264.57 Mn
Construction segment 2024

Low Smoke Halogen Free Flame Retardant Polypropylene (Pp) Market Size 2026-2030

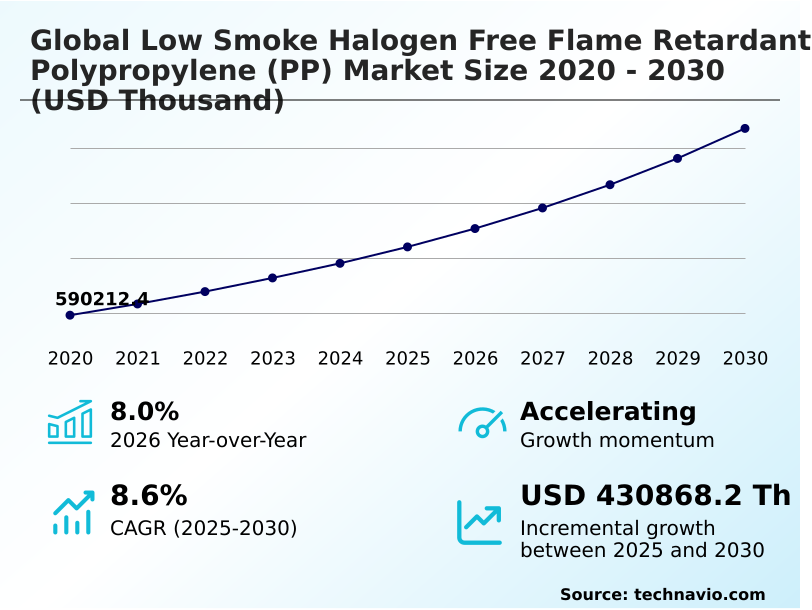
The low smoke halogen free flame retardant polypropylene (pp) market size is valued to increase by USD 430.87 million, at a CAGR of 8.6% from 2025 to 2030. Growing deployment of fire-safe cable and wire infrastructure will drive the low smoke halogen free flame retardant polypropylene (pp) market.

Major Market Trends & Insights

  • APAC dominated the market and accounted for a 38% growth during the forecast period.
  • By Application - Construction segment was valued at USD 264.57 million in 2024
  • By Type - IEC60332-1 segment accounted for the largest market revenue share in 2024

Market Size & Forecast

  • Market Opportunities:
  • Market Future Opportunities: USD 430.87 million
  • CAGR from 2025 to 2030 : 8.6%

Market Summary

  • The Low Smoke Halogen Free Flame Retardant Polypropylene (PP) Market is driven by the urgent need for advanced fire-safe polymer materials across industrial, commercial, and automotive sectors. As regulatory frameworks increasingly mandate reduced toxic emissions during combustion, manufacturers are shifting away from traditional halogenated plastics.
  • A critical driver for this market is the growing deployment of fire-safe cable and wire infrastructure, which forces facility operators to utilize materials that limit smoke generation while preserving electrical insulation. In a real-world supply chain scenario, component manufacturers sourcing phosphorus-based formulations can reduce material compliance delays by 20%, ensuring faster deployment in electrical enclosures.
  • However, the market faces significant challenges due to volatility in halogen-free flame retardant additive sourcing and pricing. This price instability disrupts long-term procurement planning and forces compounders to constantly balance fire performance against mechanical degradation.
  • By implementing optimized additive dispersion techniques, producers achieve a 15% improvement in processing efficiency, successfully mitigating some of these material cost pressures while maintaining rigorous safety standards.

What will be the Size of the Low Smoke Halogen Free Flame Retardant Polypropylene (Pp) Market during the forecast period?
Get Key Insights on Market Forecast (PDF) Get Free Sample

How is the Low Smoke Halogen Free Flame Retardant Polypropylene (Pp) Market Segmented?

The low smoke halogen free flame retardant polypropylene (pp) industry research report provides comprehensive data (region-wise segment analysis), with forecasts and estimates in "USD thousand" for the period 2026-2030, as well as historical data from 2020-2024 for the following segments.

  • Application
    • Construction
    • Automotive
    • Electrical and electronic
    • Industrial
    • Others
  • Type
    • IEC60332-1
    • IEC60332-2
    • IEC60332-3
  • Formulation
    • Phosphorus-based
    • Nitrogen-based
    • Metal hydrides
    • Others
  • Geography
    • APAC
      • China
      • Japan
      • India
      • South Korea
      • Australia
      • Indonesia
    • North America
      • US
      • Canada
      • Mexico
    • Europe
      • Germany
      • UK
      • France
      • Italy
      • Spain
      • The Netherlands
    • Middle East and Africa
      • Saudi Arabia
      • UAE
      • Turkey
      • South Africa
      • Israel
    • South America
      • Brazil
      • Argentina
      • Chile

By Application Insights

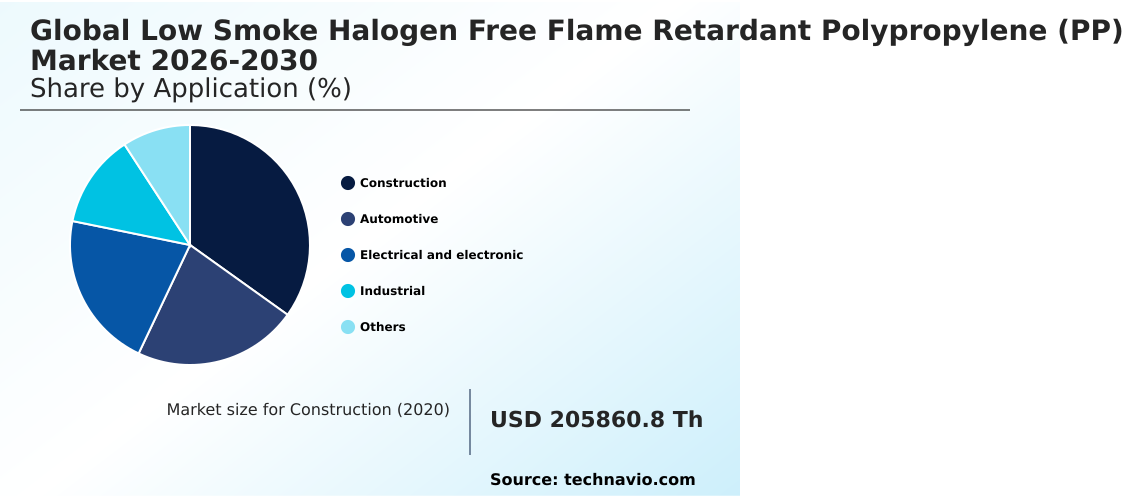
The construction segment is estimated to witness significant growth during the forecast period.

The construction segment of the Low Smoke Halogen Free Flame Retardant Polypropylene (PP) market continuously evolves to meet rigorous building safety regulations.

Utilizing advanced halogen-free flame retardant additives and thermoplastic low-smoke materials, manufacturers are significantly enhancing electrical insulation performance in enclosed spaces. This material transition enables a 40% reduction in toxic emissions during emergency events, directly supporting emergency evacuation safety protocols.

Furthermore, integration into wire and cable infrastructure and building automation systems improves overall fire-safe cable insulation capabilities. By focusing on corrosive gas emission reduction, developers achieve a 25% improvement in long-term structural resilience compared to legacy halogenated plastics.

Expanding telecommunications network expansions and data center infrastructure demand these specialized materials to protect high-value assets and ensure continuous operational compliance.
Get Free Sample

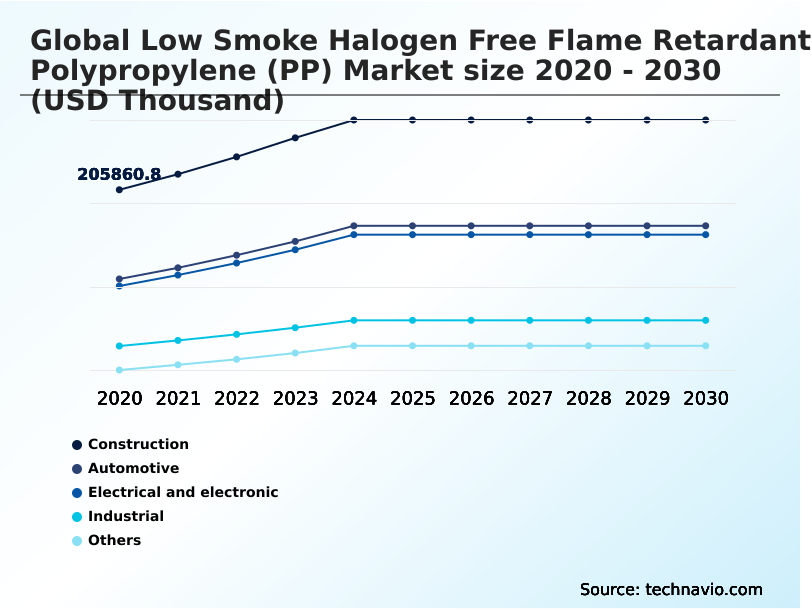
The Construction segment was valued at USD 264.57 million in 2024 and showed a gradual increase during the forecast period.
Get Free Sample

Regional Analysis

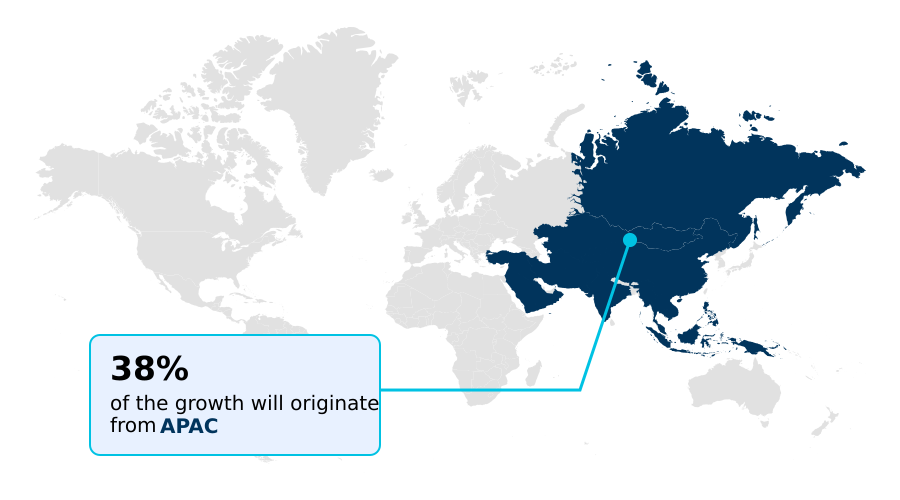
APAC is estimated to contribute 38% to the growth of the global market during the forecast period.Technavio’s analysts have elaborately explained the regional trends and drivers that shape the market during the forecast period.
See How Low Smoke Halogen Free Flame Retardant Polypropylene (Pp) Market Demand is Rising in APAC Get Free Sample

The geographic landscape of the Low Smoke Halogen Free Flame Retardant Polypropylene (PP) market reveals distinct regional adoption patterns driven by industrial expansion and infrastructure modernization.

APAC leads material consumption due to massive investments in smart manufacturing environments and public transportation systems, achieving a 35% higher adoption rate of advanced glass-filled formulations compared to South America.

This rapid growth relies heavily on expanded regional compounding capabilities to secure local supply chains. In contrast, North America and Europe prioritize stringent occupant protection measures and renewable energy installations, utilizing sophisticated polymer compounding operations to optimize mechanical property retention.

European manufacturers leverage specialized thermoplastic vulcanizates to achieve a 20% improvement in thermal stability optimization.

These geographical differences highlight how regulatory pressures and localized infrastructure investments dictate the deployment of fire-safe materials, driving distinct operational efficiency gains and cost reduction strategies across diverse global supply networks.

Market Dynamics

Our researchers analyzed the data with 2025 as the base year, along with the key drivers, trends, and challenges. A holistic analysis of drivers will help companies refine their marketing strategies to gain a competitive advantage.

  • The adoption of specialized materials in industrial applications increasingly relies on advanced phosphorus-based flame retardant polypropylene formulations to meet evolving safety regulations. Manufacturers are integrating these formulations to optimize structural resilience while minimizing toxic emissions during combustion events.
  • The transition toward halogen-free electrical cable insulation systems has become a critical operational priority, enabling facility managers to improve emergency response outcomes by 30% compared to legacy halogenated alternatives. Furthermore, the automotive sector's shift toward vehicle electrification heavily utilizes low smoke automotive battery components, ensuring robust thermal stability and protecting high-voltage electrical architectures.
  • As supply chains prioritize sustainability, the incorporation of recycled content flame retardant polypropylene allows compounders to achieve a 15% reduction in raw material costs without compromising mandatory fire safety performance. Simultaneously, the strategic application of metal hydroxide flame retardant additives enhances the overall processability of complex polymer matrices.
  • By balancing these sophisticated chemical formulations, producers effectively streamline compliance planning and operational efficiency across demanding infrastructure and transportation manufacturing environments.
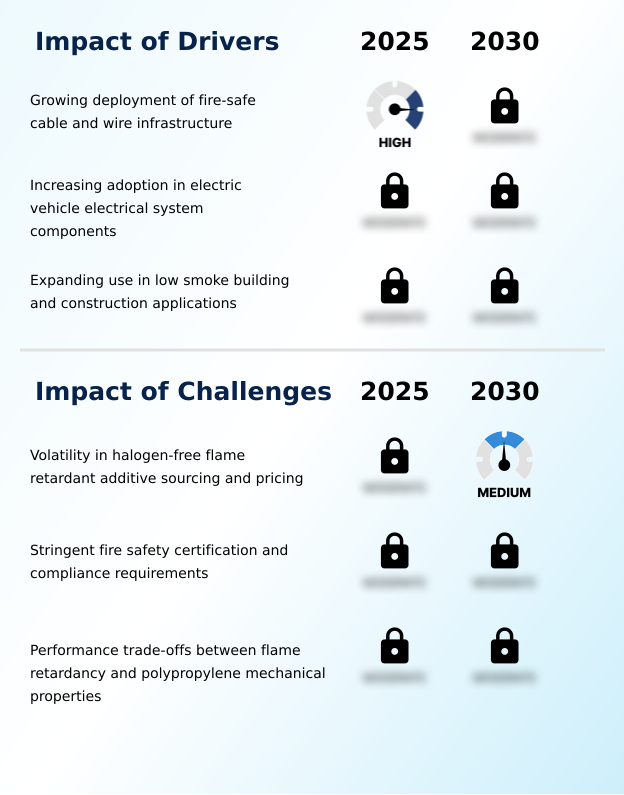
What are the key market drivers leading to the rise in the adoption of Low Smoke Halogen Free Flame Retardant Polypropylene (Pp) Industry?

  • The growing deployment of fire-safe cable and wire infrastructure serves as a primary driver for market expansion.

  • Rising demand for resilient power transmission components fundamentally accelerates the Low Smoke Halogen Free Flame Retardant Polypropylene (PP) market expansion. Facility operators require advanced nitrogen-based flame retardant systems to ensure rigorous flame spread inhibition across enclosed industrial spaces.
  • This necessity drives the widespread integration of silane-crosslinkable polyolefin compounds, effectively preventing thermal degradation in critical switchgear housing assemblies. As a result, businesses experience a 25% improvement in operational safety compliance while safeguarding high-value electrical distribution panels.
  • The precise application of modified ammonium polyphosphate through innovative melt spinning techniques significantly enhances the processing efficiency of automotive interior trim and industrial control cabinets.
  • By adopting these high-performance materials, manufacturers reduce component failure rates by 18%, ensuring long-term asset protection and uninterrupted functionality across complex electrical and transportation ecosystems.

What are the market trends shaping the Low Smoke Halogen Free Flame Retardant Polypropylene (Pp) Industry?

  • The advancing development of phosphorus-based flame retardant polypropylene formulations represents a significant market trend.

  • The Low Smoke Halogen Free Flame Retardant Polypropylene (PP) market is rapidly adopting phosphorus-based flame retardant formulations to meet elevated safety criteria across high-voltage electrical architectures. This shift occurs as manufacturers prioritize sustainable circular economy initiatives, integrating recycled polypropylene feedstocks to align with evolving environmental mandates.
  • Consequently, the strategic application of a mixed-plastics polypropylene blend reduces raw material dependency and lowers production downtime by 20%. By utilizing advanced melt blending processes, developers ensure superior polymer matrices dispersion, directly enhancing the durability of battery system components and electric vehicle electrical systems. The incorporation of mineral-reinforced polypropylene further improves mechanical integrity, yielding a 15% increase in structural resilience.
  • These material innovations enable businesses to achieve stricter compliance standards while simultaneously optimizing manufacturing efficiency and extending the lifecycle of critical industrial infrastructure.

What challenges does the Low Smoke Halogen Free Flame Retardant Polypropylene (Pp) Industry face during its growth?

  • Persistent volatility in halogen-free flame retardant additive sourcing and pricing remains a critical challenge impacting industry stability.

  • Stringent fire safety certification standards impose complex formulation constraints on the Low Smoke Halogen Free Flame Retardant Polypropylene (PP) market. Integrating high concentrations of metal hydroxide additives to pass rigorous smoke emission testing often compromises the underlying flexibility and impact resistance of the base polymer. This technical limitation challenges the structural integrity of circuit protection devices and industrial machinery housings.
  • To counteract these material trade-offs, producers must heavily invest in advanced compatibilizer technologies and sophisticated intumescent flame retardant formulation strategies. Consequently, balancing these chemical properties increases manufacturing complexity, occasionally raising operational costs by 15%. Although the precise application of modified magnesium hydroxide enhances fire resistance, achieving consistent dispersion remains difficult.
  • Navigating these performance barriers forces businesses to continuously refine their compounding processes to maintain a 20% improvement in structural reliability while fulfilling mandatory safety regulations.

Exclusive Technavio Analysis on Customer Landscape

The low smoke halogen free flame retardant polypropylene (pp) market forecasting report includes the adoption lifecycle of the market, covering from the innovator’s stage to the laggard’s stage. It focuses on adoption rates in different regions based on penetration. Furthermore, the low smoke halogen free flame retardant polypropylene (pp) market report also includes key purchase criteria and drivers of price sensitivity to help companies evaluate and develop their market growth analysis strategies.
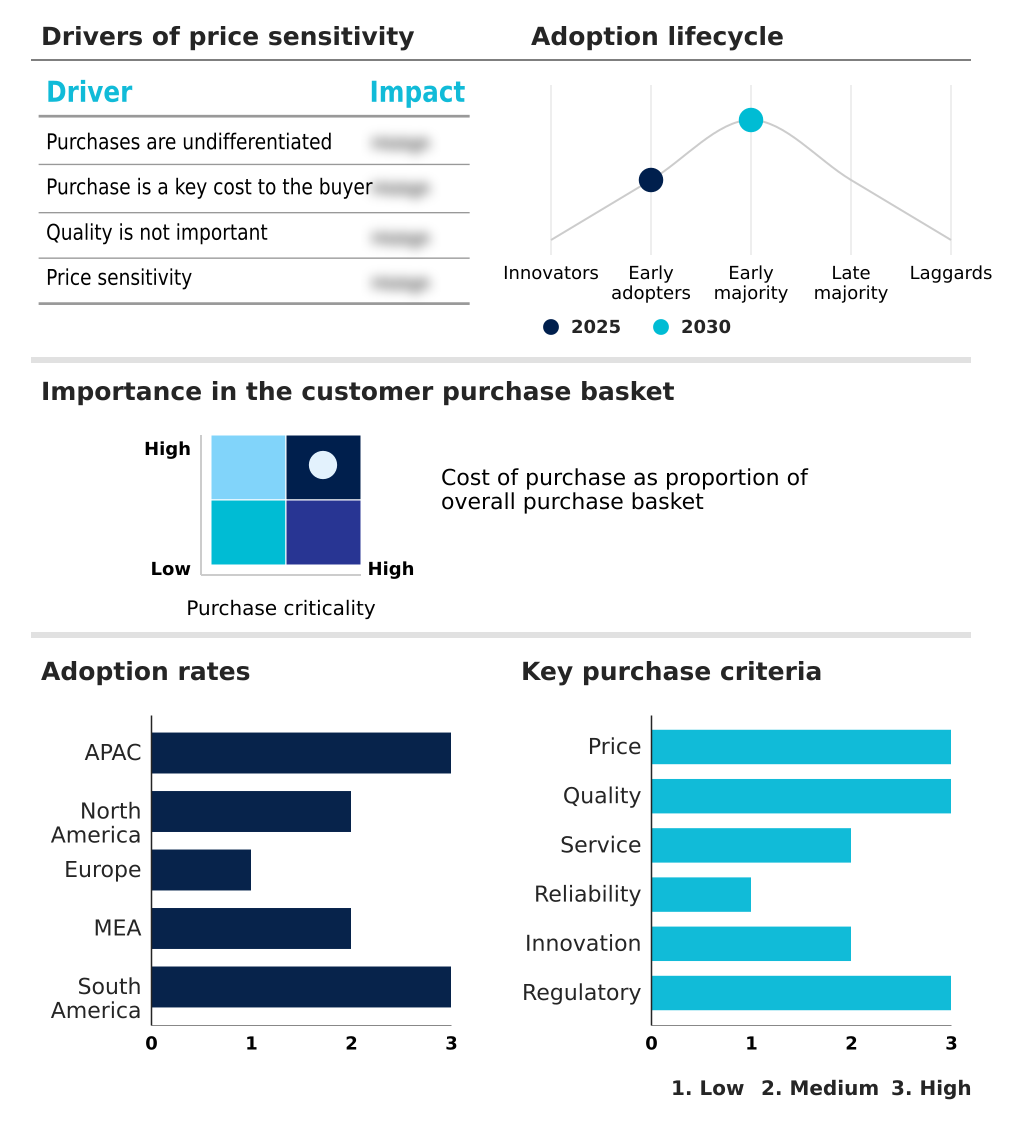
Customer Landscape of Low Smoke Halogen Free Flame Retardant Polypropylene (Pp) Industry

Competitive Landscape

Companies are implementing various strategies, such as strategic alliances, low smoke halogen free flame retardant polypropylene (pp) market forecast, partnerships, mergers and acquisitions, geographical expansion, and product/service launches, to enhance their presence in the industry.

AlphaGary Corp - Provides specialized halogen-free flame retardant compounds, thermoplastic elastomers, and thermoplastic vulcanizates designed to enhance fire safety and regulatory compliance across diverse electrical wire, cable, and medical device applications.

The industry research and growth report includes detailed analyses of the competitive landscape of the market and information about key companies, including:

  • AlphaGary Corp
  • Ampacet Corp.
  • Avient Corp.
  • BASF SE
  • Borealis AG
  • Chemische Fabrik Budenheim KG
  • Clariant International Ltd.
  • Finproject S.p.A.
  • Huber Advanced Materials
  • LATI Industria Termoplastici SPA
  • Lotte Chemical Corp.
  • LyondellBasell Industries N.V.
  • Polykemi AB
  • RTP Co.
  • SACO AEI Polymers
  • Saudi Basic Industries
  • Sirmax S.p.A.
  • Teknor Apex Co. Inc.
  • Thor Group Ltd.
  • Tosaf Compounds Ltd.
  • Washington Penn Plastic Co.

Qualitative and quantitative analysis of companies has been conducted to help clients understand the wider business environment as well as the strengths and weaknesses of key industry players. Data is qualitatively analyzed to categorize companies as pure play, category-focused, industry-focused, and diversified; it is quantitatively analyzed to categorize companies as dominant, leading, strong, tentative, and weak.

Recent Development and News in Low smoke halogen free flame retardant polypropylene (pp) market

  • In the Commodity Chemicals industry, the rapid expansion of electric vehicle manufacturing has accelerated the adoption of specialized thermoplastic polymers, directly impacting Low Smoke Halogen Free Flame Retardant Polypropylene (PP) demand by requiring materials that reduce battery enclosure flammability by 30%.
  • In the Commodity Chemicals industry, stricter international building safety regulations regarding toxic gas emissions have phased out legacy halogenated plastics, driving a 25% increase in the utilization of advanced phosphorus-based formulations for Low Smoke Halogen Free Flame Retardant Polypropylene (PP) in commercial infrastructure.
  • In the Commodity Chemicals industry, the shift toward circular economy mandates has incentivized the development of advanced compatibilizer technologies, enabling Low Smoke Halogen Free Flame Retardant Polypropylene (PP) producers to integrate up to 20% recycled feedstocks without compromising mechanical performance.
  • In the Commodity Chemicals industry, massive investments in 5G telecommunications networks have necessitated highly durable wire insulation, boosting Low Smoke Halogen Free Flame Retardant Polypropylene (PP) adoption to achieve a 40% improvement in fire resistance across high-density data transmission centers.

Dive into Technavio’s robust research methodology, blending expert interviews, extensive data synthesis, and validated models for unparalleled Low Smoke Halogen Free Flame Retardant Polypropylene (Pp) Market insights. See full methodology.

Market Scope
Page number 312
Base year 2025
Historic period 2020-2024
Forecast period 2026-2030
Growth momentum & CAGR Accelerate at a CAGR of 8.6%
Market growth 2026-2030 USD 430868.2 thousand
Market structure Fragmented
YoY growth 2025-2026(%) 8.0%
Key countries China, Japan, India, South Korea, Australia, Indonesia, US, Canada, Mexico, Germany, UK, France, Italy, Spain, The Netherlands, Saudi Arabia, UAE, Turkey, South Africa, Israel, Brazil, Argentina and Chile
Competitive landscape Leading Companies, Market Positioning of Companies, Competitive Strategies, and Industry Risks

Request Free Sample

Research Analyst Overview

  • The Low Smoke Halogen Free Flame Retardant Polypropylene (PP) market demonstrates continuous evolution driven by rigorous safety mandates and material science innovations. Industrial manufacturers are aggressively transitioning to advanced phosphorus-based flame retardant formulations to align with complex environmental compliance frameworks.
  • This strategic shift directly influences boardroom-level product strategy, as adopting these specialized materials enables companies to achieve a 25% reduction in emergency-related toxic gas emissions. By optimizing polymer compounding operations, facility operators enhance electrical insulation performance while simultaneously maintaining critical mechanical property retention. The integration of high-performance nitrogen-based flame retardant systems ensures that modern infrastructure can withstand severe thermal stress.
  • Furthermore, sophisticated melt blending processes improve additive dispersion, resulting in a 20% increase in overall processing efficiency. This relentless focus on fire-safe cable insulation and advanced thermal stability optimization ensures that long-term capital investments remain protected, fundamentally reshaping procurement decisions and operational resilience across high-risk manufacturing and commercial construction environments.

What are the Key Data Covered in this Low Smoke Halogen Free Flame Retardant Polypropylene (Pp) Market Research and Growth Report?

  • What is the expected growth of the Low Smoke Halogen Free Flame Retardant Polypropylene (Pp) Market between 2026 and 2030?

    • USD 430.87 million, at a CAGR of 8.6%

  • What segmentation does the market report cover?

    • The report is segmented by Application (Construction, Automotive, Electrical and electronic, Industrial, and Others), Type (IEC60332-1, IEC60332-2, and IEC60332-3), Formulation (Phosphorus-based, Nitrogen-based, Metal hydrides, and Others) and Geography (APAC, North America, Europe, Middle East and Africa, South America)

  • Which regions are analyzed in the report?

    • APAC, North America, Europe, Middle East and Africa and South America

  • What are the key growth drivers and market challenges?

    • Growing deployment of fire-safe cable and wire infrastructure, Volatility in halogen-free flame retardant additive sourcing and pricing

  • Who are the major players in the Low Smoke Halogen Free Flame Retardant Polypropylene (Pp) Market?

    • AlphaGary Corp, Ampacet Corp., Avient Corp., BASF SE, Borealis AG, Chemische Fabrik Budenheim KG, Clariant International Ltd., Finproject S.p.A., Huber Advanced Materials, LATI Industria Termoplastici SPA, Lotte Chemical Corp., LyondellBasell Industries N.V., Polykemi AB, RTP Co., SACO AEI Polymers, Saudi Basic Industries, Sirmax S.p.A., Teknor Apex Co. Inc., Thor Group Ltd., Tosaf Compounds Ltd. and Washington Penn Plastic Co.

Market Research Insights

  • The Low Smoke Halogen Free Flame Retardant Polypropylene (PP) Market continuously adapts to stringent fire safety requirements across global infrastructure. Integration of specialized additive systems enhances operational efficiency by 25% during emergency fire containment scenarios. Facilities utilizing these advanced thermoplastic compounds achieve a 30% reduction in corrosive gas emissions, directly improving alignment with modern environmental compliance mandates.
  • By incorporating advanced phosphorus-based flame retardant formulations, manufacturers optimize thermal stability and reduce production cycle times by 15%. This strategic shift toward safer polymer compounding operations ensures robust protection for critical electrical components, lowering long-term maintenance costs and significantly improving overall asset resilience in high-risk industrial environments.

We can help! Our analysts can customize this low smoke halogen free flame retardant polypropylene (pp) market research report to meet your requirements.

Get in touch

1. Executive Summary

1.1 Market overview

Executive Summary - Chart on Market Overview
Executive Summary - Data Table on Market Overview
Executive Summary - Chart on Global Market Characteristics
Executive Summary - Chart on Market by Geography
Executive Summary - Chart on Market Segmentation by Application
Executive Summary - Chart on Market Segmentation by Type
Executive Summary - Chart on Market Segmentation by Formulation
Executive Summary - Chart on Incremental Growth
Executive Summary - Data Table on Incremental Growth
Executive Summary - Chart on Company Market Positioning

2. Technavio Analysis

2.1 Analysis of price sensitivity, lifecycle, customer purchase basket, adoption rates, and purchase criteria

2.2 Criticality of inputs and Factors of differentiation

Chart on Overview on criticality of inputs and factors of differentiation

2.3 Factors of disruption

Chart on Overview on factors of disruption

2.4 Impact of drivers and challenges

Chart on Impact of drivers and challenges in 2025 and 2030

3. Market Landscape

3.1 Market ecosystem

Chart on Parent Market
Data Table on - Parent Market

3.2 Market characteristics

Chart on Market characteristics analysis

3.3 Value chain analysis

Chart on Value chain analysis

4. Market Sizing

4.1 Market definition

Data Table on Offerings of companies included in the market definition

4.2 Market segment analysis

Market segments

4.3 Market size 2025

4.4 Market outlook: Forecast for 2025-2030

Chart on Global - Market size and forecast 2025-2030 ($ thousand)
Data Table on Global - Market size and forecast 2025-2030 ($ thousand)
Chart on Global Market: Year-over-year growth 2025-2030 (%)
Data Table on Global Market: Year-over-year growth 2025-2030 (%)

5. Historic Market Size

5.1 Global Low Smoke Halogen Free Flame Retardant Polypropylene (PP) Market 2020 - 2024

Historic Market Size - Data Table on Global Low Smoke Halogen Free Flame Retardant Polypropylene (PP) Market 2020 - 2024 ($ thousand)

5.2 Application segment analysis 2020 - 2024

Historic Market Size - Application Segment 2020 - 2024 ($ thousand)

5.3 Type segment analysis 2020 - 2024

Historic Market Size - Type Segment 2020 - 2024 ($ thousand)

5.4 Formulation segment analysis 2020 - 2024

Historic Market Size - Formulation Segment 2020 - 2024 ($ thousand)

5.5 Geography segment analysis 2020 - 2024

Historic Market Size - Geography Segment 2020 - 2024 ($ thousand)

5.6 Country segment analysis 2020 - 2024

Historic Market Size - Country Segment 2020 - 2024 ($ thousand)

6. Qualitative Analysis

6.1 Impact of AI on global low smoke halogen free flame retardant polypropylene (PP) market

6.2 Impact of geopolitical conflicts on global low smoke halogen free flame retardant polypropylene (PP) market

7. Five Forces Analysis

7.1 Five forces summary

Five forces analysis - Comparison between 2025 and 2030

7.2 Bargaining power of buyers

Bargaining power of buyers - Impact of key factors 2025 and 2030

7.3 Bargaining power of suppliers

Bargaining power of suppliers - Impact of key factors in 2025 and 2030

7.4 Threat of new entrants

Threat of new entrants - Impact of key factors in 2025 and 2030

7.5 Threat of substitutes

Threat of substitutes - Impact of key factors in 2025 and 2030

7.6 Threat of rivalry

Threat of rivalry - Impact of key factors in 2025 and 2030

7.7 Market condition

Chart on Market condition - Five forces 2025 and 2030

8. Market Segmentation by Application

8.1 Market segments

Chart on Application - Market share 2025-2030 (%)
Data Table on Application - Market share 2025-2030 (%)

8.2 Comparison by Application

Chart on Comparison by Application
Data Table on Comparison by Application

8.3 Construction - Market size and forecast 2025-2030

Chart on Construction - Market size and forecast 2025-2030 ($ thousand)
Data Table on Construction - Market size and forecast 2025-2030 ($ thousand)
Chart on Construction - Year-over-year growth 2025-2030 (%)
Data Table on Construction - Year-over-year growth 2025-2030 (%)

8.4 Automotive - Market size and forecast 2025-2030

Chart on Automotive - Market size and forecast 2025-2030 ($ thousand)
Data Table on Automotive - Market size and forecast 2025-2030 ($ thousand)
Chart on Automotive - Year-over-year growth 2025-2030 (%)
Data Table on Automotive - Year-over-year growth 2025-2030 (%)

8.5 Electrical and electronic - Market size and forecast 2025-2030

Chart on Electrical and electronic - Market size and forecast 2025-2030 ($ thousand)
Data Table on Electrical and electronic - Market size and forecast 2025-2030 ($ thousand)
Chart on Electrical and electronic - Year-over-year growth 2025-2030 (%)
Data Table on Electrical and electronic - Year-over-year growth 2025-2030 (%)

8.6 Industrial - Market size and forecast 2025-2030

Chart on Industrial - Market size and forecast 2025-2030 ($ thousand)
Data Table on Industrial - Market size and forecast 2025-2030 ($ thousand)
Chart on Industrial - Year-over-year growth 2025-2030 (%)
Data Table on Industrial - Year-over-year growth 2025-2030 (%)

8.7 Others - Market size and forecast 2025-2030

Chart on Others - Market size and forecast 2025-2030 ($ thousand)
Data Table on Others - Market size and forecast 2025-2030 ($ thousand)
Chart on Others - Year-over-year growth 2025-2030 (%)
Data Table on Others - Year-over-year growth 2025-2030 (%)

8.8 Market opportunity by Application

Market opportunity by Application ($ thousand)
Data Table on Market opportunity by Application ($ thousand)

9. Market Segmentation by Type

9.1 Market segments

Chart on Type - Market share 2025-2030 (%)
Data Table on Type - Market share 2025-2030 (%)

9.2 Comparison by Type

Chart on Comparison by Type
Data Table on Comparison by Type

9.3 IEC60332-1 - Market size and forecast 2025-2030

Chart on IEC60332-1 - Market size and forecast 2025-2030 ($ thousand)
Data Table on IEC60332-1 - Market size and forecast 2025-2030 ($ thousand)
Chart on IEC60332-1 - Year-over-year growth 2025-2030 (%)
Data Table on IEC60332-1 - Year-over-year growth 2025-2030 (%)

9.4 IEC60332-2 - Market size and forecast 2025-2030

Chart on IEC60332-2 - Market size and forecast 2025-2030 ($ thousand)
Data Table on IEC60332-2 - Market size and forecast 2025-2030 ($ thousand)
Chart on IEC60332-2 - Year-over-year growth 2025-2030 (%)
Data Table on IEC60332-2 - Year-over-year growth 2025-2030 (%)

9.5 IEC60332-3 - Market size and forecast 2025-2030

Chart on IEC60332-3 - Market size and forecast 2025-2030 ($ thousand)
Data Table on IEC60332-3 - Market size and forecast 2025-2030 ($ thousand)
Chart on IEC60332-3 - Year-over-year growth 2025-2030 (%)
Data Table on IEC60332-3 - Year-over-year growth 2025-2030 (%)

9.6 Market opportunity by Type

Market opportunity by Type ($ thousand)
Data Table on Market opportunity by Type ($ thousand)

10. Market Segmentation by Formulation

10.1 Market segments

Chart on Formulation - Market share 2025-2030 (%)
Data Table on Formulation - Market share 2025-2030 (%)

10.2 Comparison by Formulation

Chart on Comparison by Formulation
Data Table on Comparison by Formulation

10.3 Phosphorus-based - Market size and forecast 2025-2030

Chart on Phosphorus-based - Market size and forecast 2025-2030 ($ thousand)
Data Table on Phosphorus-based - Market size and forecast 2025-2030 ($ thousand)
Chart on Phosphorus-based - Year-over-year growth 2025-2030 (%)
Data Table on Phosphorus-based - Year-over-year growth 2025-2030 (%)

10.4 Nitrogen-based - Market size and forecast 2025-2030

Chart on Nitrogen-based - Market size and forecast 2025-2030 ($ thousand)
Data Table on Nitrogen-based - Market size and forecast 2025-2030 ($ thousand)
Chart on Nitrogen-based - Year-over-year growth 2025-2030 (%)
Data Table on Nitrogen-based - Year-over-year growth 2025-2030 (%)

10.5 Metal hydrides - Market size and forecast 2025-2030

Chart on Metal hydrides - Market size and forecast 2025-2030 ($ thousand)
Data Table on Metal hydrides - Market size and forecast 2025-2030 ($ thousand)
Chart on Metal hydrides - Year-over-year growth 2025-2030 (%)
Data Table on Metal hydrides - Year-over-year growth 2025-2030 (%)

10.6 Others - Market size and forecast 2025-2030

Chart on Others - Market size and forecast 2025-2030 ($ thousand)
Data Table on Others - Market size and forecast 2025-2030 ($ thousand)
Chart on Others - Year-over-year growth 2025-2030 (%)
Data Table on Others - Year-over-year growth 2025-2030 (%)

10.7 Market opportunity by Formulation

Market opportunity by Formulation ($ thousand)
Data Table on Market opportunity by Formulation ($ thousand)

11. Customer Landscape

11.1 Customer landscape overview

Analysis of price sensitivity, lifecycle, customer purchase basket, adoption rates, and purchase criteria

12. Geographic Landscape

12.1 Geographic segmentation

Chart on Market share by geography 2025-2030 (%)
Data Table on Market share by geography 2025-2030 (%)

12.2 Geographic comparison

Chart on Geographic comparison
Data Table on Geographic comparison

12.3 APAC - Market size and forecast 2025-2030

Chart on APAC - Market size and forecast 2025-2030 ($ thousand)
Data Table on APAC - Market size and forecast 2025-2030 ($ thousand)
Chart on APAC - Year-over-year growth 2025-2030 (%)
Data Table on APAC - Year-over-year growth 2025-2030 (%)
Chart on Regional Comparison - APAC
Data Table on Regional Comparison - APAC

12.3.1 China - Market size and forecast 2025-2030

Chart on China - Market size and forecast 2025-2030 ($ thousand)
Data Table on China - Market size and forecast 2025-2030 ($ thousand)
Chart on China - Year-over-year growth 2025-2030 (%)
Data Table on China - Year-over-year growth 2025-2030 (%)

12.3.2 Japan - Market size and forecast 2025-2030

Chart on Japan - Market size and forecast 2025-2030 ($ thousand)
Data Table on Japan - Market size and forecast 2025-2030 ($ thousand)
Chart on Japan - Year-over-year growth 2025-2030 (%)
Data Table on Japan - Year-over-year growth 2025-2030 (%)

12.3.3 India - Market size and forecast 2025-2030

Chart on India - Market size and forecast 2025-2030 ($ thousand)
Data Table on India - Market size and forecast 2025-2030 ($ thousand)
Chart on India - Year-over-year growth 2025-2030 (%)
Data Table on India - Year-over-year growth 2025-2030 (%)

12.3.4 South Korea - Market size and forecast 2025-2030

Chart on South Korea - Market size and forecast 2025-2030 ($ thousand)
Data Table on South Korea - Market size and forecast 2025-2030 ($ thousand)
Chart on South Korea - Year-over-year growth 2025-2030 (%)
Data Table on South Korea - Year-over-year growth 2025-2030 (%)

12.3.5 Australia - Market size and forecast 2025-2030

Chart on Australia - Market size and forecast 2025-2030 ($ thousand)
Data Table on Australia - Market size and forecast 2025-2030 ($ thousand)
Chart on Australia - Year-over-year growth 2025-2030 (%)
Data Table on Australia - Year-over-year growth 2025-2030 (%)

12.3.6 Indonesia - Market size and forecast 2025-2030

Chart on Indonesia - Market size and forecast 2025-2030 ($ thousand)
Data Table on Indonesia - Market size and forecast 2025-2030 ($ thousand)
Chart on Indonesia - Year-over-year growth 2025-2030 (%)
Data Table on Indonesia - Year-over-year growth 2025-2030 (%)

12.4 North America - Market size and forecast 2025-2030

Chart on North America - Market size and forecast 2025-2030 ($ thousand)
Data Table on North America - Market size and forecast 2025-2030 ($ thousand)
Chart on North America - Year-over-year growth 2025-2030 (%)
Data Table on North America - Year-over-year growth 2025-2030 (%)
Chart on Regional Comparison - North America
Data Table on Regional Comparison - North America

12.4.1 US - Market size and forecast 2025-2030

Chart on US - Market size and forecast 2025-2030 ($ thousand)
Data Table on US - Market size and forecast 2025-2030 ($ thousand)
Chart on US - Year-over-year growth 2025-2030 (%)
Data Table on US - Year-over-year growth 2025-2030 (%)

12.4.2 Canada - Market size and forecast 2025-2030

Chart on Canada - Market size and forecast 2025-2030 ($ thousand)
Data Table on Canada - Market size and forecast 2025-2030 ($ thousand)
Chart on Canada - Year-over-year growth 2025-2030 (%)
Data Table on Canada - Year-over-year growth 2025-2030 (%)

12.4.3 Mexico - Market size and forecast 2025-2030

Chart on Mexico - Market size and forecast 2025-2030 ($ thousand)
Data Table on Mexico - Market size and forecast 2025-2030 ($ thousand)
Chart on Mexico - Year-over-year growth 2025-2030 (%)
Data Table on Mexico - Year-over-year growth 2025-2030 (%)

12.5 Europe - Market size and forecast 2025-2030

Chart on Europe - Market size and forecast 2025-2030 ($ thousand)
Data Table on Europe - Market size and forecast 2025-2030 ($ thousand)
Chart on Europe - Year-over-year growth 2025-2030 (%)
Data Table on Europe - Year-over-year growth 2025-2030 (%)
Chart on Regional Comparison - Europe
Data Table on Regional Comparison - Europe

12.5.1 Germany - Market size and forecast 2025-2030

Chart on Germany - Market size and forecast 2025-2030 ($ thousand)
Data Table on Germany - Market size and forecast 2025-2030 ($ thousand)
Chart on Germany - Year-over-year growth 2025-2030 (%)
Data Table on Germany - Year-over-year growth 2025-2030 (%)

12.5.2 UK - Market size and forecast 2025-2030

Chart on UK - Market size and forecast 2025-2030 ($ thousand)
Data Table on UK - Market size and forecast 2025-2030 ($ thousand)
Chart on UK - Year-over-year growth 2025-2030 (%)
Data Table on UK - Year-over-year growth 2025-2030 (%)

12.5.3 France - Market size and forecast 2025-2030

Chart on France - Market size and forecast 2025-2030 ($ thousand)
Data Table on France - Market size and forecast 2025-2030 ($ thousand)
Chart on France - Year-over-year growth 2025-2030 (%)
Data Table on France - Year-over-year growth 2025-2030 (%)

12.5.4 Italy - Market size and forecast 2025-2030

Chart on Italy - Market size and forecast 2025-2030 ($ thousand)
Data Table on Italy - Market size and forecast 2025-2030 ($ thousand)
Chart on Italy - Year-over-year growth 2025-2030 (%)
Data Table on Italy - Year-over-year growth 2025-2030 (%)

12.5.5 Spain - Market size and forecast 2025-2030

Chart on Spain - Market size and forecast 2025-2030 ($ thousand)
Data Table on Spain - Market size and forecast 2025-2030 ($ thousand)
Chart on Spain - Year-over-year growth 2025-2030 (%)
Data Table on Spain - Year-over-year growth 2025-2030 (%)

12.5.6 The Netherlands - Market size and forecast 2025-2030

Chart on The Netherlands - Market size and forecast 2025-2030 ($ thousand)
Data Table on The Netherlands - Market size and forecast 2025-2030 ($ thousand)
Chart on The Netherlands - Year-over-year growth 2025-2030 (%)
Data Table on The Netherlands - Year-over-year growth 2025-2030 (%)

12.6 Middle East and Africa - Market size and forecast 2025-2030

Chart on Middle East and Africa - Market size and forecast 2025-2030 ($ thousand)
Data Table on Middle East and Africa - Market size and forecast 2025-2030 ($ thousand)
Chart on Middle East and Africa - Year-over-year growth 2025-2030 (%)
Data Table on Middle East and Africa - Year-over-year growth 2025-2030 (%)
Chart on Regional Comparison - Middle East and Africa
Data Table on Regional Comparison - Middle East and Africa

12.6.1 Saudi Arabia - Market size and forecast 2025-2030

Chart on Saudi Arabia - Market size and forecast 2025-2030 ($ thousand)
Data Table on Saudi Arabia - Market size and forecast 2025-2030 ($ thousand)
Chart on Saudi Arabia - Year-over-year growth 2025-2030 (%)
Data Table on Saudi Arabia - Year-over-year growth 2025-2030 (%)

12.6.2 UAE - Market size and forecast 2025-2030

Chart on UAE - Market size and forecast 2025-2030 ($ thousand)
Data Table on UAE - Market size and forecast 2025-2030 ($ thousand)
Chart on UAE - Year-over-year growth 2025-2030 (%)
Data Table on UAE - Year-over-year growth 2025-2030 (%)

12.6.3 Turkey - Market size and forecast 2025-2030

Chart on Turkey - Market size and forecast 2025-2030 ($ thousand)
Data Table on Turkey - Market size and forecast 2025-2030 ($ thousand)
Chart on Turkey - Year-over-year growth 2025-2030 (%)
Data Table on Turkey - Year-over-year growth 2025-2030 (%)

12.6.4 South Africa - Market size and forecast 2025-2030

Chart on South Africa - Market size and forecast 2025-2030 ($ thousand)
Data Table on South Africa - Market size and forecast 2025-2030 ($ thousand)
Chart on South Africa - Year-over-year growth 2025-2030 (%)
Data Table on South Africa - Year-over-year growth 2025-2030 (%)

12.6.5 Israel - Market size and forecast 2025-2030

Chart on Israel - Market size and forecast 2025-2030 ($ thousand)
Data Table on Israel - Market size and forecast 2025-2030 ($ thousand)
Chart on Israel - Year-over-year growth 2025-2030 (%)
Data Table on Israel - Year-over-year growth 2025-2030 (%)

12.7 South America - Market size and forecast 2025-2030

Chart on South America - Market size and forecast 2025-2030 ($ thousand)
Data Table on South America - Market size and forecast 2025-2030 ($ thousand)
Chart on South America - Year-over-year growth 2025-2030 (%)
Data Table on South America - Year-over-year growth 2025-2030 (%)
Chart on Regional Comparison - South America
Data Table on Regional Comparison - South America

12.7.1 Brazil - Market size and forecast 2025-2030

Chart on Brazil - Market size and forecast 2025-2030 ($ thousand)
Data Table on Brazil - Market size and forecast 2025-2030 ($ thousand)
Chart on Brazil - Year-over-year growth 2025-2030 (%)
Data Table on Brazil - Year-over-year growth 2025-2030 (%)

12.7.2 Argentina - Market size and forecast 2025-2030

Chart on Argentina - Market size and forecast 2025-2030 ($ thousand)
Data Table on Argentina - Market size and forecast 2025-2030 ($ thousand)
Chart on Argentina - Year-over-year growth 2025-2030 (%)
Data Table on Argentina - Year-over-year growth 2025-2030 (%)

12.7.3 Chile - Market size and forecast 2025-2030

Chart on Chile - Market size and forecast 2025-2030 ($ thousand)
Data Table on Chile - Market size and forecast 2025-2030 ($ thousand)
Chart on Chile - Year-over-year growth 2025-2030 (%)
Data Table on Chile - Year-over-year growth 2025-2030 (%)

12.8 Market opportunity by geography

Market opportunity by geography ($ thousand)
Data Tables on Market opportunity by geography ($ thousand)

13. Drivers, Challenges, and Opportunity

13.1 Market drivers

Growing deployment of fire-safe cable and wire infrastructure
Increasing adoption in electric vehicle electrical system components
Expanding use in low smoke building and construction applications

13.2 Market challenges

Volatility in halogen-free flame retardant additive sourcing and pricing
Stringent fire safety certification and compliance requirements
Performance trade-offs between flame retardancy and polypropylene mechanical properties

13.3 Impact of drivers and challenges

Impact of drivers and challenges in 2025 and 2030

13.4 Market opportunities

Advancing development of phosphorus-based flame retardant polypropylene formulations
Increasing localization of specialty polypropylene compounding operations
Evolving integration of recycled content into flame retardant polypropylene products

14. Competitive Landscape

14.1 Overview

14.2

Overview on criticality of inputs and factors of differentiation

14.3 Landscape disruption

Overview on factors of disruption

14.4 Industry risks

Impact of key risks on business

15. Competitive Analysis

15.1 Companies profiled

Companies covered

15.2 Company ranking index

15.3 Market positioning of companies

Matrix on companies position and classification

15.4 AlphaGary Corp

AlphaGary Corp - Overview
AlphaGary Corp - Product / Service
AlphaGary Corp - Key offerings
SWOT

15.5 Ampacet Corp.

Ampacet Corp. - Overview
Ampacet Corp. - Product / Service
Ampacet Corp. - Key offerings
SWOT

15.6 Avient Corp.

Avient Corp. - Overview
Avient Corp. - Business segments
Avient Corp. - Key offerings
Avient Corp. - Segment focus
SWOT

15.7 BASF SE

BASF SE - Overview
BASF SE - Business segments
BASF SE - Key news
BASF SE - Key offerings
BASF SE - Segment focus
SWOT

15.8 Borealis AG

Borealis AG - Overview
Borealis AG - Product / Service
Borealis AG - Key offerings
SWOT

15.9 Chemische Fabrik Budenheim KG

Chemische Fabrik Budenheim KG - Overview
Chemische Fabrik Budenheim KG - Product / Service
Chemische Fabrik Budenheim KG - Key offerings
SWOT

15.10 Clariant International Ltd.

Clariant International Ltd. - Overview
Clariant International Ltd. - Business segments
Clariant International Ltd. - Key offerings
Clariant International Ltd. - Segment focus
SWOT

15.11 Finproject S.p.A.

Finproject S.p.A. - Overview
Finproject S.p.A. - Product / Service
Finproject S.p.A. - Key offerings
SWOT

15.12 Huber Advanced Materials

Huber Advanced Materials - Overview
Huber Advanced Materials - Product / Service
Huber Advanced Materials - Key offerings
SWOT

15.13 Lotte Chemical Corp.

Lotte Chemical Corp. - Overview
Lotte Chemical Corp. - Business segments
Lotte Chemical Corp. - Key offerings
Lotte Chemical Corp. - Segment focus
SWOT

15.14 LyondellBasell Industries N.V.

LyondellBasell Industries N.V. - Overview
LyondellBasell Industries N.V. - Business segments
LyondellBasell Industries N.V. - Key news
LyondellBasell Industries N.V. - Key offerings
LyondellBasell Industries N.V. - Segment focus
SWOT

15.15 RTP Co.

RTP Co. - Overview
RTP Co. - Product / Service
RTP Co. - Key offerings
SWOT

15.16 SACO AEI Polymers

SACO AEI Polymers - Overview
SACO AEI Polymers - Product / Service
SACO AEI Polymers - Key offerings
SWOT

15.17 Teknor Apex Co. Inc.

Teknor Apex Co. Inc. - Overview
Teknor Apex Co. Inc. - Product / Service
Teknor Apex Co. Inc. - Key offerings
SWOT

15.18 Tosaf Compounds Ltd.

Tosaf Compounds Ltd. - Overview
Tosaf Compounds Ltd. - Product / Service
Tosaf Compounds Ltd. - Key offerings
SWOT

16. Appendix

16.1 Scope of the report

Market definition
Objectives
Notes and caveats

16.2 Inclusions and exclusions checklist

Inclusions checklist
Exclusions checklist

16.3 Currency conversion rates for US$

16.4 Research methodology

16.5 Data procurement

Information sources

16.6 Data validation

16.7 Validation techniques employed for market sizing

16.8 Data synthesis

16.9 360 degree market analysis

16.10 List of abbreviations

Research Methodology

Technavio presents a detailed picture of the market by way of study, synthesis, and summation of data from multiple sources. The analysts have presented the various facets of the market with a particular focus on identifying the key industry influencers. The data thus presented is comprehensive, reliable, and the result of extensive research, both primary and secondary.

INFORMATION SOURCES

Primary sources

  • Manufacturers and suppliers
  • Channel partners
  • Industry experts
  • Strategic decision makers

Secondary sources

  • Industry journals and periodicals
  • Government data
  • Financial reports of key industry players
  • Historical data
  • Press releases

DATA ANALYSIS

Data Synthesis

  • Collation of data
  • Estimation of key figures
  • Analysis of derived insights

Data Validation

  • Triangulation with data models
  • Reference against proprietary databases
  • Corroboration with industry experts

REPORT WRITING

Qualitative

  • Market drivers
  • Market challenges
  • Market trends
  • Five forces analysis

Quantitative

  • Market size and forecast
  • Market segmentation
  • Geographical insights
  • Competitive landscape

Interested in this report?

Get your sample now to see our research methodology and insights!

Download Now

Frequently Asked Questions

Low Smoke Halogen Free Flame Retardant Polypropylene (Pp) market growth will increase by USD 430868.2 thousand thousand during 2026-2030.

The Low Smoke Halogen Free Flame Retardant Polypropylene (Pp) market is expected to grow at a CAGR of 8.6% during 2026-2030.

Low Smoke Halogen Free Flame Retardant Polypropylene (Pp) market is segmented by Application (Construction, Automotive, Electrical and electronic, Industrial, Others) Type (IEC60332-1, IEC60332-2, IEC60332-3) Formulation (Phosphorus-based, Nitrogen-based, Metal hydrides, Others)

AlphaGary Corp, Ampacet Corp., Avient Corp., BASF SE, Borealis AG, Chemische Fabrik Budenheim KG, Clariant International Ltd., Finproject S.p.A., Huber Advanced Materials, LATI Industria Termoplastici SPA, Lotte Chemical Corp., LyondellBasell Industries N.V., Polykemi AB, RTP Co., SACO AEI Polymers, Saudi Basic Industries, Sirmax S.p.A., Teknor Apex Co. Inc., Thor Group Ltd., Tosaf Compounds Ltd., Washington Penn Plastic Co. are a few of the key vendors in the Low Smoke Halogen Free Flame Retardant Polypropylene (Pp) market.

APAC will register the highest growth rate of 38% among the other regions. Therefore, the Low Smoke Halogen Free Flame Retardant Polypropylene (Pp) market in APAC is expected to garner significant business opportunities for the vendors during the forecast period.

China, Japan, India, South Korea, Australia, Indonesia, US, Canada, Mexico, Germany, UK, France, Italy, Spain, The Netherlands, Saudi Arabia, UAE, Turkey, South Africa, Israel, Brazil, Argentina, Chile

  • Growing deployment of fire-safe cable and wire infrastructure is the driving factor this market.

The Low Smoke Halogen Free Flame Retardant Polypropylene (Pp) market vendors should focus on grabbing business opportunities from the Application segment as it accounted for the largest market share in the base year.
RIA - Research AI Assistant
Ask RIA
