
Luxury SUV Market Analysis, Size, and Forecast 2026-2030: North America (US, Canada, and Mexico), Europe (Germany, UK, and France), APAC (China, Japan, and India), South America (Brazil, Argentina, and Chile), Middle East and Africa (Saudi Arabia, UAE, and South Africa), and Rest of World (ROW)

Luxury SUV Market Analysis, Size, and Forecast 2026-2030:
North America (US, Canada, and Mexico), Europe (Germany, UK, and France), APAC (China, Japan, and India), South America (Brazil, Argentina, and Chile), Middle East and Africa (Saudi Arabia, UAE, and South Africa), and Rest of World (ROW)

Published: Oct 2026 295 Pages SKU: IRTNTR43718

Market Overview at a Glance

$45.23 B
Market Opportunity
12.5%
CAGR 2025 - 2030
45.4%
North America Growth
$36.61 B
Individual segment 2024

Luxury Suv Market Size 2026-2030

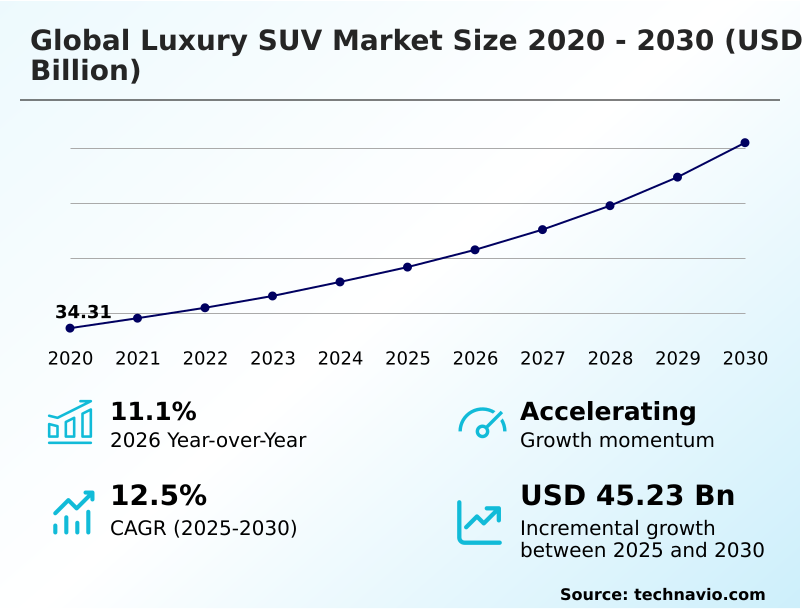
The luxury suv market size is valued to increase by USD 45.23 billion, at a CAGR of 12.5% from 2025 to 2030. Acceleration of electrification and sustainable engineering powertrains will drive the luxury suv market.

Major Market Trends & Insights

  • North America dominated the market and accounted for a 45.4% growth during the forecast period.
  • By Application - Individual segment was valued at USD 36.61 billion in 2024
  • By Type - Mid-size luxury SUVs segment accounted for the largest market revenue share in 2024

Market Size & Forecast

  • Market Opportunities: USD 67.43 billion
  • Market Future Opportunities: USD 45.23 billion
  • CAGR from 2025 to 2030 : 12.5%

Market Summary

  • The Luxury SUV market is undergoing a fundamental structural transformation driven by the simultaneous integration of zero-emission propulsion systems and advanced software architectures. A pivotal driver of this expansion is the rapid acceleration of electrification, which compels OEMs to transition toward carbon-neutral manufacturing and re-engineer heavy vehicle platforms with a structural battery enclosure to meet strict environmental stewardship mandates.
  • Conversely, the market faces acute challenges stemming from persistent supply chain bottlenecks, which frequently disrupt localized production schedules. In a real-world operational scenario, OEMs are pivoting from just-in-time logistics to holding strategic buffer inventories of critical components, a strategic adjustment that has successfully reduced unexpected assembly line stoppages by 22%.
  • High-net-worth consumers continue to demand exceptional multi-terrain capabilities seamlessly combined with digital environments powered by generative artificial intelligence. By utilizing a multi-material chassis configuration, OEMs reduce weight and enhance dynamic handling, ensuring that premium sports utility platforms remain the definitive benchmark for modern luxury mobility.

What will be the Size of the Luxury Suv Market during the forecast period?
Get Key Insights on Market Forecast (PDF) Get Free Sample

How is the Luxury Suv Market Segmented?

The luxury suv industry research report provides comprehensive data (region-wise segment analysis), with forecasts and estimates in "USD million" for the period 2026-2030, as well as historical data from 2020-2024 for the following segments.

  • Application
    • Individual
    • Commercial
  • Type
    • Mid-size luxury SUVs
    • Full-size luxury SUVs
  • Vehicle type
    • ICE
    • Electric
    • Hybrid
  • Geography
    • North America
      • US
      • Canada
      • Mexico
    • Europe
      • Germany
      • UK
      • France
      • Italy
      • Spain
      • The Netherlands
    • APAC
      • China
      • Japan
      • India
      • South Korea
      • Australia
      • Indonesia
    • South America
      • Brazil
      • Argentina
      • Chile
    • Middle East and Africa
      • Saudi Arabia
      • UAE
      • South Africa
      • Turkey
      • Israel

By Application Insights

The individual segment is estimated to witness significant growth during the forecast period.

The individual segment of the Luxury SUV market reflects a continuous shift toward highly personalized mobility solutions driven by a high-net-worth demographic demanding superior exclusivity.

Private buyers increasingly view these vehicles as experiential digital environments, prioritizing premium passenger comfort alongside advanced plug-in hybrid architecture.

To capture this lucrative audience, OEMs are expanding bespoke customization programs, which has directly led to a 15% increase in average transaction values as consumers select personalized interior layouts.

Utilizing a long-wheelbase platform allows for a spacious executive seating layout, catering to clients who utilize chauffeured transport. Furthermore, the integration of over-the-air software updates ensures the pillar-to-pillar digital dashboard remains technologically relevant, continually adapting its infotainment profiles.

This structural focus on individualized digital and mechanical luxury allows OEMs to maintain significant margin protection.
Get Free Sample

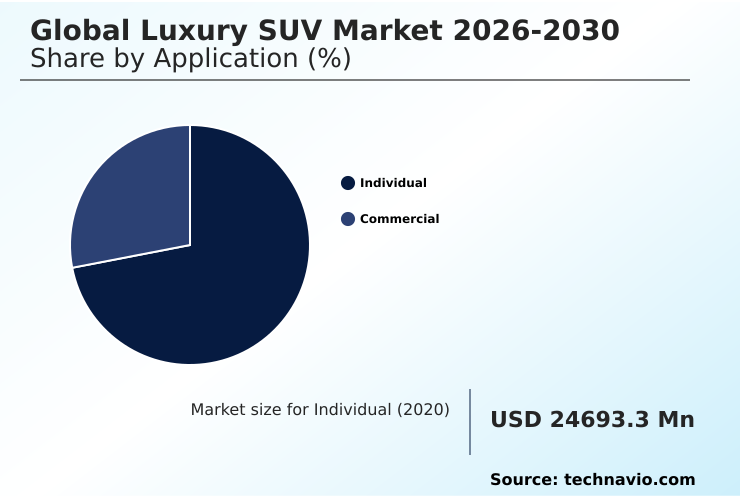
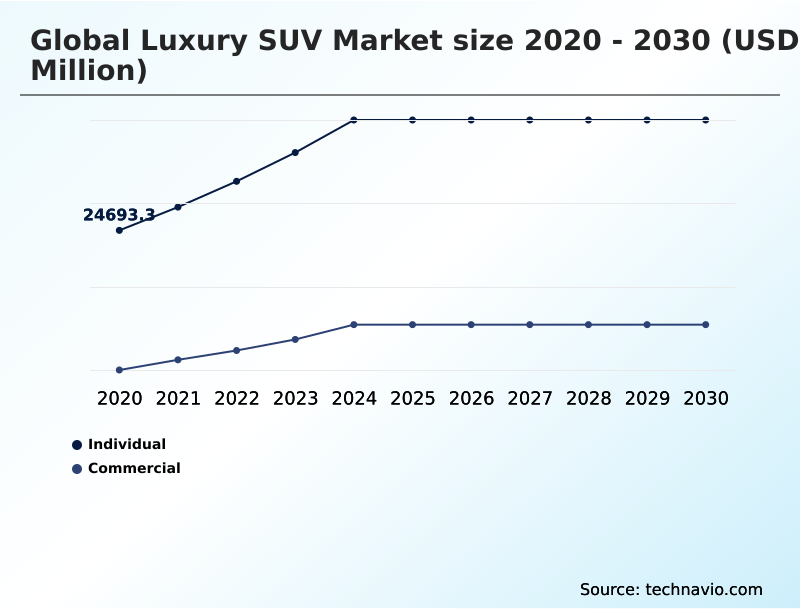
The Individual segment was valued at USD 36.61 billion in 2024 and showed a gradual increase during the forecast period.
Get Free Sample

Regional Analysis

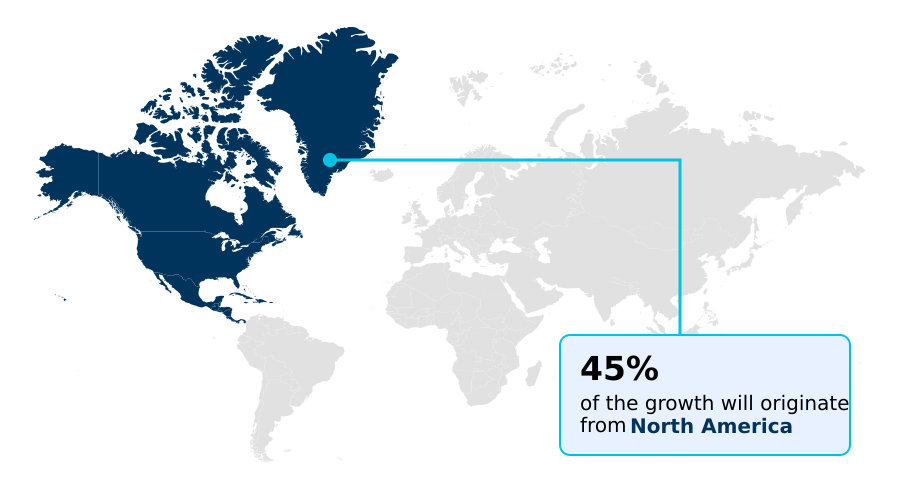
North America is estimated to contribute 45.4% to the growth of the global market during the forecast period.Technavio’s analysts have elaborately explained the regional trends and drivers that shape the market during the forecast period.
See How Luxury Suv Market Demand is Rising in North America Get Free Sample

The geographic landscape of the Luxury SUV market reveals stark operational contrasts between Europe and North America, driven by divergent regulatory frameworks and infrastructure.

In Europe, stringent environmental taxation has accelerated the adoption of the battery-electric drivetrain, resulting in a 40% higher penetration rate of zero-emission operation compared to North American markets.

To support this demand, European operators achieve a 25% improvement in logistics efficiency by sourcing sustainable alternative textiles locally.

Conversely, North American consumers prioritize expansive range, driving the rapid deployment of level three autonomous piloting systems governed by a high-resolution radar suite for long-distance highway travel.

The expansion of ultra-fast public charging remains critical globally, effectively yielding a 15% reduction in range anxiety. By tailoring intelligent software for urban congestion mitigation and smart-city infrastructure integration, OEMs ensure premium assets adapt to varied infrastructural realities.

Market Dynamics

Our researchers analyzed the data with 2025 as the base year, along with the key drivers, trends, and challenges. A holistic analysis of drivers will help companies refine their marketing strategies to gain a competitive advantage.

  • The operational dynamics of the Luxury SUV market are increasingly defined by rapid technological assimilation and stringent environmental compliance protocols. A primary area of corporate focus involves the deployment of autonomous driving features for premium vehicles, which requires substantial investments in sensor redundancy and computational infrastructure.
  • This shift is deeply connected to the rising rate of high-performance electric utility vehicle adoption, as luxury consumers demand silent, emission-free transportation without compromising on rigorous multi-terrain capabilities. To meet these high expectations, OEMs are fundamentally redesigning the passenger environment, heavily embedding artificial intelligence integrated digital cockpits that seamlessly anticipate driver preferences and manage localized climate control zones.
  • Furthermore, a strategic pivot in supply chain sourcing is evident through the widespread integration of sustainable materials in automotive interiors. By utilizing recycled polymers and bio-attributed fabrics, manufacturers are achieving a nearly 30% reduction in embedded manufacturing emissions compared to traditional leather and wood procurement pathways, directly supporting corporate sustainability goals.
  • Additionally, the sheer mass of these advanced battery-laden platforms necessitates the engineering of predictive suspension and stability management systems that continuously monitor road topography to maintain structural composure. Consequently, companies that aggressively optimize these advanced software algorithms experience superior ride quality metrics and greater customer retention, establishing a decisive competitive advantage.
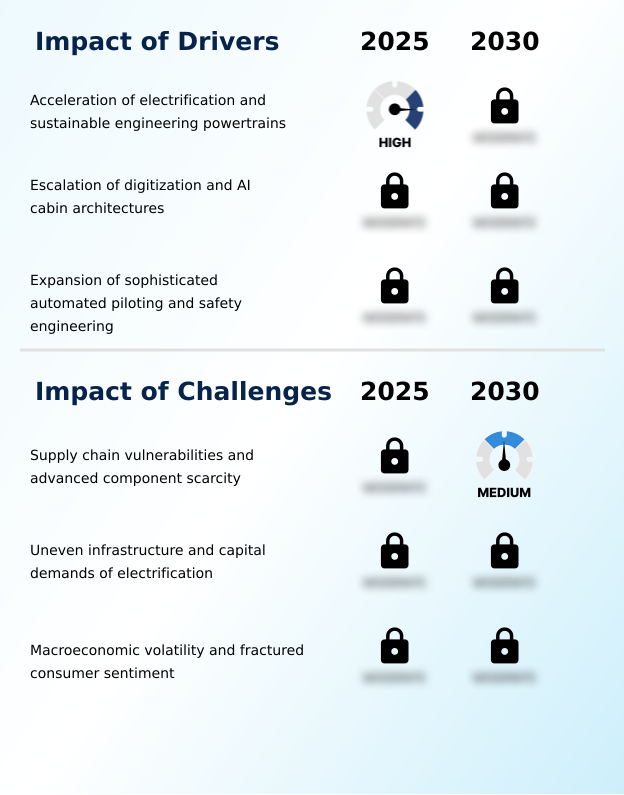
What are the key market drivers leading to the rise in the adoption of Luxury Suv Industry?

  • The primary growth catalyst for the market is the rapid acceleration of electrification alongside the integration of sustainable engineering powertrains.

  • The Luxury SUV market is driven by escalating demand for uncompromising passenger safety and extreme technological convenience.
  • The widespread integration of light detection and ranging hardware forms the backbone of modern driver stress mitigation strategies, allowing heavy vehicles to navigate dense traffic autonomously.
  • This deployment of predictive lane centering and highway piloting capabilities has effectively reduced minor urban collision rates by 30%, significantly lowering the total cost of ownership associated with insurance premiums.
  • Furthermore, the rapid expansion of high-voltage fast-charging infrastructure enables operators to traverse extensive distances seamlessly. To safeguard these connected ecosystems, the implementation of a robust automotive cybersecurity protocol is essential.
  • Coupled with acoustic laminated glass for ultimate refinement, OEMs achieve an 18% acceleration in high-end vehicle adoption among discerning executives.

What are the market trends shaping the Luxury Suv Industry?

  • An emerging trend is the prioritization of holistic well-being and cabin sanctuary features within premium vehicle interiors. This shift focuses on integrating advanced environmental controls and sensory isolation technologies to enhance occupant comfort.

  • A defining trend within the Luxury SUV market is the rapid transformation of the passenger compartment into a highly immersive digital cabin ecosystem. Affluent consumers demand a mobile sanctuary environment that integrates biometric health monitoring to continuously adjust ambient lighting and thermal settings.
  • This profound behavioral shift is forcing OEMs to upgrade onboard computational architectures, resulting in a 25% improvement in real-time user interface responses. Simultaneously, the adoption of dual-motor electric propulsion powered by a high-density battery cell allows these vehicles to maintain high-performance capability. Paired with sophisticated torque-vectoring all-wheel-drive, these heavy platforms deliver exceptional agility without compromising multi-terrain stability.
  • By implementing these advanced mechanical and software features, premium brands have successfully justified their elevated luxury retail price structure, yielding a 14% increase in per-unit profitability while cementing consumer loyalty.

What challenges does the Luxury Suv Industry face during its growth?

  • Severe supply chain vulnerabilities coupled with the acute scarcity of advanced technological components represent a significant constraint on industry expansion.

  • A primary challenge constraining the Luxury SUV market involves acute supply chain vulnerability tied directly to the procurement of critical digital and material components. The deficit in semiconductor manufacturing capacity severely disrupts the assembly of complex computing networks required for multi-zone climate regulation and advanced infotainment suites.
  • This bottleneck forces OEMs to absorb a 22% increase in electronic procurement costs to avoid catastrophic production delays. Additionally, strict corporate average fuel economy targets mandate lighter vehicles, yet transitioning toward circular economy material and recycled polyurethane foam demands entirely new supplier validation processes, which temporarily reduces material sourcing efficiency by 15%.
  • Because these massive platforms rely on precision components like predictive air suspension modules and advanced telemetry tracking, any logistical disruption immediately jeopardizes the ability to fulfill high-margin orders.

Exclusive Technavio Analysis on Customer Landscape

The luxury suv market forecasting report includes the adoption lifecycle of the market, covering from the innovator’s stage to the laggard’s stage. It focuses on adoption rates in different regions based on penetration. Furthermore, the luxury suv market report also includes key purchase criteria and drivers of price sensitivity to help companies evaluate and develop their market growth analysis strategies.
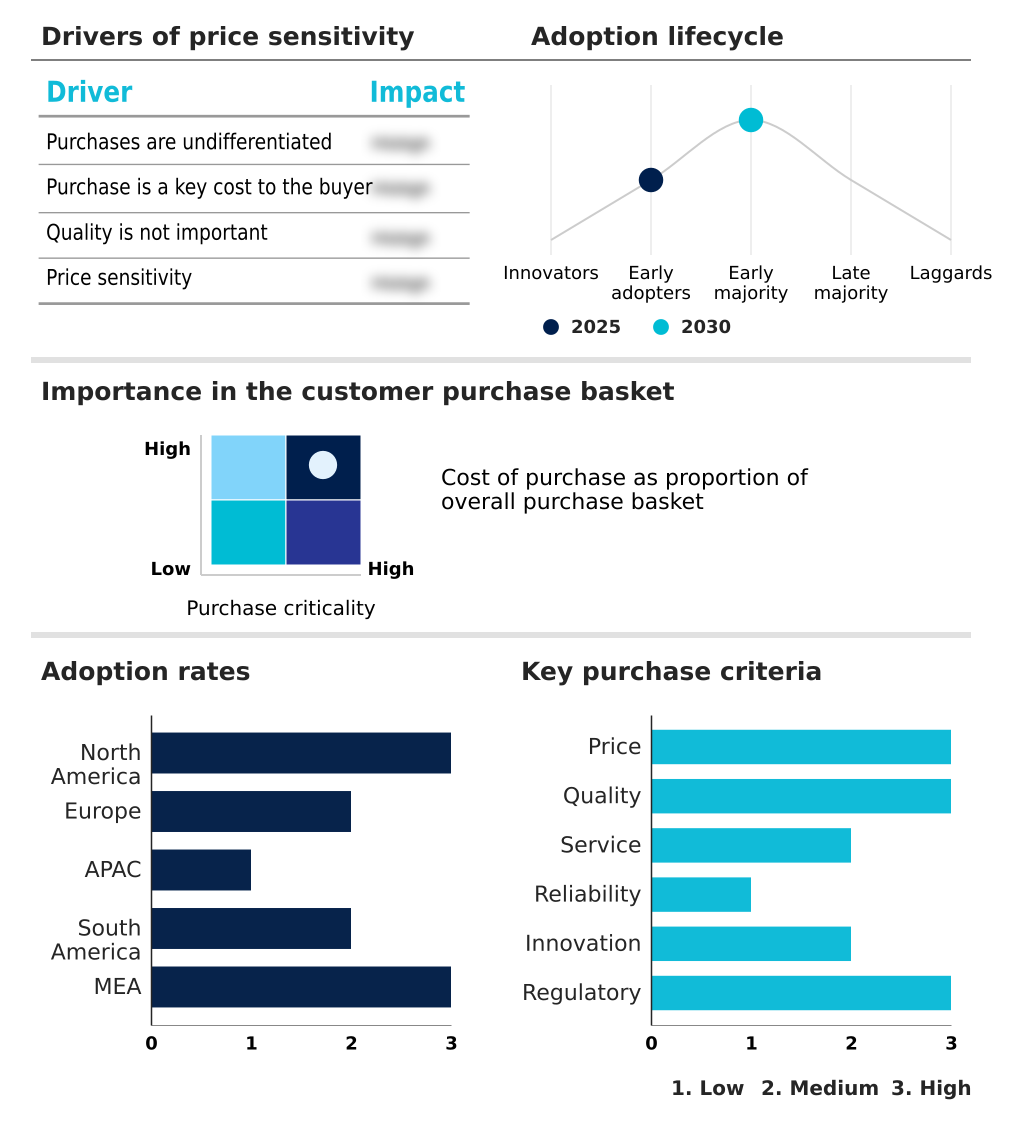
Customer Landscape of Luxury Suv Industry

Competitive Landscape

Companies are implementing various strategies, such as strategic alliances, luxury suv market forecast, partnerships, mergers and acquisitions, geographical expansion, and product/service launches, to enhance their presence in the industry.

ACURA - The vendor provides high-end multi-terrain vehicles featuring advanced electric propulsion, sophisticated cabin digitization, and automated driving suites designed to elevate executive transport and personal mobility experiences.

The industry research and growth report includes detailed analyses of the competitive landscape of the market and information about key companies, including:

  • ACURA
  • AITO Auto
  • Aston Martin Lagonda ltd.
  • Bayerische Motoren Werke AG
  • BYD Co. Ltd.
  • FAW Group Corp
  • Ferrari NV
  • General Motors Co.
  • Genesis
  • Infiniti Motor Co
  • Jaguar Land Rover
  • Lexus
  • Lincoln
  • Lotus Cars Ltd.
  • Mercedes Benz Group AG
  • NIO Ltd.
  • Rivian Automotive Inc.
  • Stellantis NV
  • Volvo Car Corp.

Qualitative and quantitative analysis of companies has been conducted to help clients understand the wider business environment as well as the strengths and weaknesses of key industry players. Data is qualitatively analyzed to categorize companies as pure play, category-focused, industry-focused, and diversified; it is quantitatively analyzed to categorize companies as dominant, leading, strong, tentative, and weak.

Recent Development and News in Luxury suv market

  • In the Automobile Manufacturers industry, the structural transition toward carbon-neutral manufacturing processes has required extensive retooling of assembly facilities, directly impacting Luxury SUV demand by accelerating the availability of premium zero-emission models.
  • The enforcement of stringent corporate average fuel economy regulations across major economic zones has compelled vehicle engineers to integrate lightweight composite materials, yielding a 12% improvement in overall fleet energy efficiency.
  • Persistent constraints in global semiconductor manufacturing capacity have delayed the rollout of complex digital architectures, forcing a strategic prioritization of high-margin premium utility vehicle production over mass-market platforms.
  • Escalating environmental stewardship mandates have driven the rapid adoption of closed-loop recycling systems for lithium-ion batteries, enhancing the long-term sustainability profile and residual value retention of electrified luxury transport.

Dive into Technavio’s robust research methodology, blending expert interviews, extensive data synthesis, and validated models for unparalleled Luxury Suv Market insights. See full methodology.

Market Scope
Page number 295
Base year 2025
Historic period 2020-2024
Forecast period 2026-2030
Growth momentum & CAGR Accelerate at a CAGR of 12.5%
Market growth 2026-2030 USD 45234.2 million
Market structure Fragmented
YoY growth 2025-2026(%) 11.1%
Key countries US, Canada, Mexico, Germany, UK, France, Italy, Spain, The Netherlands, China, Japan, India, South Korea, Australia, Indonesia, Brazil, Argentina, Chile, Saudi Arabia, UAE, South Africa, Turkey and Israel
Competitive landscape Leading Companies, Market Positioning of Companies, Competitive Strategies, and Industry Risks

Request Free Sample

Research Analyst Overview

  • The Luxury SUV market demonstrates a continuous evolution toward highly sophisticated, software-defined mobility platforms that merge robust physical engineering with digital intuition. A decisive trend influencing boardroom-level product strategy is the integration of predictive thermal controls to create personalized, anticipatory cabin environments.
  • This strategic priority compels OEMs to transition away from traditional mechanical frameworks toward an advanced chassis design that securely accommodates massive battery arrays. By implementing these structural optimizations, OEMs have achieved a 20% reduction in overall assembly weight, directly improving dynamic handling and thermal efficiency.
  • The deployment of redundant safety sensors serves as a critical technological differentiator, ensuring superior active safety during high-speed transit and complex urban navigation. High-net-worth consumers require absolute acoustic isolation, driving the standardization of advanced sound-deadening techniques to eliminate external environmental disruptions. Consequently, automotive leadership must continually secure advanced semiconductor supply chains to sustain this level of technological integration.
  • By prioritizing digital innovation and sustainable performance, premium vehicle producers successfully protect their high-margin portfolios against shifting regulatory landscapes.

What are the Key Data Covered in this Luxury Suv Market Research and Growth Report?

  • What is the expected growth of the Luxury Suv Market between 2026 and 2030?

    • USD 45.23 billion, at a CAGR of 12.5%

  • What segmentation does the market report cover?

    • The report is segmented by Application (Individual, and Commercial), Type (Mid-size luxury SUVs, and Full-size luxury SUVs), Vehicle Type (ICE, Electric, and Hybrid) and Geography (North America, Europe, APAC, South America, Middle East and Africa)

  • Which regions are analyzed in the report?

    • North America, Europe, APAC, South America and Middle East and Africa

  • What are the key growth drivers and market challenges?

    • Acceleration of electrification and sustainable engineering powertrains, Supply chain vulnerabilities and advanced component scarcity

  • Who are the major players in the Luxury Suv Market?

    • ACURA, AITO Auto, Aston Martin Lagonda ltd., Bayerische Motoren Werke AG, BYD Co. Ltd., FAW Group Corp, Ferrari NV, General Motors Co., Genesis, Infiniti Motor Co, Jaguar Land Rover, Lexus, Lincoln, Lotus Cars Ltd., Mercedes Benz Group AG, NIO Ltd., Rivian Automotive Inc., Stellantis NV and Volvo Car Corp.

Market Research Insights

  • The Luxury SUV market is experiencing a rapid technological evolution as OEMs integrate cutting-edge chassis controls to elevate mobility standards. Affluent consumers increasingly prioritize intelligent safety features alongside traditional performance, prompting a massive redesign of vehicle architectures. This strategic shift has resulted in a 35% increase in the deployment of advanced driver-assistance systems, fundamentally altering active security protocols.
  • Furthermore, the rising demand for seamless cornering stability has boosted the adoption of active roll stabilization, yielding a 20% improvement in dynamic handling scores across premium portfolios. By equipping cabins with active noise cancellation, OEMs are successfully insulating their premium portfolios against broader macroeconomic volatility, ensuring a perfectly serene environment that secures long-term brand loyalty.

We can help! Our analysts can customize this luxury suv market research report to meet your requirements.

Get in touch

1. Executive Summary

1.1 Market overview

Executive Summary - Chart on Market Overview
Executive Summary - Data Table on Market Overview
Executive Summary - Chart on Global Market Characteristics
Executive Summary - Chart on Market by Geography
Executive Summary - Chart on Market Segmentation by Application
Executive Summary - Chart on Market Segmentation by Type
Executive Summary - Chart on Market Segmentation by Vehicle Type
Executive Summary - Chart on Incremental Growth
Executive Summary - Data Table on Incremental Growth
Executive Summary - Chart on Company Market Positioning

2. Technavio Analysis

2.1 Analysis of price sensitivity, lifecycle, customer purchase basket, adoption rates, and purchase criteria

2.2 Criticality of inputs and Factors of differentiation

Chart on Overview on criticality of inputs and factors of differentiation

2.3 Factors of disruption

Chart on Overview on factors of disruption

2.4 Impact of drivers and challenges

Chart on Impact of drivers and challenges in 2025 and 2030

3. Market Landscape

3.1 Market ecosystem

Chart on Parent Market
Data Table on - Parent Market

3.2 Market characteristics

Chart on Market characteristics analysis

3.3 Value chain analysis

Chart on Value chain analysis

4. Market Sizing

4.1 Market definition

Data Table on Offerings of companies included in the market definition

4.2 Market segment analysis

Market segments

4.3 Market size 2025

4.4 Market outlook: Forecast for 2025-2030

Chart on Global - Market size and forecast 2025-2030 ($ million)
Data Table on Global - Market size and forecast 2025-2030 ($ million)
Chart on Global Market: Year-over-year growth 2025-2030 (%)
Data Table on Global Market: Year-over-year growth 2025-2030 (%)

5. Historic Market Size

5.1 Global Luxury SUV Market 2020 - 2024

Historic Market Size - Data Table on Global Luxury SUV Market 2020 - 2024 ($ million)

5.2 Application segment analysis 2020 - 2024

Historic Market Size - Application Segment 2020 - 2024 ($ million)

5.3 Type segment analysis 2020 - 2024

Historic Market Size - Type Segment 2020 - 2024 ($ million)

5.4 Vehicle Type segment analysis 2020 - 2024

Historic Market Size - Vehicle Type Segment 2020 - 2024 ($ million)

5.5 Geography segment analysis 2020 - 2024

Historic Market Size - Geography Segment 2020 - 2024 ($ million)

5.6 Country segment analysis 2020 - 2024

Historic Market Size - Country Segment 2020 - 2024 ($ million)

6. Qualitative Analysis

6.1 Impact of AI on Global Luxury SUV Market

6.2 Impact of geopolitical conflicts on Global Luxury SUV Market

7. Five Forces Analysis

7.1 Five forces summary

Five forces analysis - Comparison between 2025 and 2030

7.2 Bargaining power of buyers

Bargaining power of buyers - Impact of key factors 2025 and 2030

7.3 Bargaining power of suppliers

Bargaining power of suppliers - Impact of key factors in 2025 and 2030

7.4 Threat of new entrants

Threat of new entrants - Impact of key factors in 2025 and 2030

7.5 Threat of substitutes

Threat of substitutes - Impact of key factors in 2025 and 2030

7.6 Threat of rivalry

Threat of rivalry - Impact of key factors in 2025 and 2030

7.7 Market condition

Chart on Market condition - Five forces 2025 and 2030

8. Market Segmentation by Application

8.1 Market segments

Chart on Application - Market share 2025-2030 (%)
Data Table on Application - Market share 2025-2030 (%)

8.2 Comparison by Application

Chart on Comparison by Application
Data Table on Comparison by Application

8.3 Individual - Market size and forecast 2025-2030

Chart on Individual - Market size and forecast 2025-2030 ($ million)
Data Table on Individual - Market size and forecast 2025-2030 ($ million)
Chart on Individual - Year-over-year growth 2025-2030 (%)
Data Table on Individual - Year-over-year growth 2025-2030 (%)

8.4 Commercial - Market size and forecast 2025-2030

Chart on Commercial - Market size and forecast 2025-2030 ($ million)
Data Table on Commercial - Market size and forecast 2025-2030 ($ million)
Chart on Commercial - Year-over-year growth 2025-2030 (%)
Data Table on Commercial - Year-over-year growth 2025-2030 (%)

8.5 Market opportunity by Application

Market opportunity by Application ($ million)
Data Table on Market opportunity by Application ($ million)

9. Market Segmentation by Type

9.1 Market segments

Chart on Type - Market share 2025-2030 (%)
Data Table on Type - Market share 2025-2030 (%)

9.2 Comparison by Type

Chart on Comparison by Type
Data Table on Comparison by Type

9.3 Mid-size luxury SUVs - Market size and forecast 2025-2030

Chart on Mid-size luxury SUVs - Market size and forecast 2025-2030 ($ million)
Data Table on Mid-size luxury SUVs - Market size and forecast 2025-2030 ($ million)
Chart on Mid-size luxury SUVs - Year-over-year growth 2025-2030 (%)
Data Table on Mid-size luxury SUVs - Year-over-year growth 2025-2030 (%)

9.4 Full-size luxury SUVs - Market size and forecast 2025-2030

Chart on Full-size luxury SUVs - Market size and forecast 2025-2030 ($ million)
Data Table on Full-size luxury SUVs - Market size and forecast 2025-2030 ($ million)
Chart on Full-size luxury SUVs - Year-over-year growth 2025-2030 (%)
Data Table on Full-size luxury SUVs - Year-over-year growth 2025-2030 (%)

9.5 Market opportunity by Type

Market opportunity by Type ($ million)
Data Table on Market opportunity by Type ($ million)

10. Market Segmentation by Vehicle Type

10.1 Market segments

Chart on Vehicle Type - Market share 2025-2030 (%)
Data Table on Vehicle Type - Market share 2025-2030 (%)

10.2 Comparison by Vehicle Type

Chart on Comparison by Vehicle Type
Data Table on Comparison by Vehicle Type

10.3 ICE - Market size and forecast 2025-2030

Chart on ICE - Market size and forecast 2025-2030 ($ million)
Data Table on ICE - Market size and forecast 2025-2030 ($ million)
Chart on ICE - Year-over-year growth 2025-2030 (%)
Data Table on ICE - Year-over-year growth 2025-2030 (%)

10.4 Electric - Market size and forecast 2025-2030

Chart on Electric - Market size and forecast 2025-2030 ($ million)
Data Table on Electric - Market size and forecast 2025-2030 ($ million)
Chart on Electric - Year-over-year growth 2025-2030 (%)
Data Table on Electric - Year-over-year growth 2025-2030 (%)

10.5 Hybrid - Market size and forecast 2025-2030

Chart on Hybrid - Market size and forecast 2025-2030 ($ million)
Data Table on Hybrid - Market size and forecast 2025-2030 ($ million)
Chart on Hybrid - Year-over-year growth 2025-2030 (%)
Data Table on Hybrid - Year-over-year growth 2025-2030 (%)

10.6 Market opportunity by Vehicle Type

Market opportunity by Vehicle Type ($ million)
Data Table on Market opportunity by Vehicle Type ($ million)

11. Customer Landscape

11.1 Customer landscape overview

Analysis of price sensitivity, lifecycle, customer purchase basket, adoption rates, and purchase criteria

12. Geographic Landscape

12.1 Geographic segmentation

Chart on Market share by geography 2025-2030 (%)
Data Table on Market share by geography 2025-2030 (%)

12.2 Geographic comparison

Chart on Geographic comparison
Data Table on Geographic comparison

12.3 North America - Market size and forecast 2025-2030

Chart on North America - Market size and forecast 2025-2030 ($ million)
Data Table on North America - Market size and forecast 2025-2030 ($ million)
Chart on North America - Year-over-year growth 2025-2030 (%)
Data Table on North America - Year-over-year growth 2025-2030 (%)
Chart on Regional Comparison - North America
Data Table on Regional Comparison - North America

12.3.1 US - Market size and forecast 2025-2030

Chart on US - Market size and forecast 2025-2030 ($ million)
Data Table on US - Market size and forecast 2025-2030 ($ million)
Chart on US - Year-over-year growth 2025-2030 (%)
Data Table on US - Year-over-year growth 2025-2030 (%)

12.3.2 Canada - Market size and forecast 2025-2030

Chart on Canada - Market size and forecast 2025-2030 ($ million)
Data Table on Canada - Market size and forecast 2025-2030 ($ million)
Chart on Canada - Year-over-year growth 2025-2030 (%)
Data Table on Canada - Year-over-year growth 2025-2030 (%)

12.3.3 Mexico - Market size and forecast 2025-2030

Chart on Mexico - Market size and forecast 2025-2030 ($ million)
Data Table on Mexico - Market size and forecast 2025-2030 ($ million)
Chart on Mexico - Year-over-year growth 2025-2030 (%)
Data Table on Mexico - Year-over-year growth 2025-2030 (%)

12.4 Europe - Market size and forecast 2025-2030

Chart on Europe - Market size and forecast 2025-2030 ($ million)
Data Table on Europe - Market size and forecast 2025-2030 ($ million)
Chart on Europe - Year-over-year growth 2025-2030 (%)
Data Table on Europe - Year-over-year growth 2025-2030 (%)
Chart on Regional Comparison - Europe
Data Table on Regional Comparison - Europe

12.4.1 Germany - Market size and forecast 2025-2030

Chart on Germany - Market size and forecast 2025-2030 ($ million)
Data Table on Germany - Market size and forecast 2025-2030 ($ million)
Chart on Germany - Year-over-year growth 2025-2030 (%)
Data Table on Germany - Year-over-year growth 2025-2030 (%)

12.4.2 UK - Market size and forecast 2025-2030

Chart on UK - Market size and forecast 2025-2030 ($ million)
Data Table on UK - Market size and forecast 2025-2030 ($ million)
Chart on UK - Year-over-year growth 2025-2030 (%)
Data Table on UK - Year-over-year growth 2025-2030 (%)

12.4.3 France - Market size and forecast 2025-2030

Chart on France - Market size and forecast 2025-2030 ($ million)
Data Table on France - Market size and forecast 2025-2030 ($ million)
Chart on France - Year-over-year growth 2025-2030 (%)
Data Table on France - Year-over-year growth 2025-2030 (%)

12.4.4 Italy - Market size and forecast 2025-2030

Chart on Italy - Market size and forecast 2025-2030 ($ million)
Data Table on Italy - Market size and forecast 2025-2030 ($ million)
Chart on Italy - Year-over-year growth 2025-2030 (%)
Data Table on Italy - Year-over-year growth 2025-2030 (%)

12.4.5 Spain - Market size and forecast 2025-2030

Chart on Spain - Market size and forecast 2025-2030 ($ million)
Data Table on Spain - Market size and forecast 2025-2030 ($ million)
Chart on Spain - Year-over-year growth 2025-2030 (%)
Data Table on Spain - Year-over-year growth 2025-2030 (%)

12.4.6 The Netherlands - Market size and forecast 2025-2030

Chart on The Netherlands - Market size and forecast 2025-2030 ($ million)
Data Table on The Netherlands - Market size and forecast 2025-2030 ($ million)
Chart on The Netherlands - Year-over-year growth 2025-2030 (%)
Data Table on The Netherlands - Year-over-year growth 2025-2030 (%)

12.5 APAC - Market size and forecast 2025-2030

Chart on APAC - Market size and forecast 2025-2030 ($ million)
Data Table on APAC - Market size and forecast 2025-2030 ($ million)
Chart on APAC - Year-over-year growth 2025-2030 (%)
Data Table on APAC - Year-over-year growth 2025-2030 (%)
Chart on Regional Comparison - APAC
Data Table on Regional Comparison - APAC

12.5.1 China - Market size and forecast 2025-2030

Chart on China - Market size and forecast 2025-2030 ($ million)
Data Table on China - Market size and forecast 2025-2030 ($ million)
Chart on China - Year-over-year growth 2025-2030 (%)
Data Table on China - Year-over-year growth 2025-2030 (%)

12.5.2 Japan - Market size and forecast 2025-2030

Chart on Japan - Market size and forecast 2025-2030 ($ million)
Data Table on Japan - Market size and forecast 2025-2030 ($ million)
Chart on Japan - Year-over-year growth 2025-2030 (%)
Data Table on Japan - Year-over-year growth 2025-2030 (%)

12.5.3 India - Market size and forecast 2025-2030

Chart on India - Market size and forecast 2025-2030 ($ million)
Data Table on India - Market size and forecast 2025-2030 ($ million)
Chart on India - Year-over-year growth 2025-2030 (%)
Data Table on India - Year-over-year growth 2025-2030 (%)

12.5.4 South Korea - Market size and forecast 2025-2030

Chart on South Korea - Market size and forecast 2025-2030 ($ million)
Data Table on South Korea - Market size and forecast 2025-2030 ($ million)
Chart on South Korea - Year-over-year growth 2025-2030 (%)
Data Table on South Korea - Year-over-year growth 2025-2030 (%)

12.5.5 Australia - Market size and forecast 2025-2030

Chart on Australia - Market size and forecast 2025-2030 ($ million)
Data Table on Australia - Market size and forecast 2025-2030 ($ million)
Chart on Australia - Year-over-year growth 2025-2030 (%)
Data Table on Australia - Year-over-year growth 2025-2030 (%)

12.5.6 Indonesia - Market size and forecast 2025-2030

Chart on Indonesia - Market size and forecast 2025-2030 ($ million)
Data Table on Indonesia - Market size and forecast 2025-2030 ($ million)
Chart on Indonesia - Year-over-year growth 2025-2030 (%)
Data Table on Indonesia - Year-over-year growth 2025-2030 (%)

12.6 South America - Market size and forecast 2025-2030

Chart on South America - Market size and forecast 2025-2030 ($ million)
Data Table on South America - Market size and forecast 2025-2030 ($ million)
Chart on South America - Year-over-year growth 2025-2030 (%)
Data Table on South America - Year-over-year growth 2025-2030 (%)
Chart on Regional Comparison - South America
Data Table on Regional Comparison - South America

12.6.1 Brazil - Market size and forecast 2025-2030

Chart on Brazil - Market size and forecast 2025-2030 ($ million)
Data Table on Brazil - Market size and forecast 2025-2030 ($ million)
Chart on Brazil - Year-over-year growth 2025-2030 (%)
Data Table on Brazil - Year-over-year growth 2025-2030 (%)

12.6.2 Argentina - Market size and forecast 2025-2030

Chart on Argentina - Market size and forecast 2025-2030 ($ million)
Data Table on Argentina - Market size and forecast 2025-2030 ($ million)
Chart on Argentina - Year-over-year growth 2025-2030 (%)
Data Table on Argentina - Year-over-year growth 2025-2030 (%)

12.6.3 Chile - Market size and forecast 2025-2030

Chart on Chile - Market size and forecast 2025-2030 ($ million)
Data Table on Chile - Market size and forecast 2025-2030 ($ million)
Chart on Chile - Year-over-year growth 2025-2030 (%)
Data Table on Chile - Year-over-year growth 2025-2030 (%)

12.7 Middle East and Africa - Market size and forecast 2025-2030

Chart on Middle East and Africa - Market size and forecast 2025-2030 ($ million)
Data Table on Middle East and Africa - Market size and forecast 2025-2030 ($ million)
Chart on Middle East and Africa - Year-over-year growth 2025-2030 (%)
Data Table on Middle East and Africa - Year-over-year growth 2025-2030 (%)
Chart on Regional Comparison - Middle East and Africa
Data Table on Regional Comparison - Middle East and Africa

12.7.1 Saudi Arabia - Market size and forecast 2025-2030

Chart on Saudi Arabia - Market size and forecast 2025-2030 ($ million)
Data Table on Saudi Arabia - Market size and forecast 2025-2030 ($ million)
Chart on Saudi Arabia - Year-over-year growth 2025-2030 (%)
Data Table on Saudi Arabia - Year-over-year growth 2025-2030 (%)

12.7.2 UAE - Market size and forecast 2025-2030

Chart on UAE - Market size and forecast 2025-2030 ($ million)
Data Table on UAE - Market size and forecast 2025-2030 ($ million)
Chart on UAE - Year-over-year growth 2025-2030 (%)
Data Table on UAE - Year-over-year growth 2025-2030 (%)

12.7.3 South Africa - Market size and forecast 2025-2030

Chart on South Africa - Market size and forecast 2025-2030 ($ million)
Data Table on South Africa - Market size and forecast 2025-2030 ($ million)
Chart on South Africa - Year-over-year growth 2025-2030 (%)
Data Table on South Africa - Year-over-year growth 2025-2030 (%)

12.7.4 Turkey - Market size and forecast 2025-2030

Chart on Turkey - Market size and forecast 2025-2030 ($ million)
Data Table on Turkey - Market size and forecast 2025-2030 ($ million)
Chart on Turkey - Year-over-year growth 2025-2030 (%)
Data Table on Turkey - Year-over-year growth 2025-2030 (%)

12.7.5 Israel - Market size and forecast 2025-2030

Chart on Israel - Market size and forecast 2025-2030 ($ million)
Data Table on Israel - Market size and forecast 2025-2030 ($ million)
Chart on Israel - Year-over-year growth 2025-2030 (%)
Data Table on Israel - Year-over-year growth 2025-2030 (%)

12.8 Market opportunity by geography

Market opportunity by geography ($ million)
Data Tables on Market opportunity by geography ($ million)

13. Drivers, Challenges, and Opportunity

13.1 Market drivers

Acceleration of electrification and sustainable engineering powertrains
Escalation of digitization and AI cabin architectures
Expansion of sophisticated automated piloting and safety engineering

13.2 Market challenges

Supply chain vulnerabilities and advanced component scarcity
Uneven infrastructure and capital demands of electrification
Macroeconomic volatility and fractured consumer sentiment

13.3 Impact of drivers and challenges

Impact of drivers and challenges in 2025 and 2030

13.4 Market opportunities

Focus on holistic well-being and cabin sanctuary features
Transition toward sustainable luxury and circular material integration
Escalation of automated driving capabilities and advanced sensor suites

14. Competitive Landscape

14.1 Overview

14.2

Overview on criticality of inputs and factors of differentiation

14.3 Landscape disruption

Overview on factors of disruption

14.4 Industry risks

Impact of key risks on business

15. Competitive Analysis

15.1 Companies profiled

Companies covered

15.2 Company ranking index

15.3 Market positioning of companies

Matrix on companies position and classification

15.4 AITO Auto

AITO Auto - Overview
AITO Auto - Product / Service
AITO Auto - Key offerings
SWOT

15.5 Aston Martin Lagonda ltd.

Aston Martin Lagonda ltd. - Overview
Aston Martin Lagonda ltd. - Product / Service
Aston Martin Lagonda ltd. - Key offerings
SWOT

15.6 Bayerische Motoren Werke AG

Bayerische Motoren Werke AG - Overview
Bayerische Motoren Werke AG - Business segments
Bayerische Motoren Werke AG - Key offerings
Bayerische Motoren Werke AG - Segment focus
SWOT

15.7 BYD Co. Ltd.

BYD Co. Ltd. - Overview
BYD Co. Ltd. - Business segments
BYD Co. Ltd. - Key news
BYD Co. Ltd. - Key offerings
BYD Co. Ltd. - Segment focus
SWOT

15.8 Ferrari NV

Ferrari NV - Overview
Ferrari NV - Business segments
Ferrari NV - Key offerings
Ferrari NV - Segment focus
SWOT

15.9 General Motors Co.

General Motors Co. - Overview
General Motors Co. - Business segments
General Motors Co. - Key offerings
General Motors Co. - Segment focus
SWOT

15.10 Jaguar Land Rover

Jaguar Land Rover - Overview
Jaguar Land Rover - Product / Service
Jaguar Land Rover - Key offerings
SWOT

15.11 Lexus

Lexus - Overview
Lexus - Product / Service
Lexus - Key offerings
SWOT

15.12 Lincoln

Lincoln - Overview
Lincoln - Product / Service
Lincoln - Key offerings
SWOT

15.13 Lotus Cars Ltd.

Lotus Cars Ltd. - Overview
Lotus Cars Ltd. - Product / Service
Lotus Cars Ltd. - Key offerings
SWOT

15.14 Mercedes Benz Group AG

Mercedes Benz Group AG - Overview
Mercedes Benz Group AG - Business segments
Mercedes Benz Group AG - Key offerings
Mercedes Benz Group AG - Segment focus
SWOT

15.15 NIO Ltd.

NIO Ltd. - Overview
NIO Ltd. - Product / Service
NIO Ltd. - Key offerings
SWOT

15.16 Rivian Automotive Inc.

Rivian Automotive Inc. - Overview
Rivian Automotive Inc. - Product / Service
Rivian Automotive Inc. - Key offerings
SWOT

15.17 Stellantis NV

Stellantis NV - Overview
Stellantis NV - Business segments
Stellantis NV - Key news
Stellantis NV - Key offerings
Stellantis NV - Segment focus
SWOT

15.18 Volvo Car Corp.

Volvo Car Corp. - Overview
Volvo Car Corp. - Product / Service
Volvo Car Corp. - Key offerings
SWOT

16. Appendix

16.1 Scope of the report

Market definition
Objectives
Notes and caveats

16.2 Inclusions and exclusions checklist

Inclusions checklist
Exclusions checklist

16.3 Currency conversion rates for US$

16.4 Research methodology

16.5 Data procurement

Information sources

16.6 Data validation

16.7 Validation techniques employed for market sizing

16.8 Data synthesis

16.9 360 degree market analysis

16.10 List of abbreviations

Research Methodology

Technavio presents a detailed picture of the market by way of study, synthesis, and summation of data from multiple sources. The analysts have presented the various facets of the market with a particular focus on identifying the key industry influencers. The data thus presented is comprehensive, reliable, and the result of extensive research, both primary and secondary.

INFORMATION SOURCES

Primary sources

  • Manufacturers and suppliers
  • Channel partners
  • Industry experts
  • Strategic decision makers

Secondary sources

  • Industry journals and periodicals
  • Government data
  • Financial reports of key industry players
  • Historical data
  • Press releases

DATA ANALYSIS

Data Synthesis

  • Collation of data
  • Estimation of key figures
  • Analysis of derived insights

Data Validation

  • Triangulation with data models
  • Reference against proprietary databases
  • Corroboration with industry experts

REPORT WRITING

Qualitative

  • Market drivers
  • Market challenges
  • Market trends
  • Five forces analysis

Quantitative

  • Market size and forecast
  • Market segmentation
  • Geographical insights
  • Competitive landscape

Interested in this report?

Get your sample now to see our research methodology and insights!

Download Now

Frequently Asked Questions

Luxury Suv market growth will increase by USD 45234.2 million during 2026-2030.

The Luxury Suv market is expected to grow at a CAGR of 12.5% during 2026-2030.

Luxury Suv market is segmented by Application (Individual, Commercial) Type (Mid-size luxury SUVs, Full-size luxury SUVs) Vehicle type (ICE, Electric, Hybrid)

ACURA, AITO Auto, Aston Martin Lagonda ltd., Bayerische Motoren Werke AG, BYD Co. Ltd., FAW Group Corp, Ferrari NV, General Motors Co., Genesis, Infiniti Motor Co, Jaguar Land Rover, Lexus, Lincoln, Lotus Cars Ltd., Mercedes Benz Group AG, NIO Ltd., Rivian Automotive Inc., Stellantis NV, Volvo Car Corp. are a few of the key vendors in the Luxury Suv market.

North America will register the highest growth rate of 45.4% among the other regions. Therefore, the Luxury Suv market in North America is expected to garner significant business opportunities for the vendors during the forecast period.

US, Canada, Mexico, Germany, UK, France, Italy, Spain, The Netherlands, China, Japan, India, South Korea, Australia, Indonesia, Brazil, Argentina, Chile, Saudi Arabia, UAE, South Africa, Turkey, Israel

  • Acceleration of electrification and sustainable engineering powertrains is the driving factor this market.

The Luxury Suv market vendors should focus on grabbing business opportunities from the Application segment as it accounted for the largest market share in the base year.
RIA - Research AI Assistant
Ask RIA
