
Magnetic Beads Market Analysis, Size, and Forecast 2026-2030: North America (US, Canada, and Mexico), Europe (Germany, UK, and France), Asia (China, Japan, and India), South America (Brazil, Argentina, and Chile), Middle East and Africa (Saudi Arabia, UAE, and Israel), Rest of World (ROW)

Magnetic Beads Market Analysis, Size, and Forecast 2026-2030:
North America (US, Canada, and Mexico), Europe (Germany, UK, and France), Asia (China, Japan, and India), South America (Brazil, Argentina, and Chile), Middle East and Africa (Saudi Arabia, UAE, and Israel), Rest of World (ROW)

Published: Oct 2026 291 Pages SKU: IRTNTR71370

Market Overview at a Glance

$2.21 B
Market Opportunity
11.5%
CAGR 2025 - 2030
37%
North America Growth
$1.30 B
Cell separation segment 2024

Magnetic Beads Market Size 2026-2030

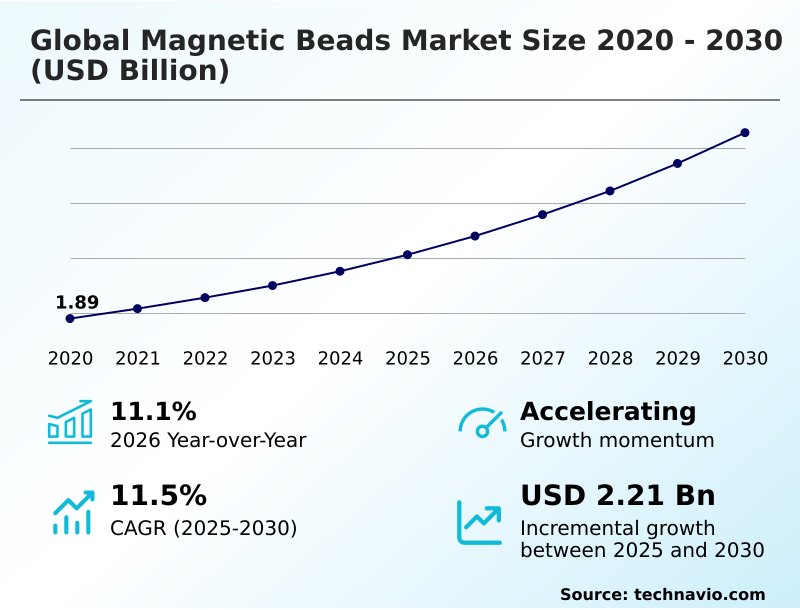
The magnetic beads market size is valued to increase by USD 2.21 billion, at a CAGR of 11.5% from 2025 to 2030. Rising demand for molecular diagnostics and personalized medicine will drive the magnetic beads market.

Major Market Trends & Insights

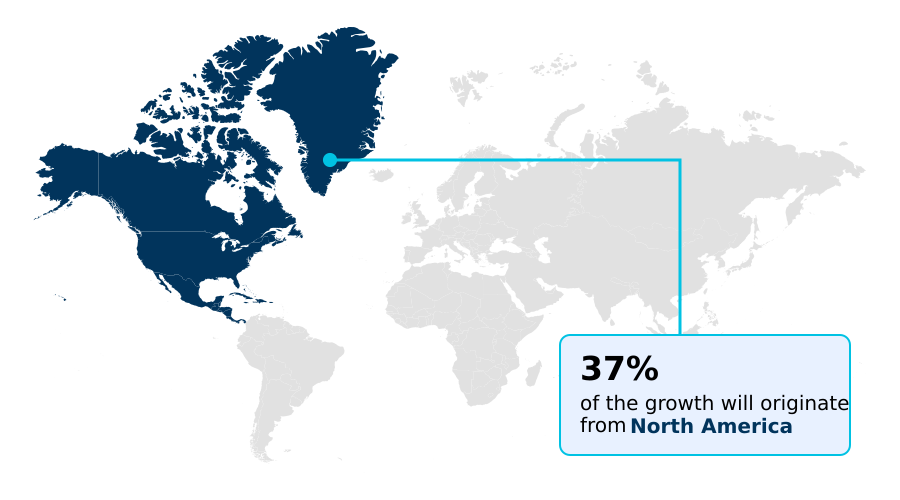
  • North America dominated the market and accounted for a 37% growth during the forecast period.
  • By Application - Cell separation segment was valued at USD 1.30 billion in 2024
  • By Type - Ferrimagnetic segment accounted for the largest market revenue share in 2024

Market Size & Forecast

  • Market Opportunities: USD 3.37 billion
  • Market Future Opportunities: USD 2.21 billion
  • CAGR from 2025 to 2030 : 11.5%

Market Summary

  • The Magnetic Beads Market demonstrates robust operational expansion driven by the critical need for scalable, high-purity biological separation techniques. The transition toward precision healthcare acts as a primary catalyst, as laboratories require advanced functionalized particles to isolate specific genetic materials with unparalleled accuracy. Consequently, this shift enables faster turnaround times for targeted therapeutic developments.
  • A major business scenario involves supply chain consolidation, where diagnostic network operators standardize their extraction protocols utilizing pre-calibrated superparamagnetic reagents. By implementing these automated workflows, clinical facilities achieve a 40% reduction in manual pipetting errors, significantly improving batch consistency. However, substantial capital expenditure required to integrate high-throughput robotic liquid handlers restricts adoption among smaller diagnostic centers.
  • This financial barrier limits technological penetration in resource-constrained environments, forcing them to rely on slower centrifugation methods. Despite these constraints, the integration of continuous-flow bioseparation systems enhances large-scale manufacturing efficiency. Automated sample processing fundamentally improves output quality and operational compliance, making reliable magnetic extraction an indispensable asset across modern molecular pathology and commercial biopharmaceutical facilities.

What will be the Size of the Magnetic Beads Market during the forecast period?
Get Key Insights on Market Forecast (PDF) Get Free Sample

How is the Magnetic Beads Market Segmented?

The magnetic beads industry research report provides comprehensive data (region-wise segment analysis), with forecasts and estimates in "USD million" for the period 2026-2030, as well as historical data from 2020-2024 for the following segments.

  • Application
    • Cell separation
    • IVD assay development
    • Others
  • Type
    • Ferrimagnetic
    • Superparamagnetic
  • End-user
    • In-vitro diagnostics
    • Bioresearch
    • Others
  • Geography
    • North America
      • US
      • Canada
      • Mexico
    • Europe
      • Germany
      • UK
      • France
      • Italy
      • Spain
      • The Netherlands
    • Asia
      • China
      • Japan
      • India
      • South Korea
      • Taiwan
      • Singapore
    • Rest of World (ROW)

By Application Insights

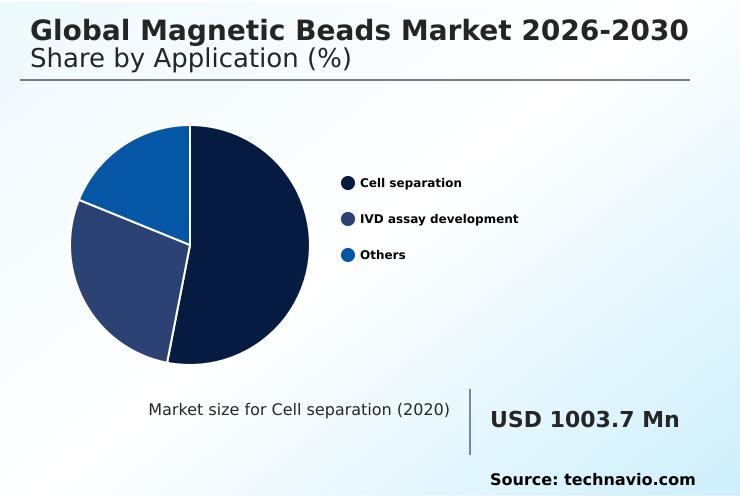
The cell separation segment is estimated to witness significant growth during the forecast period.

Cell separation methodology dictates the operational efficiency of advanced translational immunology and oncology research workflows. Utilizing superparamagnetic particles enables laboratories to bypass the mechanical shear stress associated with conventional centrifuges, directly boosting isolated cell viability.

As immunomagnetic cell separation replaces older techniques, facilities note a 15% improvement in structural integrity for rare cell populations. This shift happens because highly specific monoclonal antibodies bind securely to target antigens without altering the cell state.

Consequently, the preparation of materials for chimeric antigen receptor workflows becomes significantly more consistent. Researchers leveraging these refined techniques in structural biology investigations and synthetic biology observe reduced background interference.

By streamlining the initial isolation phase, laboratories effectively accelerate the purification of recombinant fusion proteins, ensuring reproducible purity across multiple experimental batches.
Get Free Sample

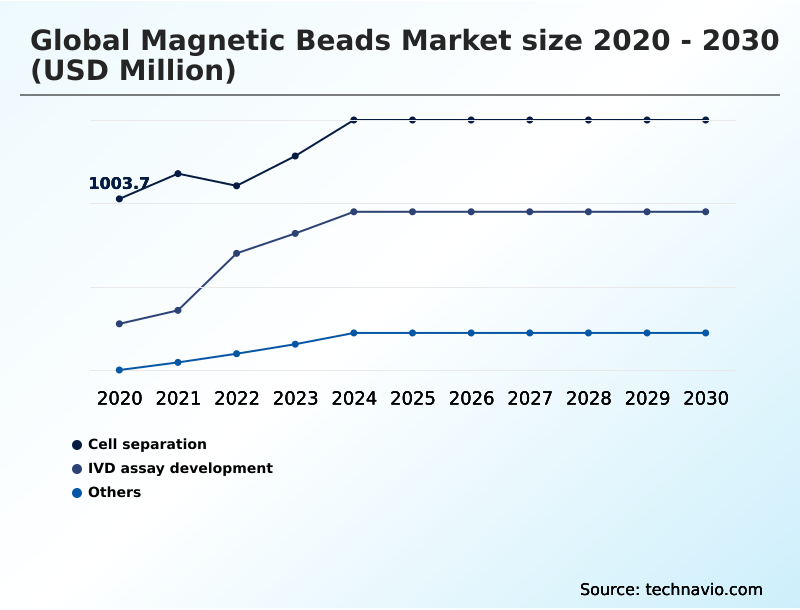
The Cell separation segment was valued at USD 1.30 billion in 2024 and showed a gradual increase during the forecast period.
Get Free Sample

Regional Analysis

North America is estimated to contribute 37% to the growth of the global market during the forecast period.Technavio’s analysts have elaborately explained the regional trends and drivers that shape the market during the forecast period.
See How Magnetic Beads Market Demand is Rising in North America Get Free Sample

Regional adoption of separation technologies illustrates stark operational differences driven by clinical infrastructure and regulatory maturity.

North America leads the transition by aggressively integrating automated recombinant protein purification systems, achieving a 35% higher processing efficiency compared to similar facilities in Europe.

This acceleration happens because extensive funding supports immediate integration of advanced spatial transcriptomics methodologies within primary research hubs.

Conversely, European laboratories focus heavily on standardizing in vitro diagnostics and chemiluminescent immunoassays to meet stringent new compliance mandates, resulting in a 20% reduction in consumable waste through optimized regenerative biomanufacturing protocols.

In APAC, rapid urbanization necessitates decentralized environmental pathogen surveillance, increasing the reliance on portable biomolecular separation tools. By shifting toward enzyme linked immunosorbent tests that require less capital infrastructure, emerging markets increase their testing penetration by 40%.

These geographic variations force suppliers to adapt their distribution strategies, balancing high-capacity automated solutions in established regions against flexible, cost-effective assays tailored for rapidly developing healthcare networks.

Market Dynamics

Our researchers analyzed the data with 2025 as the base year, along with the key drivers, trends, and challenges. A holistic analysis of drivers will help companies refine their marketing strategies to gain a competitive advantage.

  • The continuous evolution of diagnostic methodologies heavily relies on the optimization of automated sample preparation robotic platforms. By standardizing these sophisticated liquid handling workflows, modern laboratories consistently achieve the high yield extraction of nucleic acids from highly complex biological matrices. This operational shift fundamentally enhances the reliability of downstream genomic sequencing and targeted molecular profiling.
  • Implementing superparamagnetic microspheres for diagnostic assays allows clinical facilities to significantly reduce background interference and limit non-specific binding. Consequently, diagnostic networks experience a 25% improvement in test accuracy compared to traditional filtration techniques, directly translating into better compliance and more predictable operational planning.
  • Furthermore, the industry's transition toward closed system automated magnetic separation ensures superior sterility and minimizes cross-contamination risks during critical bioprocessing phases. This structural upgrade addresses the stringent regulatory mandates governing therapeutic manufacturing. At an industrial scale, the integration of continuous flow industrial bioseparation systems facilitates the rapid processing of large-volume cell cultures.
  • By replacing batch-centric centrifugation with continuous magnetic isolation, biomanufacturing plants effectively lower their overall processing cycle times by up to 30%. This streamlined approach optimizes the supply chain by accelerating raw material conversion into purified therapeutic assets.
  • Ultimately, the strategic deployment of advanced functionalized matrices ensures that both diagnostic and commercial production environments maintain maximum efficiency, robust quality control, and scalable output capacity.
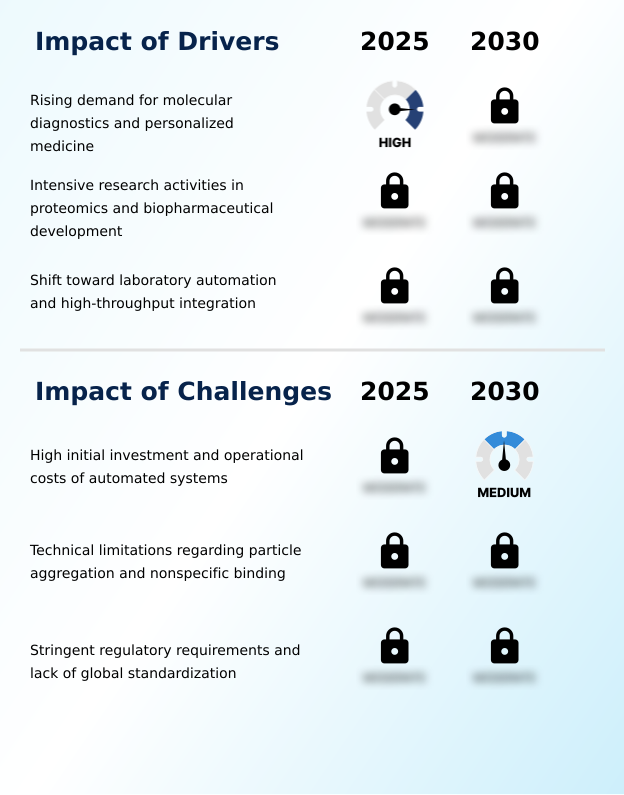
What are the key market drivers leading to the rise in the adoption of Magnetic Beads Industry?

  • The escalating demand for molecular diagnostics and targeted personalized medicine continues to act as a primary catalyst for industry expansion.

  • The escalating demand for high-throughput genomic research fundamentally drives the aggressive deployment of specialized separation matrices. As analytical facilities process higher volumes of complex biological samples, the manual isolation of genetic material becomes a critical operational bottleneck.
  • This bottleneck forces commercial laboratories to implement automated liquid handling platforms, directly improving workflow scalability. Consequently, facilities utilizing advanced biomagnetic separation methods report a 40% decrease in processing errors compared to traditional column-based protocols.
  • The necessity for pristine nucleic acid extraction ensures that downstream next generation sequencing generates reliable and reproducible data. Integrating these robust systems directly enhances molecular pathology pipelines by standardizing the input quality required for sophisticated personalized medicine interventions.
  • By accelerating sample preparation, biopharmaceutical organizations increase their high throughput screening throughput by 20%, significantly expediting the discovery and validation of novel therapeutic targets.

What are the market trends shaping the Magnetic Beads Industry?

  • The strategic evolution of surface functionalization and ligand specificity represents a prominent trend shaping modern biochemical methodologies. This advancement significantly enhances the precision and binding affinity required for complex molecular diagnostic assays.

  • The integration of sophisticated microfluidic systems dictates the next phase of diagnostic miniaturization and automated testing. As healthcare networks shift toward decentralized operations, the reliance on lab on a chip devices directly accelerates the adoption of scalable isolation techniques. This architectural transition happens because traditional macro-scale centrifugation cannot support the physical constraints of portable testing equipment.
  • Consequently, point-of-care facilities utilizing targeted drug delivery protocols and rapid liquid biopsy assays achieve a 30% reduction in diagnostic turnaround time. The deployment of circulating tumor cells capture mechanisms within these compact platforms acts as highly efficient flow cytometry alternatives. By eliminating the need for bulky equipment, clinics optimize their capital expenditure and improve patient screening capacity by 25%.
  • Furthermore, multiplex biomarker screening enables the simultaneous detection of multiple analytes, ensuring that precision medicine tools deliver comprehensive profiling without requiring excessive reagent volumes.

What challenges does the Magnetic Beads Industry face during its growth?

  • Substantial initial capital requirements and the ongoing operational expenses associated with automated processing systems remain significant barriers to broader technological adoption.

  • Technical limitations concerning particle aggregation severely restrict the reproducible execution of complex biological assays. When delicate surface functionalization degrades during prolonged storage, particles clump together, directly reducing the available surface area for target binding. This structural failure disrupts critical cell therapy manufacturing workflows, where pristine isolation is mandatory for clinical success.
  • Consequently, laboratories utilizing degraded streptavidin coated beads experience a 25% drop in capture efficiency, heavily skewing analytical results. Managing the optimal magnetic susceptibility of these microparticles remains difficult, particularly when isolating specific proteins for protein protein interaction studies. To counteract non-specific binding, manufacturers employ negatively charged carboxyl groups, yet balancing this chemistry across diverse sample matrices prolongs assay validation.
  • These technical inconsistencies inflate developmental costs and actively delay strict diagnostic turnaround requirements, hindering the rapid deployment of targeted pathogen enrichment panels.

Exclusive Technavio Analysis on Customer Landscape

The magnetic beads market forecasting report includes the adoption lifecycle of the market, covering from the innovator’s stage to the laggard’s stage. It focuses on adoption rates in different regions based on penetration. Furthermore, the magnetic beads market report also includes key purchase criteria and drivers of price sensitivity to help companies evaluate and develop their market growth analysis strategies.
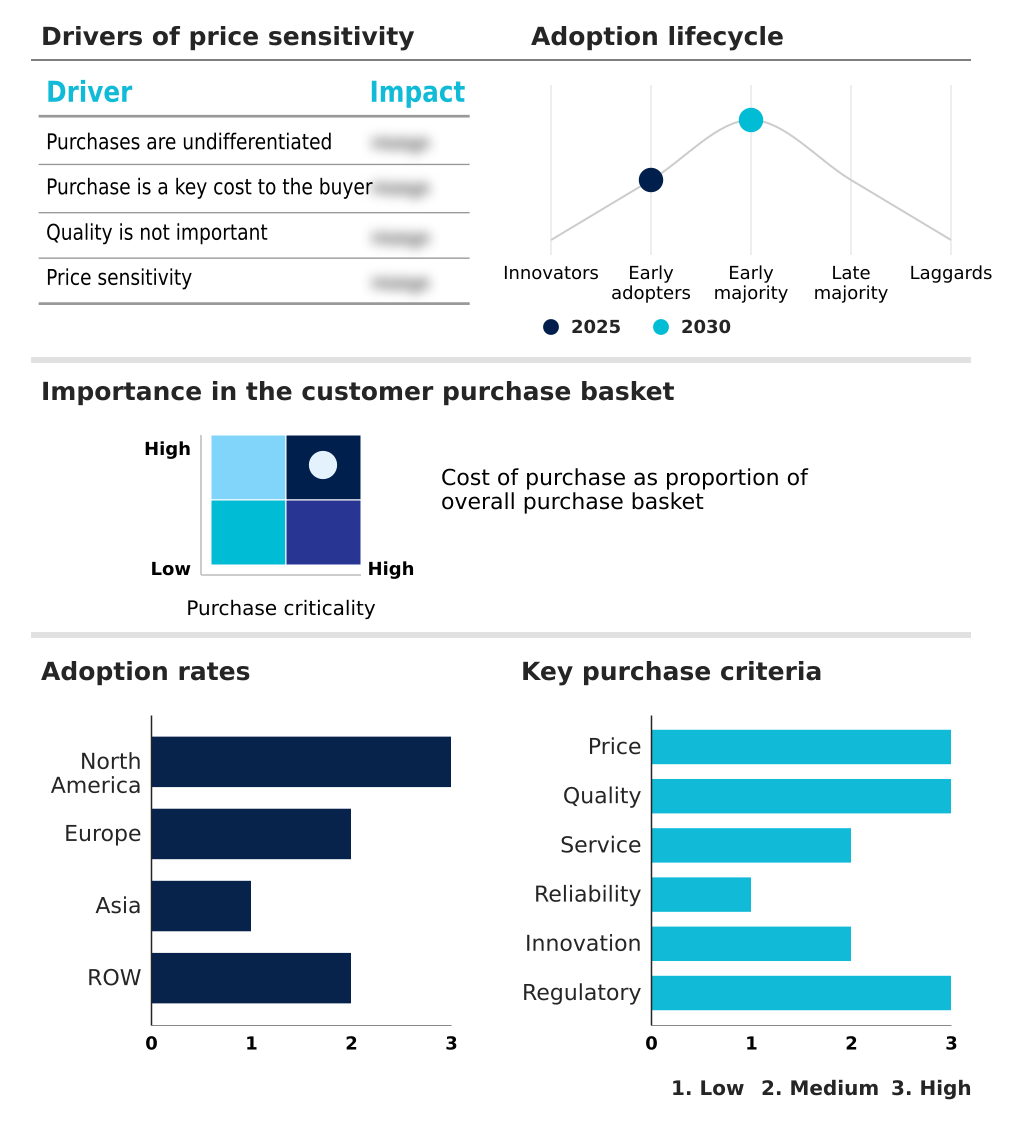
Customer Landscape of Magnetic Beads Industry

Competitive Landscape

Companies are implementing various strategies, such as strategic alliances, magnetic beads market forecast, partnerships, mergers and acquisitions, geographical expansion, and product/service launches, to enhance their presence in the industry.

ABclonal Technology Co. Ltd. - The provider delivers functionalized magnetic microspheres and specialized separation reagents designed to optimize high-throughput nucleic acid extraction and automated clinical diagnostic workflows across advanced laboratory environments.

The industry research and growth report includes detailed analyses of the competitive landscape of the market and information about key companies, including:

  • ABclonal Technology Co. Ltd.
  • Bangs Laboratories Inc.
  • Beckman Coulter Inc.
  • Bio Rad Laboratories Inc.
  • Bioneer Corp.
  • Creative Diagnostics
  • Cytiva
  • F. Hoffmann La Roche Ltd.
  • GenScript Biotech Corp.
  • JSR Life Sciences LLC
  • LGC Biosearch Technologies
  • MagBio Genomics Inc.
  • micromod Partikeltechnologie
  • Miltenyi Biotec BV and Co. KG
  • New England Biolabs Inc.
  • Promega Corp.
  • QIAGEN N.V.
  • Revvity Inc.
  • Sigma Aldrich Chemicals Ltd.
  • Thermo Fisher Scientific Inc.

Qualitative and quantitative analysis of companies has been conducted to help clients understand the wider business environment as well as the strengths and weaknesses of key industry players. Data is qualitatively analyzed to categorize companies as pure play, category-focused, industry-focused, and diversified; it is quantitatively analyzed to categorize companies as dominant, leading, strong, tentative, and weak.

Recent Development and News in Magnetic beads market

  • In the Biotechnology industry, the widespread transition toward automated spatial transcriptomics platforms has standardized high-throughput cellular profiling, directly impacting Magnetic Beads demand by requiring highly uniform paramagnetic matrices for precise messenger ribonucleic acid capture.
  • Stringent clinical mandates for current Good Manufacturing Practice compliance in ex vivo cell expansion have accelerated the adoption of closed-system bioprocess automation, driving the consumption of clinical-grade magnetic extraction reagents for sterile immune cell isolation.
  • The rapid integration of additive manufacturing techniques into lab on a chip device fabrication has miniaturized diagnostic fluidics, propelling the need for nanoscale magnetic substrates capable of non-contact manipulation within narrow capillary channels.
  • Elevated regulatory thresholds under the European In Vitro Diagnostic Medical Devices Regulation have mandated rigorous traceability for molecular pathology pipelines, forcing assay developers to standardize on highly reproducible surface-functionalized particles that reduce batch-to-batch diagnostic variability by over 20% within the Global Magnetic Beads Market 2026-2030.

Dive into Technavio’s robust research methodology, blending expert interviews, extensive data synthesis, and validated models for unparalleled Magnetic Beads Market insights. See full methodology.

Market Scope
Page number 291
Base year 2025
Historic period 2020-2024
Forecast period 2026-2030
Growth momentum & CAGR Accelerate at a CAGR of 11.5%
Market growth 2026-2030 USD 2211.0 million
Market structure Fragmented
YoY growth 2025-2026(%) 11.1%
Key countries US, Canada, Mexico, Germany, UK, France, Italy, Spain, The Netherlands, China, Japan, India, South Korea, Taiwan, Singapore, Brazil, Saudi Arabia, UAE, Israel, South Africa, Turkey, Argentina and Chile
Competitive landscape Leading Companies, Market Positioning of Companies, Competitive Strategies, and Industry Risks

Request Free Sample

Research Analyst Overview

  • The continuous refinement of diagnostic infrastructure relies on the precise integration of functionalized separation matrices. Innovations in surface functionalization directly influence corporate product strategy by enabling more specific binding affinities in complex biological samples. This strategic shift is crucial for optimizing liquid biopsy assays, where diagnostic developers achieve a 30% reduction in false-positive rates.
  • Such measurable improvements in analytical accuracy dictate budgeting decisions, as hospital networks allocate more capital toward automated liquid handling infrastructure to replace manual processing protocols. The inherent magnetic susceptibility of these engineered particles guarantees rapid resuspension and minimal aggregation, ensuring seamless compatibility with high-throughput microfluidic systems.
  • Because highly calibrated microspheres streamline the isolation workflow, testing facilities enhance their overall throughput capacity without expanding their physical footprint. Furthermore, the transition toward highly standardized next generation sequencing prep workflows relies entirely on robust nucleic acid extraction performance.
  • Standardizing these methodologies fundamentally elevates operational compliance, ensuring that laboratory outputs meet the rigorous precision benchmarks required by modern medical and environmental screening frameworks.

What are the Key Data Covered in this Magnetic Beads Market Research and Growth Report?

  • What is the expected growth of the Magnetic Beads Market between 2026 and 2030?

    • USD 2.21 billion, at a CAGR of 11.5%

  • What segmentation does the market report cover?

    • The report is segmented by Application (Cell separation, IVD assay development, and Others), Type (Ferrimagnetic, and Superparamagnetic), End-user (In-vitro diagnostics, Bioresearch, and Others) and Geography (North America, Europe, Asia, Rest of World (ROW))

  • Which regions are analyzed in the report?

    • North America, Europe, Asia and Rest of World (ROW)

  • What are the key growth drivers and market challenges?

    • Rising demand for molecular diagnostics and personalized medicine, High initial investment and operational costs of automated systems

  • Who are the major players in the Magnetic Beads Market?

    • ABclonal Technology Co. Ltd., Bangs Laboratories Inc., Beckman Coulter Inc., Bio Rad Laboratories Inc., Bioneer Corp., Creative Diagnostics, Cytiva, F. Hoffmann La Roche Ltd., GenScript Biotech Corp., JSR Life Sciences LLC, LGC Biosearch Technologies, MagBio Genomics Inc., micromod Partikeltechnologie, Miltenyi Biotec BV and Co. KG, New England Biolabs Inc., Promega Corp., QIAGEN N.V., Revvity Inc., Sigma Aldrich Chemicals Ltd. and Thermo Fisher Scientific Inc.

Market Research Insights

  • The adoption of advanced separation technologies fundamentally reshapes the operational capabilities of modern biological research and commercial biomanufacturing. Integrating sophisticated precision medicine tools drives a 25% improvement in diagnostic accuracy for molecular pathology pipelines. As facilities transition toward decentralized testing, the implementation of lab on a chip devices reduces assay processing times by up to 30%, directly lowering overhead costs.
  • Furthermore, targeted drug delivery research utilizes these highly stable matrices to enhance compound encapsulation, increasing payload retention efficiency by 15%. This structural shift optimizes resource allocation and regulatory compliance across diverse testing environments, solidifying the role of functionalized extraction methodologies in sustaining high throughput screening operations globally.

We can help! Our analysts can customize this magnetic beads market research report to meet your requirements.

Get in touch

1. Executive Summary

1.1 Market overview

Executive Summary - Chart on Market Overview
Executive Summary - Data Table on Market Overview
Executive Summary - Chart on Global Market Characteristics
Executive Summary - Chart on Market by Geography
Executive Summary - Chart on Market Segmentation by Application
Executive Summary - Chart on Market Segmentation by Type
Executive Summary - Chart on Market Segmentation by End-user
Executive Summary - Chart on Incremental Growth
Executive Summary - Data Table on Incremental Growth
Executive Summary - Chart on Company Market Positioning

2. Technavio Analysis

2.1 Analysis of price sensitivity, lifecycle, customer purchase basket, adoption rates, and purchase criteria

2.2 Criticality of inputs and Factors of differentiation

Chart on Overview on criticality of inputs and factors of differentiation

2.3 Factors of disruption

Chart on Overview on factors of disruption

2.4 Impact of drivers and challenges

Chart on Impact of drivers and challenges in 2025 and 2030

3. Market Landscape

3.1 Market ecosystem

Chart on Parent Market
Data Table on - Parent Market

3.2 Market characteristics

Chart on Market characteristics analysis

3.3 Value chain analysis

Chart on Value chain analysis

4. Market Sizing

4.1 Market definition

Data Table on Offerings of companies included in the market definition

4.2 Market segment analysis

Market segments

4.3 Market size 2025

4.4 Market outlook: Forecast for 2025-2030

Chart on Global - Market size and forecast 2025-2030 ($ million)
Data Table on Global - Market size and forecast 2025-2030 ($ million)
Chart on Global Market: Year-over-year growth 2025-2030 (%)
Data Table on Global Market: Year-over-year growth 2025-2030 (%)

5. Historic Market Size

5.1 Global Magnetic Beads Market 2020 - 2024

Historic Market Size - Data Table on Global Magnetic Beads Market 2020 - 2024 ($ million)

5.2 Application segment analysis 2020 - 2024

Historic Market Size - Application Segment 2020 - 2024 ($ million)

5.3 Type segment analysis 2020 - 2024

Historic Market Size - Type Segment 2020 - 2024 ($ million)

5.4 End-user segment analysis 2020 - 2024

Historic Market Size - End-user Segment 2020 - 2024 ($ million)

5.5 Geography segment analysis 2020 - 2024

Historic Market Size - Geography Segment 2020 - 2024 ($ million)

5.6 Country segment analysis 2020 - 2024

Historic Market Size - Country Segment 2020 - 2024 ($ million)

6. Qualitative Analysis

6.1 Impact of AI on Global Magnetic Beads Market

6.2 Impact of Geopolitical Conflicts on Global Magnetic Beads Market

7. Five Forces Analysis

7.1 Five forces summary

Five forces analysis - Comparison between 2025 and 2030

7.2 Bargaining power of buyers

Bargaining power of buyers - Impact of key factors 2025 and 2030

7.3 Bargaining power of suppliers

Bargaining power of suppliers - Impact of key factors in 2025 and 2030

7.4 Threat of new entrants

Threat of new entrants - Impact of key factors in 2025 and 2030

7.5 Threat of substitutes

Threat of substitutes - Impact of key factors in 2025 and 2030

7.6 Threat of rivalry

Threat of rivalry - Impact of key factors in 2025 and 2030

7.7 Market condition

Chart on Market condition - Five forces 2025 and 2030

8. Market Segmentation by Application

8.1 Market segments

Chart on Application - Market share 2025-2030 (%)
Data Table on Application - Market share 2025-2030 (%)

8.2 Comparison by Application

Chart on Comparison by Application
Data Table on Comparison by Application

8.3 Cell separation - Market size and forecast 2025-2030

Chart on Cell separation - Market size and forecast 2025-2030 ($ million)
Data Table on Cell separation - Market size and forecast 2025-2030 ($ million)
Chart on Cell separation - Year-over-year growth 2025-2030 (%)
Data Table on Cell separation - Year-over-year growth 2025-2030 (%)

8.4 IVD assay development - Market size and forecast 2025-2030

Chart on IVD assay development - Market size and forecast 2025-2030 ($ million)
Data Table on IVD assay development - Market size and forecast 2025-2030 ($ million)
Chart on IVD assay development - Year-over-year growth 2025-2030 (%)
Data Table on IVD assay development - Year-over-year growth 2025-2030 (%)

8.5 Others - Market size and forecast 2025-2030

Chart on Others - Market size and forecast 2025-2030 ($ million)
Data Table on Others - Market size and forecast 2025-2030 ($ million)
Chart on Others - Year-over-year growth 2025-2030 (%)
Data Table on Others - Year-over-year growth 2025-2030 (%)

8.6 Market opportunity by Application

Market opportunity by Application ($ million)
Data Table on Market opportunity by Application ($ million)

9. Market Segmentation by Type

9.1 Market segments

Chart on Type - Market share 2025-2030 (%)
Data Table on Type - Market share 2025-2030 (%)

9.2 Comparison by Type

Chart on Comparison by Type
Data Table on Comparison by Type

9.3 Ferrimagnetic - Market size and forecast 2025-2030

Chart on Ferrimagnetic - Market size and forecast 2025-2030 ($ million)
Data Table on Ferrimagnetic - Market size and forecast 2025-2030 ($ million)
Chart on Ferrimagnetic - Year-over-year growth 2025-2030 (%)
Data Table on Ferrimagnetic - Year-over-year growth 2025-2030 (%)

9.4 Superparamagnetic - Market size and forecast 2025-2030

Chart on Superparamagnetic - Market size and forecast 2025-2030 ($ million)
Data Table on Superparamagnetic - Market size and forecast 2025-2030 ($ million)
Chart on Superparamagnetic - Year-over-year growth 2025-2030 (%)
Data Table on Superparamagnetic - Year-over-year growth 2025-2030 (%)

9.5 Market opportunity by Type

Market opportunity by Type ($ million)
Data Table on Market opportunity by Type ($ million)

10. Market Segmentation by End-user

10.1 Market segments

Chart on End-user - Market share 2025-2030 (%)
Data Table on End-user - Market share 2025-2030 (%)

10.2 Comparison by End-user

Chart on Comparison by End-user
Data Table on Comparison by End-user

10.3 In-vitro diagnostics - Market size and forecast 2025-2030

Chart on In-vitro diagnostics - Market size and forecast 2025-2030 ($ million)
Data Table on In-vitro diagnostics - Market size and forecast 2025-2030 ($ million)
Chart on In-vitro diagnostics - Year-over-year growth 2025-2030 (%)
Data Table on In-vitro diagnostics - Year-over-year growth 2025-2030 (%)

10.4 Bioresearch - Market size and forecast 2025-2030

Chart on Bioresearch - Market size and forecast 2025-2030 ($ million)
Data Table on Bioresearch - Market size and forecast 2025-2030 ($ million)
Chart on Bioresearch - Year-over-year growth 2025-2030 (%)
Data Table on Bioresearch - Year-over-year growth 2025-2030 (%)

10.5 Others - Market size and forecast 2025-2030

Chart on Others - Market size and forecast 2025-2030 ($ million)
Data Table on Others - Market size and forecast 2025-2030 ($ million)
Chart on Others - Year-over-year growth 2025-2030 (%)
Data Table on Others - Year-over-year growth 2025-2030 (%)

10.6 Market opportunity by End-user

Market opportunity by End-user ($ million)
Data Table on Market opportunity by End-user ($ million)

11. Customer Landscape

11.1 Customer landscape overview

Analysis of price sensitivity, lifecycle, customer purchase basket, adoption rates, and purchase criteria

12. Geographic Landscape

12.1 Geographic segmentation

Chart on Market share by geography 2025-2030 (%)
Data Table on Market share by geography 2025-2030 (%)

12.2 Geographic comparison

Chart on Geographic comparison
Data Table on Geographic comparison

12.3 North America - Market size and forecast 2025-2030

Chart on North America - Market size and forecast 2025-2030 ($ million)
Data Table on North America - Market size and forecast 2025-2030 ($ million)
Chart on North America - Year-over-year growth 2025-2030 (%)
Data Table on North America - Year-over-year growth 2025-2030 (%)
Chart on Regional Comparison - North America
Data Table on Regional Comparison - North America

12.3.1 US - Market size and forecast 2025-2030

Chart on US - Market size and forecast 2025-2030 ($ million)
Data Table on US - Market size and forecast 2025-2030 ($ million)
Chart on US - Year-over-year growth 2025-2030 (%)
Data Table on US - Year-over-year growth 2025-2030 (%)

12.3.2 Canada - Market size and forecast 2025-2030

Chart on Canada - Market size and forecast 2025-2030 ($ million)
Data Table on Canada - Market size and forecast 2025-2030 ($ million)
Chart on Canada - Year-over-year growth 2025-2030 (%)
Data Table on Canada - Year-over-year growth 2025-2030 (%)

12.3.3 Mexico - Market size and forecast 2025-2030

Chart on Mexico - Market size and forecast 2025-2030 ($ million)
Data Table on Mexico - Market size and forecast 2025-2030 ($ million)
Chart on Mexico - Year-over-year growth 2025-2030 (%)
Data Table on Mexico - Year-over-year growth 2025-2030 (%)

12.4 Europe - Market size and forecast 2025-2030

Chart on Europe - Market size and forecast 2025-2030 ($ million)
Data Table on Europe - Market size and forecast 2025-2030 ($ million)
Chart on Europe - Year-over-year growth 2025-2030 (%)
Data Table on Europe - Year-over-year growth 2025-2030 (%)
Chart on Regional Comparison - Europe
Data Table on Regional Comparison - Europe

12.4.1 Germany - Market size and forecast 2025-2030

Chart on Germany - Market size and forecast 2025-2030 ($ million)
Data Table on Germany - Market size and forecast 2025-2030 ($ million)
Chart on Germany - Year-over-year growth 2025-2030 (%)
Data Table on Germany - Year-over-year growth 2025-2030 (%)

12.4.2 UK - Market size and forecast 2025-2030

Chart on UK - Market size and forecast 2025-2030 ($ million)
Data Table on UK - Market size and forecast 2025-2030 ($ million)
Chart on UK - Year-over-year growth 2025-2030 (%)
Data Table on UK - Year-over-year growth 2025-2030 (%)

12.4.3 France - Market size and forecast 2025-2030

Chart on France - Market size and forecast 2025-2030 ($ million)
Data Table on France - Market size and forecast 2025-2030 ($ million)
Chart on France - Year-over-year growth 2025-2030 (%)
Data Table on France - Year-over-year growth 2025-2030 (%)

12.4.4 Italy - Market size and forecast 2025-2030

Chart on Italy - Market size and forecast 2025-2030 ($ million)
Data Table on Italy - Market size and forecast 2025-2030 ($ million)
Chart on Italy - Year-over-year growth 2025-2030 (%)
Data Table on Italy - Year-over-year growth 2025-2030 (%)

12.4.5 Spain - Market size and forecast 2025-2030

Chart on Spain - Market size and forecast 2025-2030 ($ million)
Data Table on Spain - Market size and forecast 2025-2030 ($ million)
Chart on Spain - Year-over-year growth 2025-2030 (%)
Data Table on Spain - Year-over-year growth 2025-2030 (%)

12.4.6 The Netherlands - Market size and forecast 2025-2030

Chart on The Netherlands - Market size and forecast 2025-2030 ($ million)
Data Table on The Netherlands - Market size and forecast 2025-2030 ($ million)
Chart on The Netherlands - Year-over-year growth 2025-2030 (%)
Data Table on The Netherlands - Year-over-year growth 2025-2030 (%)

12.5 Asia - Market size and forecast 2025-2030

Chart on Asia - Market size and forecast 2025-2030 ($ million)
Data Table on Asia - Market size and forecast 2025-2030 ($ million)
Chart on Asia - Year-over-year growth 2025-2030 (%)
Data Table on Asia - Year-over-year growth 2025-2030 (%)
Chart on Regional Comparison - Asia
Data Table on Regional Comparison - Asia

12.5.1 China - Market size and forecast 2025-2030

Chart on China - Market size and forecast 2025-2030 ($ million)
Data Table on China - Market size and forecast 2025-2030 ($ million)
Chart on China - Year-over-year growth 2025-2030 (%)
Data Table on China - Year-over-year growth 2025-2030 (%)

12.5.2 Japan - Market size and forecast 2025-2030

Chart on Japan - Market size and forecast 2025-2030 ($ million)
Data Table on Japan - Market size and forecast 2025-2030 ($ million)
Chart on Japan - Year-over-year growth 2025-2030 (%)
Data Table on Japan - Year-over-year growth 2025-2030 (%)

12.5.3 India - Market size and forecast 2025-2030

Chart on India - Market size and forecast 2025-2030 ($ million)
Data Table on India - Market size and forecast 2025-2030 ($ million)
Chart on India - Year-over-year growth 2025-2030 (%)
Data Table on India - Year-over-year growth 2025-2030 (%)

12.5.4 South Korea - Market size and forecast 2025-2030

Chart on South Korea - Market size and forecast 2025-2030 ($ million)
Data Table on South Korea - Market size and forecast 2025-2030 ($ million)
Chart on South Korea - Year-over-year growth 2025-2030 (%)
Data Table on South Korea - Year-over-year growth 2025-2030 (%)

12.5.5 Taiwan - Market size and forecast 2025-2030

Chart on Taiwan - Market size and forecast 2025-2030 ($ million)
Data Table on Taiwan - Market size and forecast 2025-2030 ($ million)
Chart on Taiwan - Year-over-year growth 2025-2030 (%)
Data Table on Taiwan - Year-over-year growth 2025-2030 (%)

12.5.6 Singapore - Market size and forecast 2025-2030

Chart on Singapore - Market size and forecast 2025-2030 ($ million)
Data Table on Singapore - Market size and forecast 2025-2030 ($ million)
Chart on Singapore - Year-over-year growth 2025-2030 (%)
Data Table on Singapore - Year-over-year growth 2025-2030 (%)

12.6 Rest of World (ROW) - Market size and forecast 2025-2030

Chart on Rest of World (ROW) - Market size and forecast 2025-2030 ($ million)
Data Table on Rest of World (ROW) - Market size and forecast 2025-2030 ($ million)
Chart on Rest of World (ROW) - Year-over-year growth 2025-2030 (%)
Data Table on Rest of World (ROW) - Year-over-year growth 2025-2030 (%)
Chart on Regional Comparison - Rest of World (ROW)
Data Table on Regional Comparison - Rest of World (ROW)

12.6.1 Brazil - Market size and forecast 2025-2030

Chart on Brazil - Market size and forecast 2025-2030 ($ million)
Data Table on Brazil - Market size and forecast 2025-2030 ($ million)
Chart on Brazil - Year-over-year growth 2025-2030 (%)
Data Table on Brazil - Year-over-year growth 2025-2030 (%)

12.6.2 Saudi Arabia - Market size and forecast 2025-2030

Chart on Saudi Arabia - Market size and forecast 2025-2030 ($ million)
Data Table on Saudi Arabia - Market size and forecast 2025-2030 ($ million)
Chart on Saudi Arabia - Year-over-year growth 2025-2030 (%)
Data Table on Saudi Arabia - Year-over-year growth 2025-2030 (%)

12.6.3 UAE - Market size and forecast 2025-2030

Chart on UAE - Market size and forecast 2025-2030 ($ million)
Data Table on UAE - Market size and forecast 2025-2030 ($ million)
Chart on UAE - Year-over-year growth 2025-2030 (%)
Data Table on UAE - Year-over-year growth 2025-2030 (%)

12.6.4 Israel - Market size and forecast 2025-2030

Chart on Israel - Market size and forecast 2025-2030 ($ million)
Data Table on Israel - Market size and forecast 2025-2030 ($ million)
Chart on Israel - Year-over-year growth 2025-2030 (%)
Data Table on Israel - Year-over-year growth 2025-2030 (%)

12.6.5 South Africa - Market size and forecast 2025-2030

Chart on South Africa - Market size and forecast 2025-2030 ($ million)
Data Table on South Africa - Market size and forecast 2025-2030 ($ million)
Chart on South Africa - Year-over-year growth 2025-2030 (%)
Data Table on South Africa - Year-over-year growth 2025-2030 (%)

12.6.6 Turkey - Market size and forecast 2025-2030

Chart on Turkey - Market size and forecast 2025-2030 ($ million)
Data Table on Turkey - Market size and forecast 2025-2030 ($ million)
Chart on Turkey - Year-over-year growth 2025-2030 (%)
Data Table on Turkey - Year-over-year growth 2025-2030 (%)

12.6.7 Argentina - Market size and forecast 2025-2030

Chart on Argentina - Market size and forecast 2025-2030 ($ million)
Data Table on Argentina - Market size and forecast 2025-2030 ($ million)
Chart on Argentina - Year-over-year growth 2025-2030 (%)
Data Table on Argentina - Year-over-year growth 2025-2030 (%)

12.6.8 Chile - Market size and forecast 2025-2030

Chart on Chile - Market size and forecast 2025-2030 ($ million)
Data Table on Chile - Market size and forecast 2025-2030 ($ million)
Chart on Chile - Year-over-year growth 2025-2030 (%)
Data Table on Chile - Year-over-year growth 2025-2030 (%)

12.7 Market opportunity by geography

Market opportunity by geography ($ million)
Data Tables on Market opportunity by geography ($ million)

13. Drivers, Challenges, and Opportunity

13.1 Market drivers

Rising demand for molecular diagnostics and personalized medicine
Intensive research activities in proteomics and biopharmaceutical development
Shift toward laboratory automation and high-throughput integration

13.2 Market challenges

High initial investment and operational costs of automated systems
Technical limitations regarding particle aggregation and nonspecific binding
Stringent regulatory requirements and lack of global standardization

13.3 Impact of drivers and challenges

Impact of drivers and challenges in 2025 and 2030

13.4 Market opportunities

Strategic evolution of surface functionalization and ligand specificity
Integration of magnetic microparticles within microfluidic and point-of-care systems
Expansion of magnetic separation in cellular immunotherapy and rare cell isolation

14. Competitive Landscape

14.1 Overview

14.2

Overview on criticality of inputs and factors of differentiation

14.3 Landscape disruption

Overview on factors of disruption

14.4 Industry risks

Impact of key risks on business

15. Competitive Analysis

15.1 Companies profiled

Companies covered

15.2 Company ranking index

15.3 Market positioning of companies

Matrix on companies position and classification

15.4 Bangs Laboratories Inc.

Bangs Laboratories Inc. - Overview
Bangs Laboratories Inc. - Product / Service
Bangs Laboratories Inc. - Key offerings
SWOT

15.5 Beckman Coulter Inc.

Beckman Coulter Inc. - Overview
Beckman Coulter Inc. - Product / Service
Beckman Coulter Inc. - Key offerings
SWOT

15.6 Bio Rad Laboratories Inc.

Bio Rad Laboratories Inc. - Overview
Bio Rad Laboratories Inc. - Business segments
Bio Rad Laboratories Inc. - Key news
Bio Rad Laboratories Inc. - Key offerings
Bio Rad Laboratories Inc. - Segment focus
SWOT

15.7 Bioneer Corp.

Bioneer Corp. - Overview
Bioneer Corp. - Product / Service
Bioneer Corp. - Key offerings
SWOT

15.8 F. Hoffmann La Roche Ltd.

F. Hoffmann La Roche Ltd. - Overview
F. Hoffmann La Roche Ltd. - Business segments
F. Hoffmann La Roche Ltd. - Key news
F. Hoffmann La Roche Ltd. - Key offerings
F. Hoffmann La Roche Ltd. - Segment focus
SWOT

15.9 GenScript Biotech Corp.

GenScript Biotech Corp. - Overview
GenScript Biotech Corp. - Business segments
GenScript Biotech Corp. - Key offerings
GenScript Biotech Corp. - Segment focus
SWOT

15.10 JSR Life Sciences LLC

JSR Life Sciences LLC - Overview
JSR Life Sciences LLC - Product / Service
JSR Life Sciences LLC - Key offerings
SWOT

15.11 LGC Biosearch Technologies

LGC Biosearch Technologies - Overview
LGC Biosearch Technologies - Product / Service
LGC Biosearch Technologies - Key offerings
SWOT

15.12 Miltenyi Biotec BV and Co. KG

Miltenyi Biotec BV and Co. KG - Overview
Miltenyi Biotec BV and Co. KG - Product / Service
Miltenyi Biotec BV and Co. KG - Key offerings
SWOT

15.13 New England Biolabs Inc.

New England Biolabs Inc. - Overview
New England Biolabs Inc. - Product / Service
New England Biolabs Inc. - Key offerings
SWOT

15.14 Promega Corp.

Promega Corp. - Overview
Promega Corp. - Product / Service
Promega Corp. - Key offerings
SWOT

15.15 QIAGEN N.V.

QIAGEN N.V. - Overview
QIAGEN N.V. - Product / Service
QIAGEN N.V. - Key offerings
SWOT

15.16 Revvity Inc.

Revvity Inc. - Overview
Revvity Inc. - Business segments
Revvity Inc. - Key offerings
Revvity Inc. - Segment focus
SWOT

15.17 Sigma Aldrich Chemicals Ltd.

Sigma Aldrich Chemicals Ltd. - Overview
Sigma Aldrich Chemicals Ltd. - Product / Service
Sigma Aldrich Chemicals Ltd. - Key offerings
SWOT

15.18 Thermo Fisher Scientific Inc.

Thermo Fisher Scientific Inc. - Overview
Thermo Fisher Scientific Inc. - Business segments
Thermo Fisher Scientific Inc. - Key news
Thermo Fisher Scientific Inc. - Key offerings
Thermo Fisher Scientific Inc. - Segment focus
SWOT

16. Appendix

16.1 Scope of the report

Market definition
Objectives
Notes and caveats

16.2 Inclusions and exclusions checklist

Inclusions checklist
Exclusions checklist

16.3 Currency conversion rates for US$

16.4 Research methodology

16.5 Data procurement

Information sources

16.6 Data validation

16.7 Validation techniques employed for market sizing

16.8 Data synthesis

16.9 360 degree market analysis

16.10 List of abbreviations

Research Methodology

Technavio presents a detailed picture of the market by way of study, synthesis, and summation of data from multiple sources. The analysts have presented the various facets of the market with a particular focus on identifying the key industry influencers. The data thus presented is comprehensive, reliable, and the result of extensive research, both primary and secondary.

INFORMATION SOURCES

Primary sources

  • Manufacturers and suppliers
  • Channel partners
  • Industry experts
  • Strategic decision makers

Secondary sources

  • Industry journals and periodicals
  • Government data
  • Financial reports of key industry players
  • Historical data
  • Press releases

DATA ANALYSIS

Data Synthesis

  • Collation of data
  • Estimation of key figures
  • Analysis of derived insights

Data Validation

  • Triangulation with data models
  • Reference against proprietary databases
  • Corroboration with industry experts

REPORT WRITING

Qualitative

  • Market drivers
  • Market challenges
  • Market trends
  • Five forces analysis

Quantitative

  • Market size and forecast
  • Market segmentation
  • Geographical insights
  • Competitive landscape

Interested in this report?

Get your sample now to see our research methodology and insights!

Download Now

Frequently Asked Questions

Magnetic Beads market growth will increase by USD 2211.0 million during 2026-2030.

The Magnetic Beads market is expected to grow at a CAGR of 11.5% during 2026-2030.

Magnetic Beads market is segmented by Application (Cell separation, IVD assay development, Others) Type (Ferrimagnetic, Superparamagnetic) End-user (In-vitro diagnostics, Bioresearch, Others)

ABclonal Technology Co. Ltd., Bangs Laboratories Inc., Beckman Coulter Inc., Bio Rad Laboratories Inc., Bioneer Corp., Creative Diagnostics, Cytiva, F. Hoffmann La Roche Ltd., GenScript Biotech Corp., JSR Life Sciences LLC, LGC Biosearch Technologies, MagBio Genomics Inc., micromod Partikeltechnologie, Miltenyi Biotec BV and Co. KG, New England Biolabs Inc., Promega Corp., QIAGEN N.V., Revvity Inc., Sigma Aldrich Chemicals Ltd., Thermo Fisher Scientific Inc. are a few of the key vendors in the Magnetic Beads market.

North America will register the highest growth rate of 37% among the other regions. Therefore, the Magnetic Beads market in North America is expected to garner significant business opportunities for the vendors during the forecast period.

US, Canada, Mexico, Germany, UK, France, Italy, Spain, The Netherlands, China, Japan, India, South Korea, Taiwan, Singapore, Brazil, Saudi Arabia, UAE, Israel, South Africa, Turkey, Argentina, Chile

  • Rising demand for molecular diagnostics and personalized medicine is the driving factor this market.

The Magnetic Beads market vendors should focus on grabbing business opportunities from the Application segment as it accounted for the largest market share in the base year.
RIA - Research AI Assistant
Ask RIA
