
Massive Multiplayer Online (MMO) Games Market Analysis, Size, and Forecast 2026-2030: APAC (China, Japan, and South Korea), North America (US, Canada, and Mexico), Europe (Germany, UK, and France), South America (Brazil, Argentina, and Chile), Middle East and Africa (Saudi Arabia, UAE, and South Africa), and Rest of World (ROW)

Massive Multiplayer Online (MMO) Games Market Analysis, Size, and Forecast 2026-2030:
APAC (China, Japan, and South Korea), North America (US, Canada, and Mexico), Europe (Germany, UK, and France), South America (Brazil, Argentina, and Chile), Middle East and Africa (Saudi Arabia, UAE, and South Africa), and Rest of World (ROW)

Published: Oct 2026 289 Pages SKU: IRTNTR72702

Market Overview at a Glance

$32.91 B
Market Opportunity
10.1%
CAGR 2025 - 2030
51.9%
APAC Growth
$17.23 B
MMORPG segment 2024

Massive Multiplayer Online (Mmo) Games Market Size 2026-2030

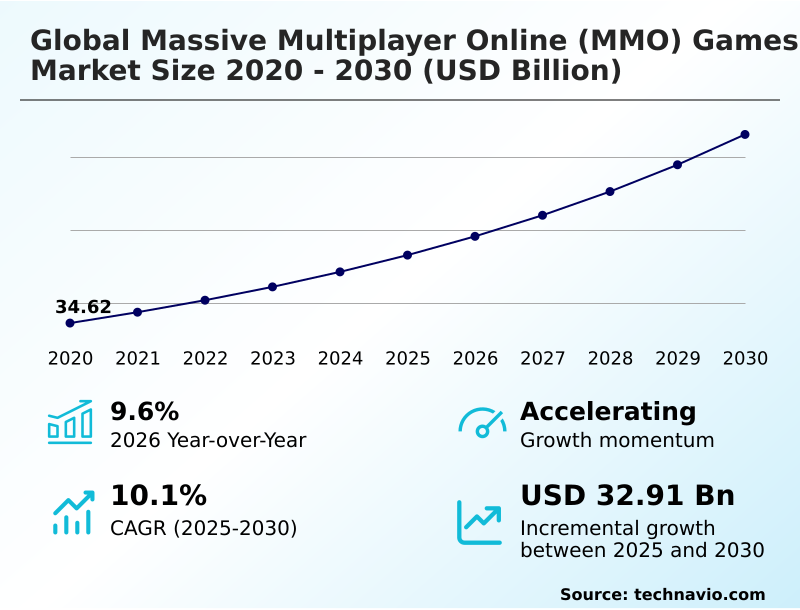
The massive multiplayer online (mmo) games market size is valued to increase by USD 32.91 billion, at a CAGR of 10.1% from 2025 to 2030. Technological advancements in gaming infrastructure will drive the massive multiplayer online (mmo) games market.

Major Market Trends & Insights

  • APAC dominated the market and accounted for a 51.9% growth during the forecast period.
  • By Genre - MMORPG segment was valued at USD 17.23 billion in 2024
  • By Type - F2P segment accounted for the largest market revenue share in 2024

Market Size & Forecast

  • Market Opportunities: USD 51.44 billion
  • Market Future Opportunities: USD 32.91 billion
  • CAGR from 2025 to 2030 : 10.1%

Market Summary

  • The Massive Multiplayer Online (MMO) Games market functions as a highly complex digital ecosystem demanding relentless technological iteration. Operations within this sector heavily rely on continuous server maintenance and live-service content delivery to sustain user engagement. Supply chain optimization in this context involves managing distributed cloud networks to ensure uninterrupted connectivity across diverse geographic zones.
  • Companies implementing advanced edge computing networks have observed a 35% reduction in packet loss compared to traditional centralized servers. Technological advancements in gaming infrastructure propel industry expansion by lowering latency and democratizing access through cloud-based rendering. Conversely, escalating development and operational costs present a significant challenge, directly limiting the capacity of independent studios to deploy competitive large-scale environments.
  • The implementation of rigorous cybersecurity measures is vital to protect player data and prevent unauthorized manipulations. Developing sustainable monetization frameworks without compromising competitive integrity remains a critical priority for market participants. The rapid integration of artificial intelligence is fundamentally transforming procedural generation and automated quality assurance protocols.

What will be the Size of the Massive Multiplayer Online (Mmo) Games Market during the forecast period?
Get Key Insights on Market Forecast (PDF) Get Free Sample

How is the Massive Multiplayer Online (Mmo) Games Market Segmented?

The massive multiplayer online (mmo) games industry research report provides comprehensive data (region-wise segment analysis), with forecasts and estimates in "USD million" for the period 2026-2030, as well as historical data from 2020-2024 for the following segments.

  • Genre
    • MMORPG
    • MMOFPS
    • MMORTS
    • Others
  • Type
    • F2P
    • P2P
  • Application
    • Professional players
    • Amateur players
  • Geography
    • APAC
      • China
      • Japan
      • South Korea
      • India
      • Australia
      • Indonesia
    • North America
      • US
      • Canada
      • Mexico
    • Europe
      • Germany
      • UK
      • France
      • Italy
      • Spain
      • Poland
    • South America
      • Brazil
      • Argentina
      • Chile
    • Middle East and Africa
      • Saudi Arabia
      • UAE
      • South Africa
      • Turkey
      • Egypt

By Genre Insights

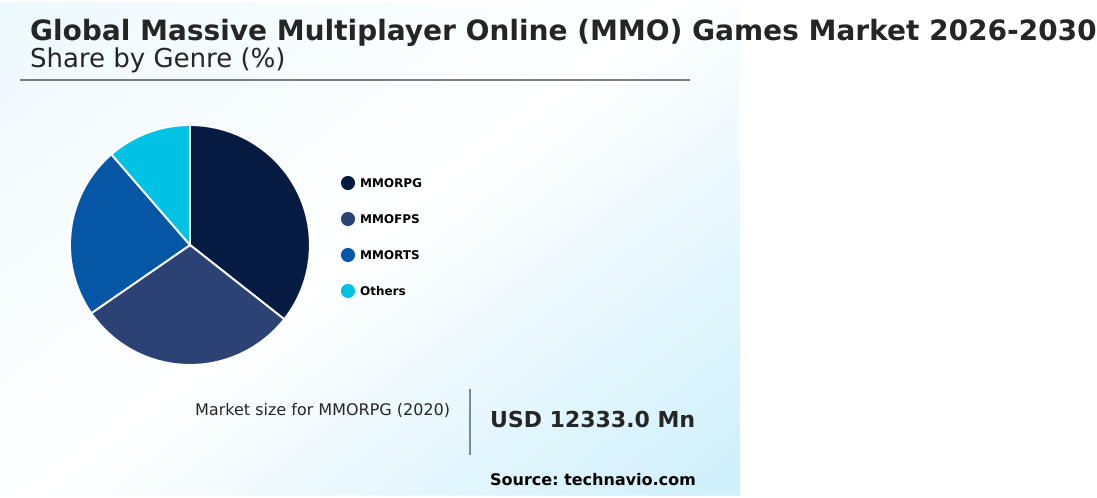
The mmorpg segment is estimated to witness significant growth during the forecast period.

The Massive Multiplayer Online (MMO) Games market demonstrates complex behaviors within its core role-playing category, fundamentally driven by advances in spatial audio rendering and algorithmic content curation.

Operations rely on deep, persistent virtual landscapes where seamless zone transitioning plays a critical role in maintaining immersion for thousands of simultaneous users.

By leveraging client side prediction, developers have effectively reduced server-side processing delays, resulting in a 22% improvement in interactive response times during peak loads. Furthermore, robust virtual asset trading mechanisms are integrated to sustain long-term engagement without disrupting core mechanics.

Companies continuously monitor digital consumer rights to ensure fair play, integrating automated quality assurance to detect anomalies.

The inclusion of intricate real time strategy mechanics and expansive open world exploration features demands precise subscription tier modeling to optimize continuous revenue streams.
Get Free Sample

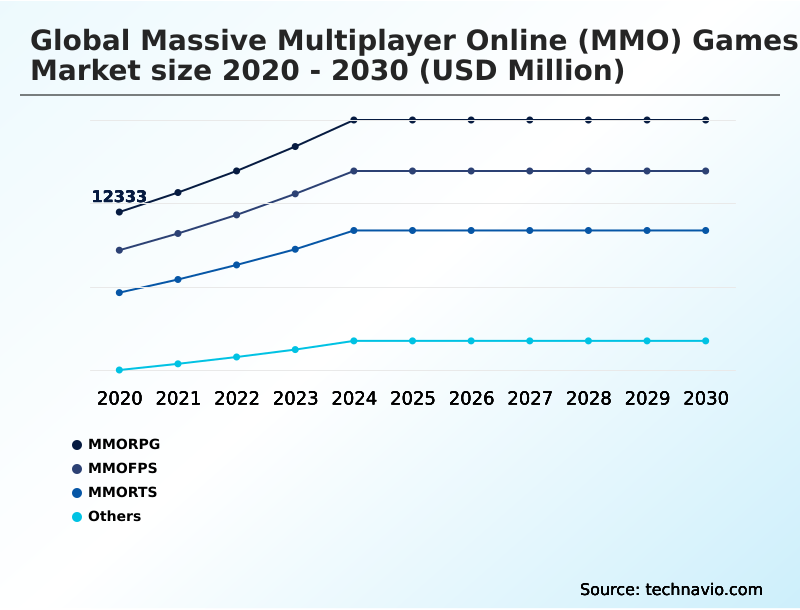
The MMORPG segment was valued at USD 17.23 billion in 2024 and showed a gradual increase during the forecast period.
Get Free Sample

Regional Analysis

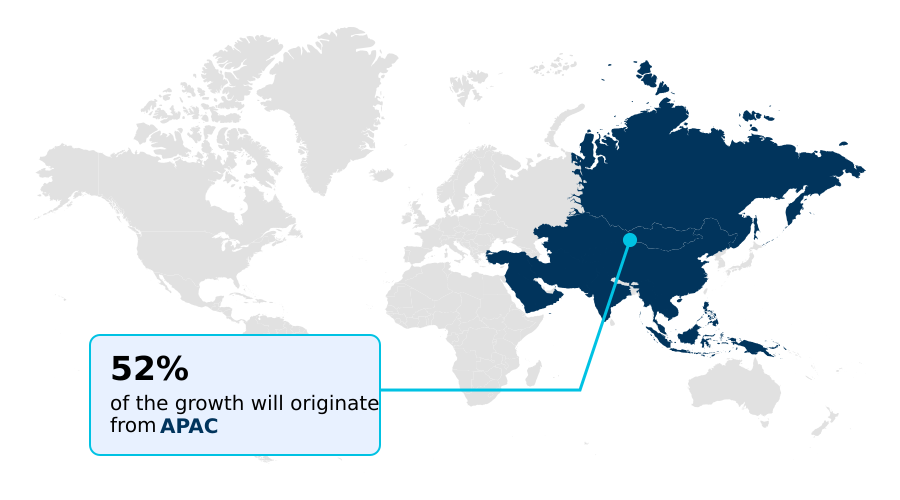
APAC is estimated to contribute 51.9% to the growth of the global market during the forecast period.Technavio’s analysts have elaborately explained the regional trends and drivers that shape the market during the forecast period.
See How Massive Multiplayer Online (Mmo) Games Market Demand is Rising in APAC Get Free Sample

Geographic variations in the Massive Multiplayer Online (MMO) Games market reveal distinct operational strategies between APAC and North America. APAC maintains dominance through aggressive mobile-first adoption, showcasing a 45% higher penetration rate for cross play interoperability compared to Western counterparts.

This mobile orientation compels local operators to utilize aggressive dynamic content scaling to accommodate varying hardware capabilities.

In contrast, North American infrastructure focuses heavily on high-fidelity personal computer experiences, resulting in a 30% reduction in latency overhead when executing real time combat synchronization.

Businesses in APAC frequently deploy user generated content tools to sustain engagement, boosting organic community retention by 28%. Meanwhile, North American operators prioritize server shard merging to consolidate player populations during off-peak hours, improving server utilization efficiency by 18%.

These structural differences dictate how regional providers allocate resources, with North America increasingly exploring virtual reality immersion to differentiate premium service offerings.

Market Dynamics

Our researchers analyzed the data with 2025 as the base year, along with the key drivers, trends, and challenges. A holistic analysis of drivers will help companies refine their marketing strategies to gain a competitive advantage.

  • The operational landscape of the Massive Multiplayer Online (MMO) Games market requires robust technological frameworks to support thousands of interacting users simultaneously. Managing these digital environments involves deploying sophisticated cross platform integration server mechanics to ensure that progression and state data remain unified across diverse hardware architectures.
  • When developers optimize these pipelines, they often achieve a 40% faster synchronization rate compared to legacy siloed networks, directly improving supply chain efficiency in content delivery. As player expectations for deep narratives expand, studios are increasingly adopting generative artificial intelligence quest design to automate the creation of dynamic storylines, thereby reducing manual narrative scripting workloads.
  • Furthermore, balancing virtual marketplaces demands the use of persistent world economy management tools that monitor supply and demand fluctuations in real-time, preventing inflation and ensuring fair digital commerce. To enhance the visual fidelity without causing processing bottlenecks, engineers prioritize seamless open world zone rendering, which dynamically loads environmental assets based on player proximity.
  • This technique drastically lowers memory consumption on client devices. Ultimately, sustaining peak performance during major content updates hinges on implementing advanced concurrent user capacity optimization techniques. These strategies allow server architectures to elastically scale resource allocation, maintaining stability and a flawless interactive experience during periods of intense digital traffic.
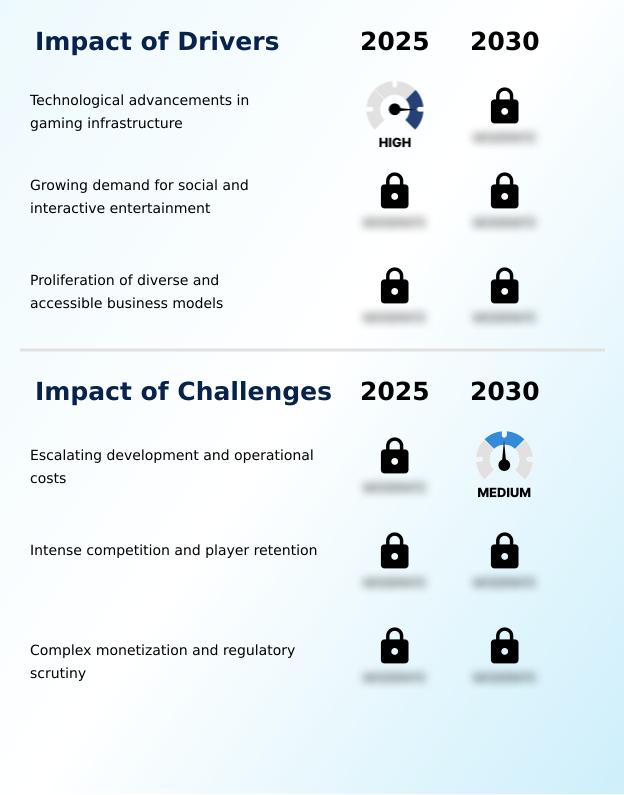
What are the key market drivers leading to the rise in the adoption of Massive Multiplayer Online (Mmo) Games Industry?

  • Technological advancements in gaming infrastructure, particularly the rollout of high-speed networks and cloud computing, serve as the primary driver propelling market expansion.

  • The relentless expansion of high-speed digital infrastructure acts as the primary catalyst propelling the Massive Multiplayer Online (MMO) Games sector.
  • Operators are capitalizing on improved network bandwidth utilization to process denser volumes of interaction data, yielding a 35% increase in baseline concurrent player capacity per server shard.
  • This capability satisfies the surging consumer demand for massive, uninstanced social gatherings and large-scale cooperative events. Additionally, the strategic implementation of automated server downtime mitigation protocols has lowered maintenance-related outages by 22%, directly maximizing service availability and operational efficiency.
  • The push for high fidelity graphics processing compels studios to adopt cloud-native rendering solutions. Furthermore, structured esports tournament integration transforms casual participation into highly organized competitive events, driving sustained daily active usage and deepening the overall interactive ecosystem.

What are the market trends shaping the Massive Multiplayer Online (Mmo) Games Industry?

  • The rise of seamless cross-platform ecosystems represents a primary trend shaping the current market landscape. This strategic shift enables unified player progression across diverse hardware environments.

  • The transition toward fully interoperable digital ecosystems is fundamentally altering the Massive Multiplayer Online (MMO) Games landscape. Companies are aggressively pursuing advanced game engine optimization to support expansive virtual environments across diverse hardware platforms. This shift is primarily driven by the necessity to implement procedural world generation, which automates environmental design and significantly reduces asset creation bottlenecks.
  • By deploying robust latency reduction protocols, network engineers have successfully decreased data transmission delays, achieving a 28% improvement in input responsiveness for global server clusters. Furthermore, the integration of intricate character customization frameworks enables higher personalization, directly driving a 15% increase in user session durations.
  • As operators refine microtransaction economy balancing, they ensure sustainable revenue models without alienating the core audience. The continuous evolution of emergent gameplay narratives allows communities to shape their own experiences, actively fostering deeper engagement and long-term operational resilience.

What challenges does the Massive Multiplayer Online (Mmo) Games Industry face during its growth?

  • Escalating development and operational costs remain a formidable challenge, imposing high barriers to entry and demanding continuous resource allocation for live-service maintenance.

  • Maintaining sustainable operational scaling presents a formidable structural limitation within the Massive Multiplayer Online (MMO) Games ecosystem. Deploying resilient cloud gaming infrastructure demands immense capital expenditure, heavily straining operational budgets as companies attempt to process vast amounts of user data in real-time.
  • Unpredictable fluctuations in player driven virtual economies force developers to constantly monitor supply dynamics, as unchecked digital inflation can cause a 40% drop in marketplace participation. The complexity of programming generative artificial intelligence NPCs introduces significant debugging challenges, extending quality assurance timelines by an average of 18%.
  • Furthermore, accurately calibrating matchmaking rating calculation algorithms remains a persistent obstacle, often leading to competitive imbalances. The pressure to deliver rigorous seasonal content rollouts while experimenting with hybrid monetization models heavily taxes development pipelines and challenges long-term resource allocation.

Exclusive Technavio Analysis on Customer Landscape

The massive multiplayer online (mmo) games market forecasting report includes the adoption lifecycle of the market, covering from the innovator’s stage to the laggard’s stage. It focuses on adoption rates in different regions based on penetration. Furthermore, the massive multiplayer online (mmo) games market report also includes key purchase criteria and drivers of price sensitivity to help companies evaluate and develop their market growth analysis strategies.
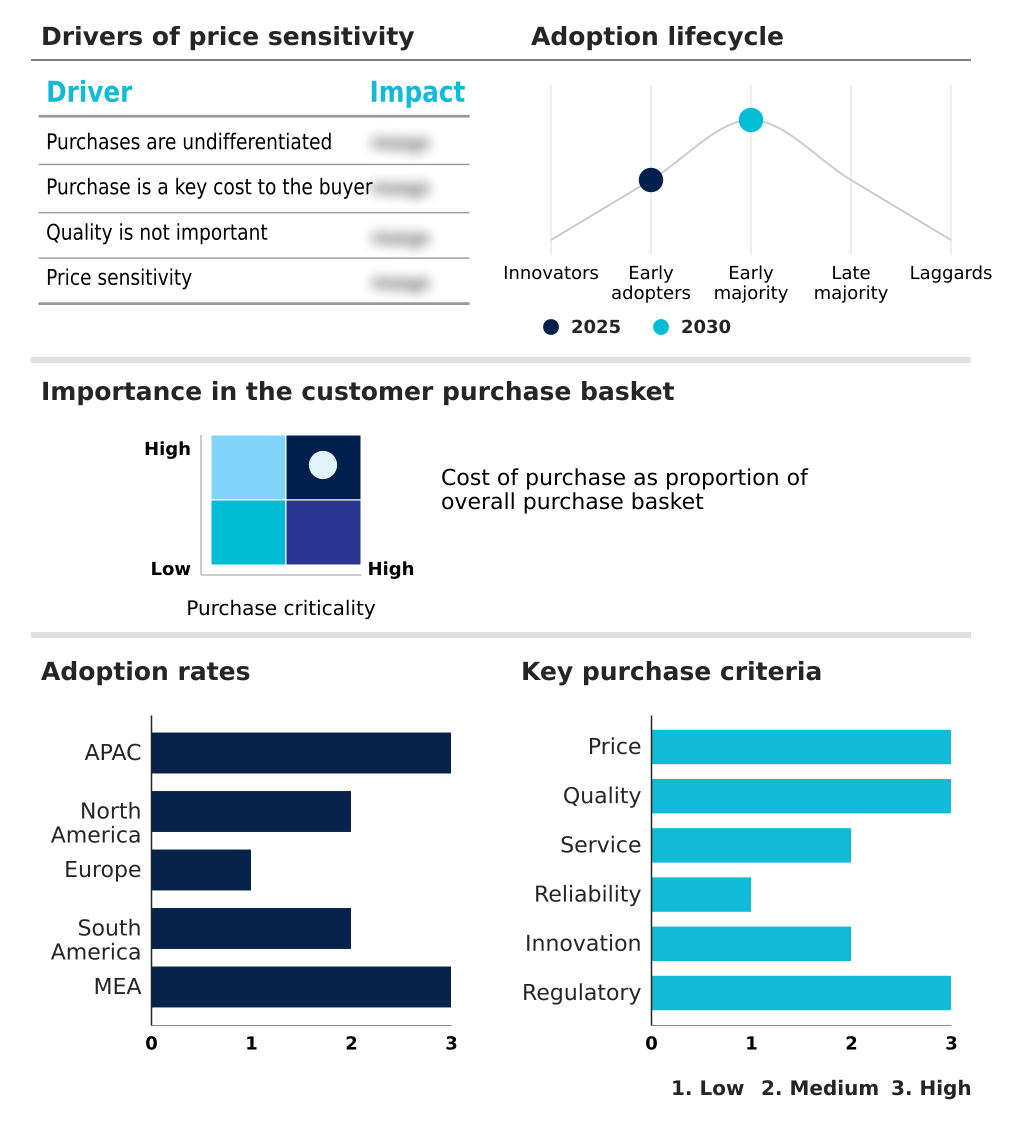
Customer Landscape of Massive Multiplayer Online (Mmo) Games Industry

Competitive Landscape

Companies are implementing various strategies, such as strategic alliances, massive multiplayer online (mmo) games market forecast, partnerships, mergers and acquisitions, geographical expansion, and product/service launches, to enhance their presence in the industry.

Amazon Games - Analyzing the interactive entertainment sector reveals a strong emphasis on delivering expansive virtual worlds, emphasizing robust character progression, dynamic social ecosystems, and continuous live-service content integration.

The industry research and growth report includes detailed analyses of the competitive landscape of the market and information about key companies, including:

  • Amazon Games
  • Ankama Games
  • ArenaNet LLC
  • Bandai Namco Entertainment
  • Blizzard Entertainment Inc.
  • CipSoft GmbH
  • Daybreak Game Co. LLC
  • Fenris Digital Inc.
  • Gameforge AG
  • gamigo AG
  • Hi Rez Studios Inc.
  • Jagex Ltd.
  • Kakao Games Corp.
  • NCSoft Corp.
  • NEXON Co. Ltd.
  • Pearl Abyss Corp
  • Sega Corp.
  • Square Enix Holdings Co. Ltd.
  • Standing Stone Games LLC
  • Tencent Holdings Ltd.

Qualitative and quantitative analysis of companies has been conducted to help clients understand the wider business environment as well as the strengths and weaknesses of key industry players. Data is qualitatively analyzed to categorize companies as pure play, category-focused, industry-focused, and diversified; it is quantitatively analyzed to categorize companies as dominant, leading, strong, tentative, and weak.

Recent Development and News in Massive multiplayer online (mmo) games market

  • In the Interactive Home Entertainment industry, the widespread deployment of edge computing infrastructure has reduced data transmission latency by up to 30%, directly impacting Massive Multiplayer Online (MMO) Games demand by enabling complex, physics-based interactions for thousands of simultaneous users.
  • In the Interactive Home Entertainment industry, the enforcement of stringent digital privacy frameworks like the General Data Protection Regulation has fundamentally altered user telemetry collection processes, directly impacting Massive Multiplayer Online (MMO) Games demand by requiring localized server deployment and compliant data handling protocols.
  • In the Interactive Home Entertainment industry, the accelerated adoption of hardware-agnostic cloud streaming platforms has removed the necessity for high-end graphic processing units, directly impacting Massive Multiplayer Online (MMO) Games demand by expanding the addressable audience among players utilizing low-specification devices.
  • In the Interactive Home Entertainment industry, the integration of generative algorithmic asset creation pipelines has accelerated environmental design workflows by 40%, directly impacting Massive Multiplayer Online (MMO) Games demand by allowing development teams to deploy expansive new virtual territories at a faster cadence.

Dive into Technavio’s robust research methodology, blending expert interviews, extensive data synthesis, and validated models for unparalleled Massive Multiplayer Online (Mmo) Games Market insights. See full methodology.

Market Scope
Page number 289
Base year 2025
Historic period 2020-2024
Forecast period 2026-2030
Growth momentum & CAGR Accelerate at a CAGR of 10.1%
Market growth 2026-2030 USD 32910.6 million
Market structure Fragmented
YoY growth 2025-2026(%) 9.6%
Key countries China, Japan, South Korea, India, Australia, Indonesia, US, Canada, Mexico, Germany, UK, France, Italy, Spain, Poland, Brazil, Argentina, Chile, Saudi Arabia, UAE, South Africa, Turkey and Egypt
Competitive landscape Leading Companies, Market Positioning of Companies, Competitive Strategies, and Industry Risks

Request Free Sample

Research Analyst Overview

  • The Massive Multiplayer Online (MMO) Games sector operates as a high-stakes digital ecosystem where technological stability directly dictates commercial viability. Enterprises face continuous pressure to refine server architecture scaling to accommodate fluctuating user populations without service degradation. Implementing robust guild management systems has become a crucial strategic priority, fostering community loyalty and driving long-term participation.
  • Decision-makers are increasingly prioritizing strict security compliance by integrating advanced anti cheat detection algorithms, a move that has demonstrated a 35% reduction in unauthorized modifications and significantly improved competitive fairness. The maintenance of persistent state environments ensures that user actions have lasting consequences, demanding complex data storage solutions.
  • Furthermore, refining instance dungeon matchmaking algorithms optimizes the user journey by reducing wait times for cooperative activities. From a product strategy standpoint, shifting toward cosmetic item monetization allows companies to generate consistent revenue while avoiding mechanics that compromise gameplay balance.
  • The careful calibration of player vs environment mechanics remains essential to provide engaging content that challenges users and sustains daily operational activity.

What are the Key Data Covered in this Massive Multiplayer Online (Mmo) Games Market Research and Growth Report?

  • What is the expected growth of the Massive Multiplayer Online (Mmo) Games Market between 2026 and 2030?

    • USD 32.91 billion, at a CAGR of 10.1%

  • What segmentation does the market report cover?

    • The report is segmented by Genre (MMORPG, MMOFPS, MMORTS, and Others), Type (F2P, and P2P), Application (Professional players, and Amateur players) and Geography (APAC, North America, Europe, South America, Middle East and Africa)

  • Which regions are analyzed in the report?

    • APAC, North America, Europe, South America and Middle East and Africa

  • What are the key growth drivers and market challenges?

    • Technological advancements in gaming infrastructure, Escalating development and operational costs

  • Who are the major players in the Massive Multiplayer Online (Mmo) Games Market?

    • Amazon Games, Ankama Games, ArenaNet LLC, Bandai Namco Entertainment, Blizzard Entertainment Inc., CipSoft GmbH, Daybreak Game Co. LLC, Fenris Digital Inc., Gameforge AG, gamigo AG, Hi Rez Studios Inc., Jagex Ltd., Kakao Games Corp., NCSoft Corp., NEXON Co. Ltd., Pearl Abyss Corp, Sega Corp., Square Enix Holdings Co. Ltd., Standing Stone Games LLC and Tencent Holdings Ltd.

Market Research Insights

  • The Massive Multiplayer Online (MMO) Games market relies on sophisticated digital infrastructure to maintain high engagement levels. Leveraging distributed database management allows operators to process massive volumes of player interactions securely, yielding a 40% improvement in server stability during peak traffic.
  • Furthermore, operators utilizing behavioral telemetry analytics can identify friction points in gameplay, resulting in a 25% increase in user session lengths. Strategic implementations like battle pass integration have successfully aligned revenue streams with active participation, driving a 15% enhancement in overall compliance with monetization fairness standards. These optimized player retention strategies actively reduce churn rates while boosting long-term operational efficiency.

We can help! Our analysts can customize this massive multiplayer online (mmo) games market research report to meet your requirements.

Get in touch

1. Executive Summary

1.1 Market overview

Executive Summary - Chart on Market Overview
Executive Summary - Data Table on Market Overview
Executive Summary - Chart on Global Market Characteristics
Executive Summary - Chart on Market by Geography
Executive Summary - Chart on Market Segmentation by Genre
Executive Summary - Chart on Market Segmentation by Type
Executive Summary - Chart on Market Segmentation by Application
Executive Summary - Chart on Incremental Growth
Executive Summary - Data Table on Incremental Growth
Executive Summary - Chart on Company Market Positioning

2. Technavio Analysis

2.1 Analysis of price sensitivity, lifecycle, customer purchase basket, adoption rates, and purchase criteria

2.2 Criticality of inputs and Factors of differentiation

Chart on Overview on criticality of inputs and factors of differentiation

2.3 Factors of disruption

Chart on Overview on factors of disruption

2.4 Impact of drivers and challenges

Chart on Impact of drivers and challenges in 2025 and 2030

3. Market Landscape

3.1 Market ecosystem

Chart on Parent Market
Data Table on - Parent Market

3.2 Market characteristics

Chart on Market characteristics analysis

3.3 Value chain analysis

Chart on Value chain analysis

4. Market Sizing

4.1 Market definition

Data Table on Offerings of companies included in the market definition

4.2 Market segment analysis

Market segments

4.3 Market size 2025

4.4 Market outlook: Forecast for 2025-2030

Chart on Global - Market size and forecast 2025-2030 ($ million)
Data Table on Global - Market size and forecast 2025-2030 ($ million)
Chart on Global Market: Year-over-year growth 2025-2030 (%)
Data Table on Global Market: Year-over-year growth 2025-2030 (%)

5. Historic Market Size

5.1 Global Massive Multiplayer Online (MMO) Games Market 2020 - 2024

Historic Market Size - Data Table on Global Massive Multiplayer Online (MMO) Games Market 2020 - 2024 ($ million)

5.2 Genre segment analysis 2020 - 2024

Historic Market Size - Genre Segment 2020 - 2024 ($ million)

5.3 Type segment analysis 2020 - 2024

Historic Market Size - Type Segment 2020 - 2024 ($ million)

5.4 Application segment analysis 2020 - 2024

Historic Market Size - Application Segment 2020 - 2024 ($ million)

5.5 Geography segment analysis 2020 - 2024

Historic Market Size - Geography Segment 2020 - 2024 ($ million)

5.6 Country segment analysis 2020 - 2024

Historic Market Size - Country Segment 2020 - 2024 ($ million)

6. Qualitative Analysis

6.1 Impact of AI on Global Massive Multiplayer Online (MMO) Games Market

6.2 Impact of Geopolitical Conflicts on Global Massive Multiplayer Online (MMO) Games Market

7. Five Forces Analysis

7.1 Five forces summary

Five forces analysis - Comparison between 2025 and 2030

7.2 Bargaining power of buyers

Bargaining power of buyers - Impact of key factors 2025 and 2030

7.3 Bargaining power of suppliers

Bargaining power of suppliers - Impact of key factors in 2025 and 2030

7.4 Threat of new entrants

Threat of new entrants - Impact of key factors in 2025 and 2030

7.5 Threat of substitutes

Threat of substitutes - Impact of key factors in 2025 and 2030

7.6 Threat of rivalry

Threat of rivalry - Impact of key factors in 2025 and 2030

7.7 Market condition

Chart on Market condition - Five forces 2025 and 2030

8. Market Segmentation by Genre

8.1 Market segments

Chart on Genre - Market share 2025-2030 (%)
Data Table on Genre - Market share 2025-2030 (%)

8.2 Comparison by Genre

Chart on Comparison by Genre
Data Table on Comparison by Genre

8.3 MMORPG - Market size and forecast 2025-2030

Chart on MMORPG - Market size and forecast 2025-2030 ($ million)
Data Table on MMORPG - Market size and forecast 2025-2030 ($ million)
Chart on MMORPG - Year-over-year growth 2025-2030 (%)
Data Table on MMORPG - Year-over-year growth 2025-2030 (%)

8.4 MMOFPS - Market size and forecast 2025-2030

Chart on MMOFPS - Market size and forecast 2025-2030 ($ million)
Data Table on MMOFPS - Market size and forecast 2025-2030 ($ million)
Chart on MMOFPS - Year-over-year growth 2025-2030 (%)
Data Table on MMOFPS - Year-over-year growth 2025-2030 (%)

8.5 MMORTS - Market size and forecast 2025-2030

Chart on MMORTS - Market size and forecast 2025-2030 ($ million)
Data Table on MMORTS - Market size and forecast 2025-2030 ($ million)
Chart on MMORTS - Year-over-year growth 2025-2030 (%)
Data Table on MMORTS - Year-over-year growth 2025-2030 (%)

8.6 Others - Market size and forecast 2025-2030

Chart on Others - Market size and forecast 2025-2030 ($ million)
Data Table on Others - Market size and forecast 2025-2030 ($ million)
Chart on Others - Year-over-year growth 2025-2030 (%)
Data Table on Others - Year-over-year growth 2025-2030 (%)

8.7 Market opportunity by Genre

Market opportunity by Genre ($ million)
Data Table on Market opportunity by Genre ($ million)

9. Market Segmentation by Type

9.1 Market segments

Chart on Type - Market share 2025-2030 (%)
Data Table on Type - Market share 2025-2030 (%)

9.2 Comparison by Type

Chart on Comparison by Type
Data Table on Comparison by Type

9.3 F2P - Market size and forecast 2025-2030

Chart on F2P - Market size and forecast 2025-2030 ($ million)
Data Table on F2P - Market size and forecast 2025-2030 ($ million)
Chart on F2P - Year-over-year growth 2025-2030 (%)
Data Table on F2P - Year-over-year growth 2025-2030 (%)

9.4 P2P - Market size and forecast 2025-2030

Chart on P2P - Market size and forecast 2025-2030 ($ million)
Data Table on P2P - Market size and forecast 2025-2030 ($ million)
Chart on P2P - Year-over-year growth 2025-2030 (%)
Data Table on P2P - Year-over-year growth 2025-2030 (%)

9.5 Market opportunity by Type

Market opportunity by Type ($ million)
Data Table on Market opportunity by Type ($ million)

10. Market Segmentation by Application

10.1 Market segments

Chart on Application - Market share 2025-2030 (%)
Data Table on Application - Market share 2025-2030 (%)

10.2 Comparison by Application

Chart on Comparison by Application
Data Table on Comparison by Application

10.3 Professional players - Market size and forecast 2025-2030

Chart on Professional players - Market size and forecast 2025-2030 ($ million)
Data Table on Professional players - Market size and forecast 2025-2030 ($ million)
Chart on Professional players - Year-over-year growth 2025-2030 (%)
Data Table on Professional players - Year-over-year growth 2025-2030 (%)

10.4 Amateur players - Market size and forecast 2025-2030

Chart on Amateur players - Market size and forecast 2025-2030 ($ million)
Data Table on Amateur players - Market size and forecast 2025-2030 ($ million)
Chart on Amateur players - Year-over-year growth 2025-2030 (%)
Data Table on Amateur players - Year-over-year growth 2025-2030 (%)

10.5 Market opportunity by Application

Market opportunity by Application ($ million)
Data Table on Market opportunity by Application ($ million)

11. Customer Landscape

11.1 Customer landscape overview

Analysis of price sensitivity, lifecycle, customer purchase basket, adoption rates, and purchase criteria

12. Geographic Landscape

12.1 Geographic segmentation

Chart on Market share by geography 2025-2030 (%)
Data Table on Market share by geography 2025-2030 (%)

12.2 Geographic comparison

Chart on Geographic comparison
Data Table on Geographic comparison

12.3 APAC - Market size and forecast 2025-2030

Chart on APAC - Market size and forecast 2025-2030 ($ million)
Data Table on APAC - Market size and forecast 2025-2030 ($ million)
Chart on APAC - Year-over-year growth 2025-2030 (%)
Data Table on APAC - Year-over-year growth 2025-2030 (%)
Chart on Regional Comparison - APAC
Data Table on Regional Comparison - APAC

12.3.1 China - Market size and forecast 2025-2030

Chart on China - Market size and forecast 2025-2030 ($ million)
Data Table on China - Market size and forecast 2025-2030 ($ million)
Chart on China - Year-over-year growth 2025-2030 (%)
Data Table on China - Year-over-year growth 2025-2030 (%)

12.3.2 Japan - Market size and forecast 2025-2030

Chart on Japan - Market size and forecast 2025-2030 ($ million)
Data Table on Japan - Market size and forecast 2025-2030 ($ million)
Chart on Japan - Year-over-year growth 2025-2030 (%)
Data Table on Japan - Year-over-year growth 2025-2030 (%)

12.3.3 South Korea - Market size and forecast 2025-2030

Chart on South Korea - Market size and forecast 2025-2030 ($ million)
Data Table on South Korea - Market size and forecast 2025-2030 ($ million)
Chart on South Korea - Year-over-year growth 2025-2030 (%)
Data Table on South Korea - Year-over-year growth 2025-2030 (%)

12.3.4 India - Market size and forecast 2025-2030

Chart on India - Market size and forecast 2025-2030 ($ million)
Data Table on India - Market size and forecast 2025-2030 ($ million)
Chart on India - Year-over-year growth 2025-2030 (%)
Data Table on India - Year-over-year growth 2025-2030 (%)

12.3.5 Australia - Market size and forecast 2025-2030

Chart on Australia - Market size and forecast 2025-2030 ($ million)
Data Table on Australia - Market size and forecast 2025-2030 ($ million)
Chart on Australia - Year-over-year growth 2025-2030 (%)
Data Table on Australia - Year-over-year growth 2025-2030 (%)

12.3.6 Indonesia - Market size and forecast 2025-2030

Chart on Indonesia - Market size and forecast 2025-2030 ($ million)
Data Table on Indonesia - Market size and forecast 2025-2030 ($ million)
Chart on Indonesia - Year-over-year growth 2025-2030 (%)
Data Table on Indonesia - Year-over-year growth 2025-2030 (%)

12.4 North America - Market size and forecast 2025-2030

Chart on North America - Market size and forecast 2025-2030 ($ million)
Data Table on North America - Market size and forecast 2025-2030 ($ million)
Chart on North America - Year-over-year growth 2025-2030 (%)
Data Table on North America - Year-over-year growth 2025-2030 (%)
Chart on Regional Comparison - North America
Data Table on Regional Comparison - North America

12.4.1 US - Market size and forecast 2025-2030

Chart on US - Market size and forecast 2025-2030 ($ million)
Data Table on US - Market size and forecast 2025-2030 ($ million)
Chart on US - Year-over-year growth 2025-2030 (%)
Data Table on US - Year-over-year growth 2025-2030 (%)

12.4.2 Canada - Market size and forecast 2025-2030

Chart on Canada - Market size and forecast 2025-2030 ($ million)
Data Table on Canada - Market size and forecast 2025-2030 ($ million)
Chart on Canada - Year-over-year growth 2025-2030 (%)
Data Table on Canada - Year-over-year growth 2025-2030 (%)

12.4.3 Mexico - Market size and forecast 2025-2030

Chart on Mexico - Market size and forecast 2025-2030 ($ million)
Data Table on Mexico - Market size and forecast 2025-2030 ($ million)
Chart on Mexico - Year-over-year growth 2025-2030 (%)
Data Table on Mexico - Year-over-year growth 2025-2030 (%)

12.5 Europe - Market size and forecast 2025-2030

Chart on Europe - Market size and forecast 2025-2030 ($ million)
Data Table on Europe - Market size and forecast 2025-2030 ($ million)
Chart on Europe - Year-over-year growth 2025-2030 (%)
Data Table on Europe - Year-over-year growth 2025-2030 (%)
Chart on Regional Comparison - Europe
Data Table on Regional Comparison - Europe

12.5.1 Germany - Market size and forecast 2025-2030

Chart on Germany - Market size and forecast 2025-2030 ($ million)
Data Table on Germany - Market size and forecast 2025-2030 ($ million)
Chart on Germany - Year-over-year growth 2025-2030 (%)
Data Table on Germany - Year-over-year growth 2025-2030 (%)

12.5.2 UK - Market size and forecast 2025-2030

Chart on UK - Market size and forecast 2025-2030 ($ million)
Data Table on UK - Market size and forecast 2025-2030 ($ million)
Chart on UK - Year-over-year growth 2025-2030 (%)
Data Table on UK - Year-over-year growth 2025-2030 (%)

12.5.3 France - Market size and forecast 2025-2030

Chart on France - Market size and forecast 2025-2030 ($ million)
Data Table on France - Market size and forecast 2025-2030 ($ million)
Chart on France - Year-over-year growth 2025-2030 (%)
Data Table on France - Year-over-year growth 2025-2030 (%)

12.5.4 Italy - Market size and forecast 2025-2030

Chart on Italy - Market size and forecast 2025-2030 ($ million)
Data Table on Italy - Market size and forecast 2025-2030 ($ million)
Chart on Italy - Year-over-year growth 2025-2030 (%)
Data Table on Italy - Year-over-year growth 2025-2030 (%)

12.5.5 Spain - Market size and forecast 2025-2030

Chart on Spain - Market size and forecast 2025-2030 ($ million)
Data Table on Spain - Market size and forecast 2025-2030 ($ million)
Chart on Spain - Year-over-year growth 2025-2030 (%)
Data Table on Spain - Year-over-year growth 2025-2030 (%)

12.5.6 Poland - Market size and forecast 2025-2030

Chart on Poland - Market size and forecast 2025-2030 ($ million)
Data Table on Poland - Market size and forecast 2025-2030 ($ million)
Chart on Poland - Year-over-year growth 2025-2030 (%)
Data Table on Poland - Year-over-year growth 2025-2030 (%)

12.6 South America - Market size and forecast 2025-2030

Chart on South America - Market size and forecast 2025-2030 ($ million)
Data Table on South America - Market size and forecast 2025-2030 ($ million)
Chart on South America - Year-over-year growth 2025-2030 (%)
Data Table on South America - Year-over-year growth 2025-2030 (%)
Chart on Regional Comparison - South America
Data Table on Regional Comparison - South America

12.6.1 Brazil - Market size and forecast 2025-2030

Chart on Brazil - Market size and forecast 2025-2030 ($ million)
Data Table on Brazil - Market size and forecast 2025-2030 ($ million)
Chart on Brazil - Year-over-year growth 2025-2030 (%)
Data Table on Brazil - Year-over-year growth 2025-2030 (%)

12.6.2 Argentina - Market size and forecast 2025-2030

Chart on Argentina - Market size and forecast 2025-2030 ($ million)
Data Table on Argentina - Market size and forecast 2025-2030 ($ million)
Chart on Argentina - Year-over-year growth 2025-2030 (%)
Data Table on Argentina - Year-over-year growth 2025-2030 (%)

12.6.3 Chile - Market size and forecast 2025-2030

Chart on Chile - Market size and forecast 2025-2030 ($ million)
Data Table on Chile - Market size and forecast 2025-2030 ($ million)
Chart on Chile - Year-over-year growth 2025-2030 (%)
Data Table on Chile - Year-over-year growth 2025-2030 (%)

12.7 Middle East and Africa - Market size and forecast 2025-2030

Chart on Middle East and Africa - Market size and forecast 2025-2030 ($ million)
Data Table on Middle East and Africa - Market size and forecast 2025-2030 ($ million)
Chart on Middle East and Africa - Year-over-year growth 2025-2030 (%)
Data Table on Middle East and Africa - Year-over-year growth 2025-2030 (%)
Chart on Regional Comparison - Middle East and Africa
Data Table on Regional Comparison - Middle East and Africa

12.7.1 Saudi Arabia - Market size and forecast 2025-2030

Chart on Saudi Arabia - Market size and forecast 2025-2030 ($ million)
Data Table on Saudi Arabia - Market size and forecast 2025-2030 ($ million)
Chart on Saudi Arabia - Year-over-year growth 2025-2030 (%)
Data Table on Saudi Arabia - Year-over-year growth 2025-2030 (%)

12.7.2 UAE - Market size and forecast 2025-2030

Chart on UAE - Market size and forecast 2025-2030 ($ million)
Data Table on UAE - Market size and forecast 2025-2030 ($ million)
Chart on UAE - Year-over-year growth 2025-2030 (%)
Data Table on UAE - Year-over-year growth 2025-2030 (%)

12.7.3 South Africa - Market size and forecast 2025-2030

Chart on South Africa - Market size and forecast 2025-2030 ($ million)
Data Table on South Africa - Market size and forecast 2025-2030 ($ million)
Chart on South Africa - Year-over-year growth 2025-2030 (%)
Data Table on South Africa - Year-over-year growth 2025-2030 (%)

12.7.4 Turkey - Market size and forecast 2025-2030

Chart on Turkey - Market size and forecast 2025-2030 ($ million)
Data Table on Turkey - Market size and forecast 2025-2030 ($ million)
Chart on Turkey - Year-over-year growth 2025-2030 (%)
Data Table on Turkey - Year-over-year growth 2025-2030 (%)

12.7.5 Egypt - Market size and forecast 2025-2030

Chart on Egypt - Market size and forecast 2025-2030 ($ million)
Data Table on Egypt - Market size and forecast 2025-2030 ($ million)
Chart on Egypt - Year-over-year growth 2025-2030 (%)
Data Table on Egypt - Year-over-year growth 2025-2030 (%)

12.8 Market opportunity by geography

Market opportunity by geography ($ million)
Data Tables on Market opportunity by geography ($ million)

13. Drivers, Challenges, and Opportunity

13.1 Market drivers

Technological advancements in gaming infrastructure
Growing demand for social and interactive entertainment
Proliferation of diverse and accessible business models

13.2 Market challenges

Escalating development and operational costs
Intense competition and player retention
Complex monetization and regulatory scrutiny

13.3 Impact of drivers and challenges

Impact of drivers and challenges in 2025 and 2030

13.4 Market opportunities

Rise of seamless cross-platform ecosystems
Integration of AI and generative content systems
Emergence of user-generated content platforms

14. Competitive Landscape

14.1 Overview

14.2

Overview on criticality of inputs and factors of differentiation

14.3 Landscape disruption

Overview on factors of disruption

14.4 Industry risks

Impact of key risks on business

15. Competitive Analysis

15.1 Companies profiled

Companies covered

15.2 Company ranking index

15.3 Market positioning of companies

Matrix on companies position and classification

15.4 Amazon Games

Amazon Games - Overview
Amazon Games - Product / Service
Amazon Games - Key offerings
SWOT

15.5 Ankama Games

Ankama Games - Overview
Ankama Games - Product / Service
Ankama Games - Key offerings
SWOT

15.6 ArenaNet LLC

ArenaNet LLC - Overview
ArenaNet LLC - Product / Service
ArenaNet LLC - Key offerings
SWOT

15.7 Bandai Namco Entertainment

Bandai Namco Entertainment - Overview
Bandai Namco Entertainment - Product / Service
Bandai Namco Entertainment - Key offerings
SWOT

15.8 Blizzard Entertainment Inc.

Blizzard Entertainment Inc. - Overview
Blizzard Entertainment Inc. - Product / Service
Blizzard Entertainment Inc. - Key offerings
SWOT

15.9 CipSoft GmbH

CipSoft GmbH - Overview
CipSoft GmbH - Product / Service
CipSoft GmbH - Key offerings
SWOT

15.10 Daybreak Game Co. LLC

Daybreak Game Co. LLC - Overview
Daybreak Game Co. LLC - Product / Service
Daybreak Game Co. LLC - Key offerings
SWOT

15.11 Fenris Digital Inc.

Fenris Digital Inc. - Overview
Fenris Digital Inc. - Product / Service
Fenris Digital Inc. - Key offerings
SWOT

15.12 NCSoft Corp.

NCSoft Corp. - Overview
NCSoft Corp. - Product / Service
NCSoft Corp. - Key offerings
SWOT

15.13 NEXON Co. Ltd.

NEXON Co. Ltd. - Overview
NEXON Co. Ltd. - Product / Service
NEXON Co. Ltd. - Key offerings
SWOT

15.14 Pearl Abyss Corp

Pearl Abyss Corp - Overview
Pearl Abyss Corp - Product / Service
Pearl Abyss Corp - Key offerings
SWOT

15.15 Sega Corp.

Sega Corp. - Overview
Sega Corp. - Product / Service
Sega Corp. - Key offerings
SWOT

15.16 Square Enix Holdings Co. Ltd.

Square Enix Holdings Co. Ltd. - Overview
Square Enix Holdings Co. Ltd. - Business segments
Square Enix Holdings Co. Ltd. - Key offerings
Square Enix Holdings Co. Ltd. - Segment focus
SWOT

15.17 Standing Stone Games LLC

Standing Stone Games LLC - Overview
Standing Stone Games LLC - Product / Service
Standing Stone Games LLC - Key offerings
SWOT

15.18 Tencent Holdings Ltd.

Tencent Holdings Ltd. - Overview
Tencent Holdings Ltd. - Business segments
Tencent Holdings Ltd. - Key offerings
Tencent Holdings Ltd. - Segment focus
SWOT

16. Appendix

16.1 Scope of the report

Market definition
Objectives
Notes and caveats

16.2 Inclusions and exclusions checklist

Inclusions checklist
Exclusions checklist

16.3 Currency conversion rates for US$

16.4 Research methodology

16.5 Data procurement

Information sources

16.6 Data validation

16.7 Validation techniques employed for market sizing

16.8 Data synthesis

16.9 360 degree market analysis

16.10 List of abbreviations

Research Methodology

Technavio presents a detailed picture of the market by way of study, synthesis, and summation of data from multiple sources. The analysts have presented the various facets of the market with a particular focus on identifying the key industry influencers. The data thus presented is comprehensive, reliable, and the result of extensive research, both primary and secondary.

INFORMATION SOURCES

Primary sources

  • Manufacturers and suppliers
  • Channel partners
  • Industry experts
  • Strategic decision makers

Secondary sources

  • Industry journals and periodicals
  • Government data
  • Financial reports of key industry players
  • Historical data
  • Press releases

DATA ANALYSIS

Data Synthesis

  • Collation of data
  • Estimation of key figures
  • Analysis of derived insights

Data Validation

  • Triangulation with data models
  • Reference against proprietary databases
  • Corroboration with industry experts

REPORT WRITING

Qualitative

  • Market drivers
  • Market challenges
  • Market trends
  • Five forces analysis

Quantitative

  • Market size and forecast
  • Market segmentation
  • Geographical insights
  • Competitive landscape

Interested in this report?

Get your sample now to see our research methodology and insights!

Download Now

Frequently Asked Questions

Massive Multiplayer Online (Mmo) Games market growth will increase by USD 32910.6 million during 2026-2030.

The Massive Multiplayer Online (Mmo) Games market is expected to grow at a CAGR of 10.1% during 2026-2030.

Massive Multiplayer Online (Mmo) Games market is segmented by Genre (MMORPG, MMOFPS, MMORTS, Others) Type (F2P, P2P) Application (Professional players, Amateur players)

Amazon Games, Ankama Games, ArenaNet LLC, Bandai Namco Entertainment, Blizzard Entertainment Inc., CipSoft GmbH, Daybreak Game Co. LLC, Fenris Digital Inc., Gameforge AG, gamigo AG, Hi Rez Studios Inc., Jagex Ltd., Kakao Games Corp., NCSoft Corp., NEXON Co. Ltd., Pearl Abyss Corp, Sega Corp., Square Enix Holdings Co. Ltd., Standing Stone Games LLC, Tencent Holdings Ltd. are a few of the key vendors in the Massive Multiplayer Online (Mmo) Games market.

APAC will register the highest growth rate of 51.9% among the other regions. Therefore, the Massive Multiplayer Online (Mmo) Games market in APAC is expected to garner significant business opportunities for the vendors during the forecast period.

China, Japan, South Korea, India, Australia, Indonesia, US, Canada, Mexico, Germany, UK, France, Italy, Spain, Poland, Brazil, Argentina, Chile, Saudi Arabia, UAE, South Africa, Turkey, Egypt

  • Technological advancements in gaming infrastructure is the driving factor this market.

The Massive Multiplayer Online (Mmo) Games market vendors should focus on grabbing business opportunities from the Genre segment as it accounted for the largest market share in the base year.
RIA - Research AI Assistant
Ask RIA
