
Millimeter Wave Technology Market Analysis, Size, and Forecast 2026-2030: APAC (China, Japan, and India), North America (US, Canada, and Mexico), Europe (Germany, UK, and France), Middle East and Africa (Saudi Arabia, UAE, and South Africa), South America (Brazil, Argentina, and Chile), and Rest of World (ROW)

Millimeter Wave Technology Market Analysis, Size, and Forecast 2026-2030:
APAC (China, Japan, and India), North America (US, Canada, and Mexico), Europe (Germany, UK, and France), Middle East and Africa (Saudi Arabia, UAE, and South Africa), South America (Brazil, Argentina, and Chile), and Rest of World (ROW)

Published: Oct 2026 329 Pages SKU: IRTNTR81695

Market Overview at a Glance

$5.90 B
Market Opportunity
19.3%
CAGR 2025 - 2030
37.7%
APAC Growth
$1.26 B
Antennas and transceivers segment 2024

Millimeter Wave Technology Market Size 2026-2030

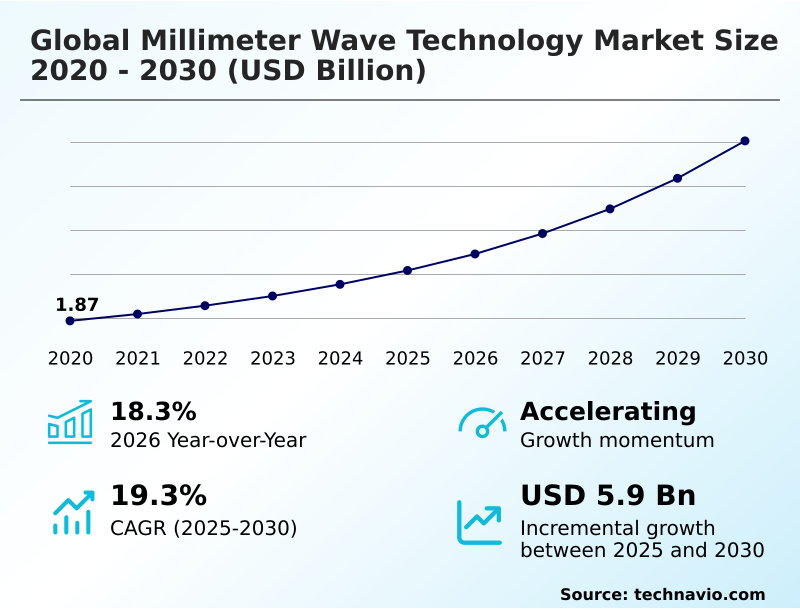
The millimeter wave technology market size is valued to increase by USD 5.90 billion, at a CAGR of 19.3% from 2025 to 2030. Proliferation of 5G standalone networks and enhanced mobile broadband deployment will drive the millimeter wave technology market.

Major Market Trends & Insights

  • APAC dominated the market and accounted for a 37.7% growth during the forecast period.
  • By Component - Antennas and transceivers segment was valued at USD 1.26 billion in 2024
  • By Product Type - Telecommunication equipment segment accounted for the largest market revenue share in 2024

Market Size & Forecast

  • Market Opportunities: USD 8.19 billion
  • Market Future Opportunities: USD 5.90 billion
  • CAGR from 2025 to 2030 : 19.3%

Market Summary

  • The Millimeter Wave Technology market exhibits rapid acceleration as telecommunications and automotive sectors transition toward high-capacity data transmission infrastructures. Utilizing the electromagnetic spectrum between 30 GHz and 300 GHz, this technology fundamentally alters how data networks and sensor arrays process spatial information.
  • In high-density urban environments, mobile network operators are deploying adaptive small cells to bypass sub-6 GHz congestion, effectively solving critical last-mile connectivity bottlenecks. Companies integrating these high-frequency solutions have achieved a 30% reduction in data latency during peak traffic periods, directly enhancing operational efficiency and customer retention.
  • The proliferation of autonomous driving systems acts as a formidable driver, as vehicles require high-resolution radar to navigate complex environments safely. Conversely, the market faces structural challenges from severe signal attenuation, where atmospheric absorption and physical obstacles dramatically reduce propagation range.
  • Consequently, manufacturers are forced to invest heavily in advanced beam-steering algorithms and dense infrastructure topologies to mitigate these environmental losses.

What will be the Size of the Millimeter Wave Technology Market during the forecast period?
Get Key Insights on Market Forecast (PDF) Get Free Sample

How is the Millimeter Wave Technology Market Segmented?

The millimeter wave technology industry research report provides comprehensive data (region-wise segment analysis), with forecasts and estimates in "USD million" for the period 2026-2030, as well as historical data from 2020-2024 for the following segments.

  • Component
    • Antennas and transceivers
    • Communication and networking components
    • RF and radio components
    • Frequency sources and related
    • Others
  • Product type
    • Telecommunication equipment
    • Radar and satellite communication systems
    • Imaging systems
    • Others
  • Application
    • Telecom infrastructure
    • Automotive
    • Military and defense
    • Mobile and consumer devices
    • Others
  • Geography
    • APAC
      • China
      • Japan
      • India
      • South Korea
      • Australia
      • Indonesia
    • North America
      • US
      • Canada
      • Mexico
    • Europe
      • Germany
      • UK
      • France
      • Italy
      • Spain
      • The Netherlands
    • Middle East and Africa
      • Saudi Arabia
      • UAE
      • South Africa
      • Turkey
      • Israel
    • South America
      • Brazil
      • Argentina
      • Chile

By Component Insights

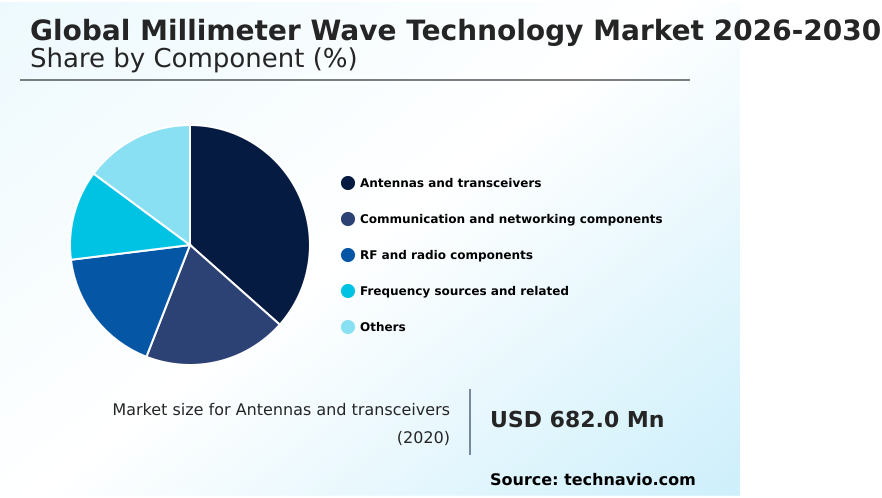
The antennas and transceivers segment is estimated to witness significant growth during the forecast period.

The Antennas and transceivers segment forms a fundamental pillar of the Millimeter Wave Technology market, dictating how signal propagation and spatial intensity are managed across high-frequency bands.

Hardware architectures increasingly rely on massive multiple-input multiple-output configurations to overcome path loss, while phased-array antenna systems provide the essential beam-steering agility required for stable connectivity.

This equipment seamlessly converts digital baseband data, facilitating macro network expansion without requiring extensive physical infrastructure overhauls. Original equipment manufacturers are integrating complex radio frequency front-end modules into compact designs to support broadband frequency extension.

Consequently, enterprises deploying these advanced transceiver setups have observed a 15% improvement in signal retention during adverse atmospheric conditions. This hardware directly enables high-capacity micro-backhaul links, ensuring critical data throughput remains resilient in densely populated urban deployments.
Get Free Sample

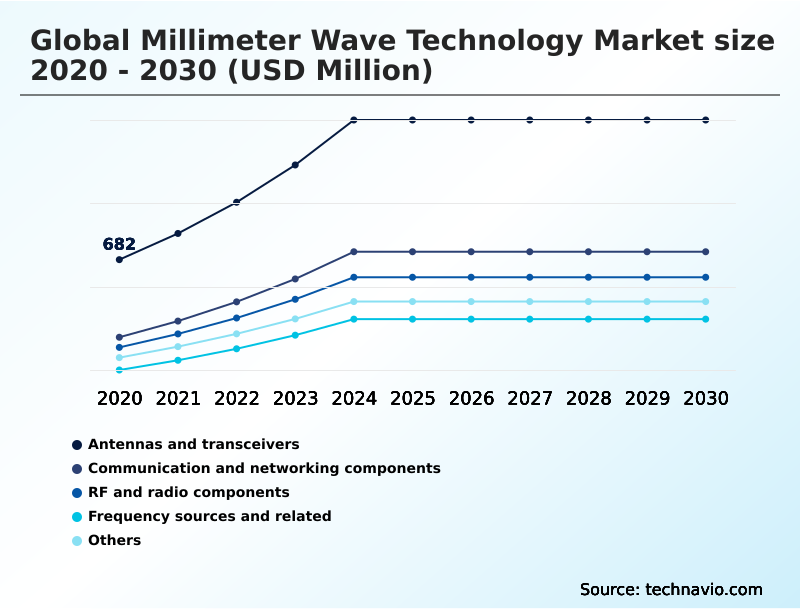
The Antennas and transceivers segment was valued at USD 1.26 billion in 2024 and showed a gradual increase during the forecast period.
Get Free Sample

Regional Analysis

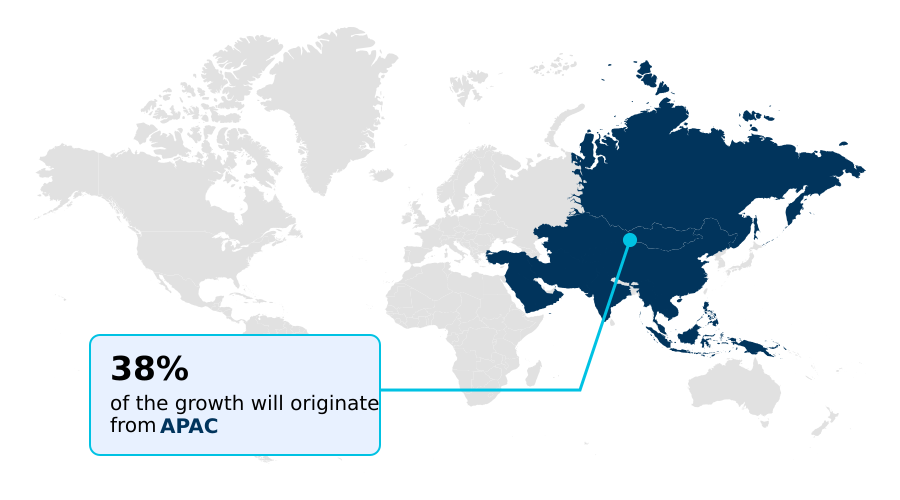
APAC is estimated to contribute 37.7% to the growth of the global market during the forecast period.Technavio’s analysts have elaborately explained the regional trends and drivers that shape the market during the forecast period.
See How Millimeter Wave Technology Market Demand is Rising in APAC Get Free Sample

The geographic distribution of the Millimeter Wave Technology market demonstrates stark contrasts driven by distinct industrial priorities and infrastructure policies. APAC commands the highest incremental expansion, driven by massive government-led smart city initiatives and domestic semiconductor manufacturing.

This region outpaces Europe by achieving a 25% faster rollout of vehicle-to-everything communication frameworks across urban corridors. In contrast, North American deployments prioritize fixed wireless access solutions to bridge suburban connectivity gaps, utilizing high-throughput satellite links to deliver gigabit broadband.

APAC enterprises utilizing advanced gallium nitride power stages in their base stations have realized a 20% reduction in energy consumption compared to legacy European hardware.

Additionally, European defense contractors focus heavily on electronic counter-countermeasures, increasing their procurement of precision tracking systems by 15%. Meanwhile, Japan leads in healthcare innovation, integrating non-contact vital sign monitoring systems and autonomous transport telemetry to support an aging demographic efficiently.

Market Dynamics

Our researchers analyzed the data with 2025 as the base year, along with the key drivers, trends, and challenges. A holistic analysis of drivers will help companies refine their marketing strategies to gain a competitive advantage.

  • The integration of high-frequency spectrum into modern telecommunications and sensing architectures has fundamentally elevated the operational capabilities of enterprise networks. Telecommunications operators are increasingly deploying millimeter wave phased array antennas to dynamically steer signals around physical obstacles, ensuring continuous connectivity in dense metropolitan areas.
  • This architectural shift heavily supports high frequency fixed wireless access, which allows service providers to bypass expensive fiber-optic trenching while delivering fiber-like speeds to residential and commercial premises. Organizations adopting these wireless backhaul solutions typically experience equipment deployment times that are approximately 40% faster than traditional wired infrastructure installations, significantly streamlining operational planning and accelerating time-to-market.
  • Furthermore, the automotive industry relies heavily on automotive millimeter wave radar sensors to power advanced driver assistance systems, providing critical high-resolution spatial awareness required for safe autonomous navigation under adverse weather conditions. To support these processing requirements while maintaining thermal stability, hardware manufacturers are utilizing silicon germanium millimeter wave components, which offer superior performance in compact, power-efficient form factors.
  • Concurrently, base station developers are highly focused on improving gallium nitride power amplifier efficiency, allowing high-frequency transmitters to maintain extended transmission ranges without generating excessive heat. By optimizing these critical semiconductor elements, equipment manufacturers ensure that high-capacity networks remain resilient and economically viable, thereby cementing high-frequency technology as the backbone of next-generation digital economies.
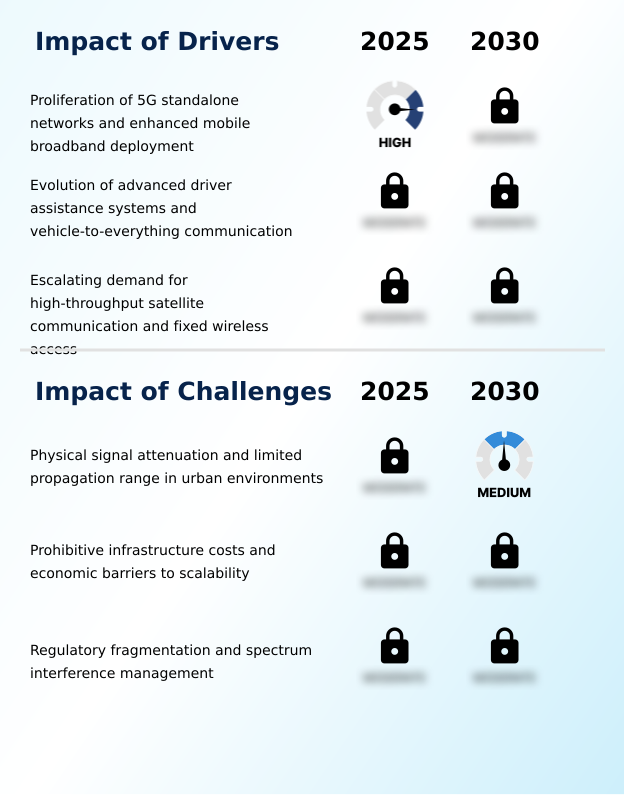
What are the key market drivers leading to the rise in the adoption of Millimeter Wave Technology Industry?

  • The proliferation of 5G standalone networks and the accelerated deployment of enhanced mobile broadband infrastructure are serving as the primary drivers propelling market expansion.

  • Expanding bandwidth requirements across commercial and industrial domains serve as the primary catalyst propelling the Millimeter Wave Technology sector. Modern digital applications demand multi-gigabit data transfer and ultra-low latency communication, compelling governments to expedite high-frequency spectrum allocation.
  • This regulatory support enables internet service providers to rapidly deploy fixed wireless access hardware, effectively bridging connectivity gaps in underserved regions.
  • Organizations switching to these wireless broadband alternatives have successfully lowered infrastructure installation costs by 40% and accelerated network activation times by 25%.
  • Concurrently, the automotive industry is a massive demand driver, as vehicle manufacturers heavily integrate advanced driver assistance sensors to achieve superior spatial awareness.
  • The reliance on high-definition radar tracking ensures vehicles can navigate severe weather conditions safely, reducing autonomous braking failure rates by 15% and driving sustained hardware procurement.

What are the market trends shaping the Millimeter Wave Technology Industry?

  • The integration of artificial intelligence for enhanced beamforming and signal management represents a defining trend in the market. This advancement enables telecommunications operators to dynamically adjust antenna arrays, minimizing packet loss and optimizing continuous high-speed connectivity.

  • The transition toward software-defined network architectures is revolutionizing the Millimeter Wave Technology sector, compelling operators to deploy highly intelligent hardware. Telecommunications providers are rapidly executing small cell network densification to mitigate localized data congestion, integrating smart city network nodes that interact dynamically with autonomous infrastructure.
  • This shift is driven by the widespread implementation of adaptive beamforming, which allows base stations to predict user movement and steer signals accordingly. Consequently, enterprises adopting these dynamic arrays have reduced network downtime by 30% while improving real-time data delivery rates by 18%.
  • To support these complex operations without escalating costs, manufacturers are leveraging advanced silicon-germanium process technologies to produce cost-effective, energy-efficient multi-band transceiver solutions. Furthermore, the migration toward a fully virtualized cloud-native radio access network enables operators to manage high-frequency resources remotely, significantly reducing the maintenance overhead associated with physical tower adjustments.

What challenges does the Millimeter Wave Technology Industry face during its growth?

  • Physical signal attenuation and the inherently limited propagation range within dense urban environments pose significant operational challenges to market growth.

  • Severe physical signal degradation and complex hardware engineering present formidable structural hurdles for the Millimeter Wave Technology sector. High-frequency signals suffer from massive atmospheric absorption, necessitating strict line-of-sight connection requirements that are incredibly difficult to maintain in dense urban environments.
  • Engineers face significant technical friction when designing signal attenuation mitigation strategies, as maintaining spectral purity requires highly sensitive voltage-controlled oscillators and phase-locked loops. The integration of advanced low-noise amplifiers is mandatory to prevent data corruption, yet these components dramatically increase the overall thermal output and unit cost of transceiver modules.
  • Consequently, operators attempting wide-area deployments have encountered a 35% increase in capital expenditures per site and a 20% reduction in effective indoor penetration. These limitations heavily restrict broader adoption in sectors like industrial automated inspection, where signal reliability remains compromised by physical factory obstructions.

Exclusive Technavio Analysis on Customer Landscape

The millimeter wave technology market forecasting report includes the adoption lifecycle of the market, covering from the innovator’s stage to the laggard’s stage. It focuses on adoption rates in different regions based on penetration. Furthermore, the millimeter wave technology market report also includes key purchase criteria and drivers of price sensitivity to help companies evaluate and develop their market growth analysis strategies.
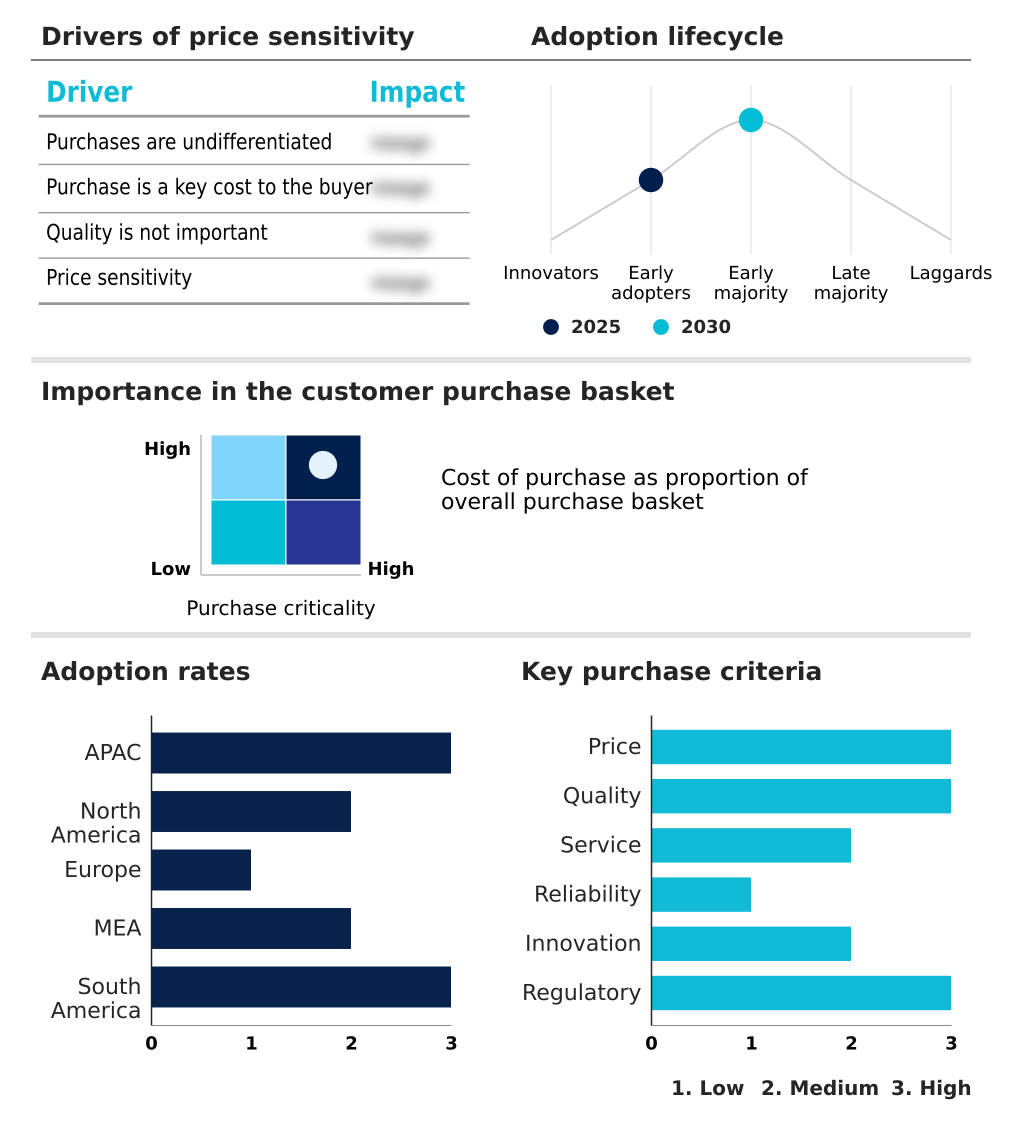
Customer Landscape of Millimeter Wave Technology Industry

Competitive Landscape

Companies are implementing various strategies, such as strategic alliances, millimeter wave technology market forecast, partnerships, mergers and acquisitions, geographical expansion, and product/service launches, to enhance their presence in the industry.

Analog Devices Inc. - The vendor provides advanced millimeter wave components, including precision microwave upconverters and radar transmitters, engineered to deliver robust high-frequency connectivity and superior signal processing across demanding industrial applications.

The industry research and growth report includes detailed analyses of the competitive landscape of the market and information about key companies, including:

  • Analog Devices Inc.
  • Anritsu Corp.
  • Aviat Networks Inc.
  • BridgeWave Communications
  • Broadcom Inc.
  • Ceragon Networks Ltd.
  • Fujitsu Ltd.
  • Infineon Technologies AG
  • Keysight Technologies Inc.
  • Movandi Corp.
  • Murata Manufacturing Co. Ltd.
  • NEC Corp.
  • Nokia Corp.
  • NXP Semiconductors NV
  • Qorvo Inc.
  • Skyworks Solutions Inc.
  • Smiths Interconnect Group Ltd.
  • TDK Corp.
  • Telefonaktiebolaget Ericsson
  • Texas Instruments Inc.

Qualitative and quantitative analysis of companies has been conducted to help clients understand the wider business environment as well as the strengths and weaknesses of key industry players. Data is qualitatively analyzed to categorize companies as pure play, category-focused, industry-focused, and diversified; it is quantitatively analyzed to categorize companies as dominant, leading, strong, tentative, and weak.

Recent Development and News in Millimeter wave technology market

  • In the Communications Equipment industry, the aggressive deployment of 5G infrastructure has accelerated the densification of micro-base stations, directly impacting Millimeter Wave Technology demand by requiring high-density spatial multiplexing hardware that improves network capacity by over 40%.
  • The global regulatory harmonization of the 26 GHz and 28 GHz spectrum bands has standardized high-frequency allocations, triggering a 25% surge in the production of compatible millimeter wave transceiver modules for commercial enterprise networks.
  • Advancements in automated manufacturing processes for semiconductor fabrication have lowered the unit cost of gallium nitride wafers, enabling a 15% reduction in production expenses for millimeter wave power amplifiers used in telecommunication towers.
  • The rapid transition toward software-defined radio architectures has facilitated dynamic network configuration capabilities, thereby boosting the integration of millimeter wave antennas that require real-time beam tracking to maintain gigabit speeds in congested urban corridors.

Dive into Technavio’s robust research methodology, blending expert interviews, extensive data synthesis, and validated models for unparalleled Millimeter Wave Technology Market insights. See full methodology.

Market Scope
Page number 329
Base year 2025
Historic period 2020-2024
Forecast period 2026-2030
Growth momentum & CAGR Accelerate at a CAGR of 19.3%
Market growth 2026-2030 USD 5895.1 million
Market structure Fragmented
YoY growth 2025-2026(%) 18.3%
Key countries China, Japan, India, South Korea, Australia, Indonesia, US, Canada, Mexico, Germany, UK, France, Italy, Spain, The Netherlands, Saudi Arabia, UAE, South Africa, Turkey, Israel, Brazil, Argentina and Chile
Competitive landscape Leading Companies, Market Positioning of Companies, Competitive Strategies, and Industry Risks

Request Free Sample

Research Analyst Overview

  • The Millimeter Wave Technology ecosystem is undergoing a profound transformation as commercial telecommunications and defense sectors aggressively upgrade their high-frequency capabilities. Original equipment manufacturers are increasingly leveraging dynamic channel allocation to manage intense data traffic across congested urban grids, ensuring seamless connectivity for enterprise applications.
  • The strategic integration of advanced beamforming algorithms enables network operators to actively steer signals around atmospheric blockages, directly reducing signal dropouts. Companies that have implemented these intelligent routing protocols report a 22% improvement in overall network reliability compared to static transmission architectures. Furthermore, the miniaturization of hardware utilizing a monolithic microwave integrated circuit allows for highly compact sensor designs.
  • This miniaturization drives the adoption of integrated antenna-in-package topologies, which significantly lower thermal output in commercial mobile devices. In the security and medical sectors, scanners utilizing non-ionizing electromagnetic radiation are replacing legacy detection systems, providing high-resolution imaging without biological risk.
  • Meanwhile, defense agencies are accelerating their deployment of active electronically scanned arrays to maintain superior spatial tracking, pushing research steadily toward sub-terahertz frequency ranges to secure next-generation tactical advantages.

What are the Key Data Covered in this Millimeter Wave Technology Market Research and Growth Report?

  • What is the expected growth of the Millimeter Wave Technology Market between 2026 and 2030?

    • USD 5.90 billion, at a CAGR of 19.3%

  • What segmentation does the market report cover?

    • The report is segmented by Component (Antennas and transceivers, Communication and networking components, RF and radio components, Frequency sources and related, and Others), Product Type (Telecommunication equipment, Radar and satellite communication systems, Imaging systems, and Others), Application (Telecom infrastructure, Automotive, Military and defense, Mobile and consumer devices, and Others) and Geography (APAC, North America, Europe, Middle East and Africa, South America)

  • Which regions are analyzed in the report?

    • APAC, North America, Europe, Middle East and Africa and South America

  • What are the key growth drivers and market challenges?

    • Proliferation of 5G standalone networks and enhanced mobile broadband deployment, Physical signal attenuation and limited propagation range in urban environments

  • Who are the major players in the Millimeter Wave Technology Market?

    • Analog Devices Inc., Anritsu Corp., Aviat Networks Inc., BridgeWave Communications, Broadcom Inc., Ceragon Networks Ltd., Fujitsu Ltd., Infineon Technologies AG, Keysight Technologies Inc., Movandi Corp., Murata Manufacturing Co. Ltd., NEC Corp., Nokia Corp., NXP Semiconductors NV, Qorvo Inc., Skyworks Solutions Inc., Smiths Interconnect Group Ltd., TDK Corp., Telefonaktiebolaget Ericsson and Texas Instruments Inc.

Market Research Insights

  • The Millimeter Wave Technology market fundamentally reshapes high-speed connectivity and precision sensing capabilities. As operators execute macro network expansion, the deployment of smart city network nodes has accelerated, improving urban data throughput by 35%. Hardware suppliers are focusing on signal attenuation mitigation to overcome path loss, leading to a 20% increase in the reliability of high-capacity micro-backhaul links.
  • Additionally, the integration of advanced driver assistance sensors into commercial fleets has enhanced collision avoidance accuracy by 15%, reducing liability costs for logistics firms. By leveraging strategic high-frequency spectrum allocation, enterprises are achieving unprecedented operational efficiency and establishing robust communication frameworks that bypass legacy infrastructure limitations.

We can help! Our analysts can customize this millimeter wave technology market research report to meet your requirements.

Get in touch

1. Executive Summary

1.1 Market overview

Executive Summary - Chart on Market Overview
Executive Summary - Data Table on Market Overview
Executive Summary - Chart on Global Market Characteristics
Executive Summary - Chart on Market by Geography
Executive Summary - Chart on Market Segmentation by Component
Executive Summary - Chart on Market Segmentation by Product Type
Executive Summary - Chart on Market Segmentation by Application
Executive Summary - Chart on Incremental Growth
Executive Summary - Data Table on Incremental Growth
Executive Summary - Chart on Company Market Positioning

2. Technavio Analysis

2.1 Analysis of price sensitivity, lifecycle, customer purchase basket, adoption rates, and purchase criteria

2.2 Criticality of inputs and Factors of differentiation

Chart on Overview on criticality of inputs and factors of differentiation

2.3 Factors of disruption

Chart on Overview on factors of disruption

2.4 Impact of drivers and challenges

Chart on Impact of drivers and challenges in 2025 and 2030

3. Market Landscape

3.1 Market ecosystem

Chart on Parent Market
Data Table on - Parent Market

3.2 Market characteristics

Chart on Market characteristics analysis

3.3 Value chain analysis

Chart on Value chain analysis

4. Market Sizing

4.1 Market definition

Data Table on Offerings of companies included in the market definition

4.2 Market segment analysis

Market segments

4.3 Market size 2025

4.4 Market outlook: Forecast for 2025-2030

Chart on Global - Market size and forecast 2025-2030 ($ million)
Data Table on Global - Market size and forecast 2025-2030 ($ million)
Chart on Global Market: Year-over-year growth 2025-2030 (%)
Data Table on Global Market: Year-over-year growth 2025-2030 (%)

5. Historic Market Size

5.1 Global Millimeter Wave Technology Market 2020 - 2024

Historic Market Size - Data Table on Global Millimeter Wave Technology Market 2020 - 2024 ($ million)

5.2 Component segment analysis 2020 - 2024

Historic Market Size - Component Segment 2020 - 2024 ($ million)

5.3 Product Type segment analysis 2020 - 2024

Historic Market Size - Product Type Segment 2020 - 2024 ($ million)

5.4 Application segment analysis 2020 - 2024

Historic Market Size - Application Segment 2020 - 2024 ($ million)

5.5 Geography segment analysis 2020 - 2024

Historic Market Size - Geography Segment 2020 - 2024 ($ million)

5.6 Country segment analysis 2020 - 2024

Historic Market Size - Country Segment 2020 - 2024 ($ million)

6. Qualitative Analysis

6.1 Impact of AI on Global Millimeter Wave Technology Market

6.2 Impact of geopolitical conflicts on Global Millimeter Wave Technology Market

7. Five Forces Analysis

7.1 Five forces summary

Five forces analysis - Comparison between 2025 and 2030

7.2 Bargaining power of buyers

Bargaining power of buyers - Impact of key factors 2025 and 2030

7.3 Bargaining power of suppliers

Bargaining power of suppliers - Impact of key factors in 2025 and 2030

7.4 Threat of new entrants

Threat of new entrants - Impact of key factors in 2025 and 2030

7.5 Threat of substitutes

Threat of substitutes - Impact of key factors in 2025 and 2030

7.6 Threat of rivalry

Threat of rivalry - Impact of key factors in 2025 and 2030

7.7 Market condition

Chart on Market condition - Five forces 2025 and 2030

8. Market Segmentation by Component

8.1 Market segments

Chart on Component - Market share 2025-2030 (%)
Data Table on Component - Market share 2025-2030 (%)

8.2 Comparison by Component

Chart on Comparison by Component
Data Table on Comparison by Component

8.3 Antennas and transceivers - Market size and forecast 2025-2030

Chart on Antennas and transceivers - Market size and forecast 2025-2030 ($ million)
Data Table on Antennas and transceivers - Market size and forecast 2025-2030 ($ million)
Chart on Antennas and transceivers - Year-over-year growth 2025-2030 (%)
Data Table on Antennas and transceivers - Year-over-year growth 2025-2030 (%)

8.4 Communication and networking components - Market size and forecast 2025-2030

Chart on Communication and networking components - Market size and forecast 2025-2030 ($ million)
Data Table on Communication and networking components - Market size and forecast 2025-2030 ($ million)
Chart on Communication and networking components - Year-over-year growth 2025-2030 (%)
Data Table on Communication and networking components - Year-over-year growth 2025-2030 (%)

8.5 RF and radio components - Market size and forecast 2025-2030

Chart on RF and radio components - Market size and forecast 2025-2030 ($ million)
Data Table on RF and radio components - Market size and forecast 2025-2030 ($ million)
Chart on RF and radio components - Year-over-year growth 2025-2030 (%)
Data Table on RF and radio components - Year-over-year growth 2025-2030 (%)

8.6 Frequency sources and related - Market size and forecast 2025-2030

Chart on Frequency sources and related - Market size and forecast 2025-2030 ($ million)
Data Table on Frequency sources and related - Market size and forecast 2025-2030 ($ million)
Chart on Frequency sources and related - Year-over-year growth 2025-2030 (%)
Data Table on Frequency sources and related - Year-over-year growth 2025-2030 (%)

8.7 Others - Market size and forecast 2025-2030

Chart on Others - Market size and forecast 2025-2030 ($ million)
Data Table on Others - Market size and forecast 2025-2030 ($ million)
Chart on Others - Year-over-year growth 2025-2030 (%)
Data Table on Others - Year-over-year growth 2025-2030 (%)

8.8 Market opportunity by Component

Market opportunity by Component ($ million)
Data Table on Market opportunity by Component ($ million)

9. Market Segmentation by Product Type

9.1 Market segments

Chart on Product Type - Market share 2025-2030 (%)
Data Table on Product Type - Market share 2025-2030 (%)

9.2 Comparison by Product Type

Chart on Comparison by Product Type
Data Table on Comparison by Product Type

9.3 Telecommunication equipment - Market size and forecast 2025-2030

Chart on Telecommunication equipment - Market size and forecast 2025-2030 ($ million)
Data Table on Telecommunication equipment - Market size and forecast 2025-2030 ($ million)
Chart on Telecommunication equipment - Year-over-year growth 2025-2030 (%)
Data Table on Telecommunication equipment - Year-over-year growth 2025-2030 (%)

9.4 Radar and satellite communication systems - Market size and forecast 2025-2030

Chart on Radar and satellite communication systems - Market size and forecast 2025-2030 ($ million)
Data Table on Radar and satellite communication systems - Market size and forecast 2025-2030 ($ million)
Chart on Radar and satellite communication systems - Year-over-year growth 2025-2030 (%)
Data Table on Radar and satellite communication systems - Year-over-year growth 2025-2030 (%)

9.5 Imaging systems - Market size and forecast 2025-2030

Chart on Imaging systems - Market size and forecast 2025-2030 ($ million)
Data Table on Imaging systems - Market size and forecast 2025-2030 ($ million)
Chart on Imaging systems - Year-over-year growth 2025-2030 (%)
Data Table on Imaging systems - Year-over-year growth 2025-2030 (%)

9.6 Others - Market size and forecast 2025-2030

Chart on Others - Market size and forecast 2025-2030 ($ million)
Data Table on Others - Market size and forecast 2025-2030 ($ million)
Chart on Others - Year-over-year growth 2025-2030 (%)
Data Table on Others - Year-over-year growth 2025-2030 (%)

9.7 Market opportunity by Product Type

Market opportunity by Product Type ($ million)
Data Table on Market opportunity by Product Type ($ million)

10. Market Segmentation by Application

10.1 Market segments

Chart on Application - Market share 2025-2030 (%)
Data Table on Application - Market share 2025-2030 (%)

10.2 Comparison by Application

Chart on Comparison by Application
Data Table on Comparison by Application

10.3 Telecom infrastructure - Market size and forecast 2025-2030

Chart on Telecom infrastructure - Market size and forecast 2025-2030 ($ million)
Data Table on Telecom infrastructure - Market size and forecast 2025-2030 ($ million)
Chart on Telecom infrastructure - Year-over-year growth 2025-2030 (%)
Data Table on Telecom infrastructure - Year-over-year growth 2025-2030 (%)

10.4 Automotive - Market size and forecast 2025-2030

Chart on Automotive - Market size and forecast 2025-2030 ($ million)
Data Table on Automotive - Market size and forecast 2025-2030 ($ million)
Chart on Automotive - Year-over-year growth 2025-2030 (%)
Data Table on Automotive - Year-over-year growth 2025-2030 (%)

10.5 Military and defense - Market size and forecast 2025-2030

Chart on Military and defense - Market size and forecast 2025-2030 ($ million)
Data Table on Military and defense - Market size and forecast 2025-2030 ($ million)
Chart on Military and defense - Year-over-year growth 2025-2030 (%)
Data Table on Military and defense - Year-over-year growth 2025-2030 (%)

10.6 Mobile and consumer devices - Market size and forecast 2025-2030

Chart on Mobile and consumer devices - Market size and forecast 2025-2030 ($ million)
Data Table on Mobile and consumer devices - Market size and forecast 2025-2030 ($ million)
Chart on Mobile and consumer devices - Year-over-year growth 2025-2030 (%)
Data Table on Mobile and consumer devices - Year-over-year growth 2025-2030 (%)

10.7 Others - Market size and forecast 2025-2030

Chart on Others - Market size and forecast 2025-2030 ($ million)
Data Table on Others - Market size and forecast 2025-2030 ($ million)
Chart on Others - Year-over-year growth 2025-2030 (%)
Data Table on Others - Year-over-year growth 2025-2030 (%)

10.8 Market opportunity by Application

Market opportunity by Application ($ million)
Data Table on Market opportunity by Application ($ million)

11. Customer Landscape

11.1 Customer landscape overview

Analysis of price sensitivity, lifecycle, customer purchase basket, adoption rates, and purchase criteria

12. Geographic Landscape

12.1 Geographic segmentation

Chart on Market share by geography 2025-2030 (%)
Data Table on Market share by geography 2025-2030 (%)

12.2 Geographic comparison

Chart on Geographic comparison
Data Table on Geographic comparison

12.3 APAC - Market size and forecast 2025-2030

Chart on APAC - Market size and forecast 2025-2030 ($ million)
Data Table on APAC - Market size and forecast 2025-2030 ($ million)
Chart on APAC - Year-over-year growth 2025-2030 (%)
Data Table on APAC - Year-over-year growth 2025-2030 (%)
Chart on Regional Comparison - APAC
Data Table on Regional Comparison - APAC

12.3.1 China - Market size and forecast 2025-2030

Chart on China - Market size and forecast 2025-2030 ($ million)
Data Table on China - Market size and forecast 2025-2030 ($ million)
Chart on China - Year-over-year growth 2025-2030 (%)
Data Table on China - Year-over-year growth 2025-2030 (%)

12.3.2 Japan - Market size and forecast 2025-2030

Chart on Japan - Market size and forecast 2025-2030 ($ million)
Data Table on Japan - Market size and forecast 2025-2030 ($ million)
Chart on Japan - Year-over-year growth 2025-2030 (%)
Data Table on Japan - Year-over-year growth 2025-2030 (%)

12.3.3 India - Market size and forecast 2025-2030

Chart on India - Market size and forecast 2025-2030 ($ million)
Data Table on India - Market size and forecast 2025-2030 ($ million)
Chart on India - Year-over-year growth 2025-2030 (%)
Data Table on India - Year-over-year growth 2025-2030 (%)

12.3.4 South Korea - Market size and forecast 2025-2030

Chart on South Korea - Market size and forecast 2025-2030 ($ million)
Data Table on South Korea - Market size and forecast 2025-2030 ($ million)
Chart on South Korea - Year-over-year growth 2025-2030 (%)
Data Table on South Korea - Year-over-year growth 2025-2030 (%)

12.3.5 Australia - Market size and forecast 2025-2030

Chart on Australia - Market size and forecast 2025-2030 ($ million)
Data Table on Australia - Market size and forecast 2025-2030 ($ million)
Chart on Australia - Year-over-year growth 2025-2030 (%)
Data Table on Australia - Year-over-year growth 2025-2030 (%)

12.3.6 Indonesia - Market size and forecast 2025-2030

Chart on Indonesia - Market size and forecast 2025-2030 ($ million)
Data Table on Indonesia - Market size and forecast 2025-2030 ($ million)
Chart on Indonesia - Year-over-year growth 2025-2030 (%)
Data Table on Indonesia - Year-over-year growth 2025-2030 (%)

12.4 North America - Market size and forecast 2025-2030

Chart on North America - Market size and forecast 2025-2030 ($ million)
Data Table on North America - Market size and forecast 2025-2030 ($ million)
Chart on North America - Year-over-year growth 2025-2030 (%)
Data Table on North America - Year-over-year growth 2025-2030 (%)
Chart on Regional Comparison - North America
Data Table on Regional Comparison - North America

12.4.1 US - Market size and forecast 2025-2030

Chart on US - Market size and forecast 2025-2030 ($ million)
Data Table on US - Market size and forecast 2025-2030 ($ million)
Chart on US - Year-over-year growth 2025-2030 (%)
Data Table on US - Year-over-year growth 2025-2030 (%)

12.4.2 Canada - Market size and forecast 2025-2030

Chart on Canada - Market size and forecast 2025-2030 ($ million)
Data Table on Canada - Market size and forecast 2025-2030 ($ million)
Chart on Canada - Year-over-year growth 2025-2030 (%)
Data Table on Canada - Year-over-year growth 2025-2030 (%)

12.4.3 Mexico - Market size and forecast 2025-2030

Chart on Mexico - Market size and forecast 2025-2030 ($ million)
Data Table on Mexico - Market size and forecast 2025-2030 ($ million)
Chart on Mexico - Year-over-year growth 2025-2030 (%)
Data Table on Mexico - Year-over-year growth 2025-2030 (%)

12.5 Europe - Market size and forecast 2025-2030

Chart on Europe - Market size and forecast 2025-2030 ($ million)
Data Table on Europe - Market size and forecast 2025-2030 ($ million)
Chart on Europe - Year-over-year growth 2025-2030 (%)
Data Table on Europe - Year-over-year growth 2025-2030 (%)
Chart on Regional Comparison - Europe
Data Table on Regional Comparison - Europe

12.5.1 Germany - Market size and forecast 2025-2030

Chart on Germany - Market size and forecast 2025-2030 ($ million)
Data Table on Germany - Market size and forecast 2025-2030 ($ million)
Chart on Germany - Year-over-year growth 2025-2030 (%)
Data Table on Germany - Year-over-year growth 2025-2030 (%)

12.5.2 UK - Market size and forecast 2025-2030

Chart on UK - Market size and forecast 2025-2030 ($ million)
Data Table on UK - Market size and forecast 2025-2030 ($ million)
Chart on UK - Year-over-year growth 2025-2030 (%)
Data Table on UK - Year-over-year growth 2025-2030 (%)

12.5.3 France - Market size and forecast 2025-2030

Chart on France - Market size and forecast 2025-2030 ($ million)
Data Table on France - Market size and forecast 2025-2030 ($ million)
Chart on France - Year-over-year growth 2025-2030 (%)
Data Table on France - Year-over-year growth 2025-2030 (%)

12.5.4 Italy - Market size and forecast 2025-2030

Chart on Italy - Market size and forecast 2025-2030 ($ million)
Data Table on Italy - Market size and forecast 2025-2030 ($ million)
Chart on Italy - Year-over-year growth 2025-2030 (%)
Data Table on Italy - Year-over-year growth 2025-2030 (%)

12.5.5 Spain - Market size and forecast 2025-2030

Chart on Spain - Market size and forecast 2025-2030 ($ million)
Data Table on Spain - Market size and forecast 2025-2030 ($ million)
Chart on Spain - Year-over-year growth 2025-2030 (%)
Data Table on Spain - Year-over-year growth 2025-2030 (%)

12.5.6 The Netherlands - Market size and forecast 2025-2030

Chart on The Netherlands - Market size and forecast 2025-2030 ($ million)
Data Table on The Netherlands - Market size and forecast 2025-2030 ($ million)
Chart on The Netherlands - Year-over-year growth 2025-2030 (%)
Data Table on The Netherlands - Year-over-year growth 2025-2030 (%)

12.6 Middle East and Africa - Market size and forecast 2025-2030

Chart on Middle East and Africa - Market size and forecast 2025-2030 ($ million)
Data Table on Middle East and Africa - Market size and forecast 2025-2030 ($ million)
Chart on Middle East and Africa - Year-over-year growth 2025-2030 (%)
Data Table on Middle East and Africa - Year-over-year growth 2025-2030 (%)
Chart on Regional Comparison - Middle East and Africa
Data Table on Regional Comparison - Middle East and Africa

12.6.1 Saudi Arabia - Market size and forecast 2025-2030

Chart on Saudi Arabia - Market size and forecast 2025-2030 ($ million)
Data Table on Saudi Arabia - Market size and forecast 2025-2030 ($ million)
Chart on Saudi Arabia - Year-over-year growth 2025-2030 (%)
Data Table on Saudi Arabia - Year-over-year growth 2025-2030 (%)

12.6.2 UAE - Market size and forecast 2025-2030

Chart on UAE - Market size and forecast 2025-2030 ($ million)
Data Table on UAE - Market size and forecast 2025-2030 ($ million)
Chart on UAE - Year-over-year growth 2025-2030 (%)
Data Table on UAE - Year-over-year growth 2025-2030 (%)

12.6.3 South Africa - Market size and forecast 2025-2030

Chart on South Africa - Market size and forecast 2025-2030 ($ million)
Data Table on South Africa - Market size and forecast 2025-2030 ($ million)
Chart on South Africa - Year-over-year growth 2025-2030 (%)
Data Table on South Africa - Year-over-year growth 2025-2030 (%)

12.6.4 Turkey - Market size and forecast 2025-2030

Chart on Turkey - Market size and forecast 2025-2030 ($ million)
Data Table on Turkey - Market size and forecast 2025-2030 ($ million)
Chart on Turkey - Year-over-year growth 2025-2030 (%)
Data Table on Turkey - Year-over-year growth 2025-2030 (%)

12.6.5 Israel - Market size and forecast 2025-2030

Chart on Israel - Market size and forecast 2025-2030 ($ million)
Data Table on Israel - Market size and forecast 2025-2030 ($ million)
Chart on Israel - Year-over-year growth 2025-2030 (%)
Data Table on Israel - Year-over-year growth 2025-2030 (%)

12.7 South America - Market size and forecast 2025-2030

Chart on South America - Market size and forecast 2025-2030 ($ million)
Data Table on South America - Market size and forecast 2025-2030 ($ million)
Chart on South America - Year-over-year growth 2025-2030 (%)
Data Table on South America - Year-over-year growth 2025-2030 (%)
Chart on Regional Comparison - South America
Data Table on Regional Comparison - South America

12.7.1 Brazil - Market size and forecast 2025-2030

Chart on Brazil - Market size and forecast 2025-2030 ($ million)
Data Table on Brazil - Market size and forecast 2025-2030 ($ million)
Chart on Brazil - Year-over-year growth 2025-2030 (%)
Data Table on Brazil - Year-over-year growth 2025-2030 (%)

12.7.2 Argentina - Market size and forecast 2025-2030

Chart on Argentina - Market size and forecast 2025-2030 ($ million)
Data Table on Argentina - Market size and forecast 2025-2030 ($ million)
Chart on Argentina - Year-over-year growth 2025-2030 (%)
Data Table on Argentina - Year-over-year growth 2025-2030 (%)

12.7.3 Chile - Market size and forecast 2025-2030

Chart on Chile - Market size and forecast 2025-2030 ($ million)
Data Table on Chile - Market size and forecast 2025-2030 ($ million)
Chart on Chile - Year-over-year growth 2025-2030 (%)
Data Table on Chile - Year-over-year growth 2025-2030 (%)

12.8 Market opportunity by geography

Market opportunity by geography ($ million)
Data Tables on Market opportunity by geography ($ million)

13. Drivers, Challenges, and Opportunity

13.1 Market drivers

Proliferation of 5G standalone networks and enhanced mobile broadband deployment
Evolution of advanced driver assistance systems and vehicle-to-everything communication
Escalating demand for high-throughput satellite communication and fixed wireless access

13.2 Market challenges

Physical signal attenuation and limited propagation range in urban environments
Prohibitive infrastructure costs and economic barriers to scalability
Regulatory fragmentation and spectrum interference management

13.3 Impact of drivers and challenges

Impact of drivers and challenges in 2025 and 2030

13.4 Market opportunities

Integration of AI for enhanced beamforming and signal management
Proliferation of private millimeter wave networks for industrial automation and industry 4.0
Miniaturization of high-frequency components for consumer electronics and wearables

14. Competitive Landscape

14.1 Overview

14.2

Overview on criticality of inputs and factors of differentiation

14.3 Landscape disruption

Overview on factors of disruption

14.4 Industry risks

Impact of key risks on business

15. Competitive Analysis

15.1 Companies profiled

Companies covered

15.2 Company ranking index

15.3 Market positioning of companies

Matrix on companies position and classification

15.4 Analog Devices Inc.

Analog Devices Inc. - Overview
Analog Devices Inc. - Business segments
Analog Devices Inc. - Key offerings
Analog Devices Inc. - Segment focus
SWOT

15.5 Anritsu Corp.

Anritsu Corp. - Overview
Anritsu Corp. - Business segments
Anritsu Corp. - Key offerings
Anritsu Corp. - Segment focus
SWOT

15.6 Broadcom Inc.

Broadcom Inc. - Overview
Broadcom Inc. - Business segments
Broadcom Inc. - Key news
Broadcom Inc. - Key offerings
Broadcom Inc. - Segment focus
SWOT

15.7 Fujitsu Ltd.

Fujitsu Ltd. - Overview
Fujitsu Ltd. - Business segments
Fujitsu Ltd. - Key offerings
Fujitsu Ltd. - Segment focus
SWOT

15.8 Infineon Technologies AG

Infineon Technologies AG - Overview
Infineon Technologies AG - Business segments
Infineon Technologies AG - Key news
Infineon Technologies AG - Key offerings
Infineon Technologies AG - Segment focus
SWOT

15.9 Keysight Technologies Inc.

Keysight Technologies Inc. - Overview
Keysight Technologies Inc. - Business segments
Keysight Technologies Inc. - Key offerings
Keysight Technologies Inc. - Segment focus
SWOT

15.10 Murata Manufacturing Co. Ltd.

Murata Manufacturing Co. Ltd. - Overview
Murata Manufacturing Co. Ltd. - Business segments
Murata Manufacturing Co. Ltd. - Key offerings
Murata Manufacturing Co. Ltd. - Segment focus
SWOT

15.11 NEC Corp.

NEC Corp. - Overview
NEC Corp. - Business segments
NEC Corp. - Key offerings
NEC Corp. - Segment focus
SWOT

15.12 Nokia Corp.

Nokia Corp. - Overview
Nokia Corp. - Business segments
Nokia Corp. - Key news
Nokia Corp. - Key offerings
Nokia Corp. - Segment focus
SWOT

15.13 NXP Semiconductors NV

NXP Semiconductors NV - Overview
NXP Semiconductors NV - Business segments
NXP Semiconductors NV - Key news
NXP Semiconductors NV - Key offerings
NXP Semiconductors NV - Segment focus
SWOT

15.14 Qorvo Inc.

Qorvo Inc. - Overview
Qorvo Inc. - Business segments
Qorvo Inc. - Key offerings
Qorvo Inc. - Segment focus
SWOT

15.15 Skyworks Solutions Inc.

Skyworks Solutions Inc. - Overview
Skyworks Solutions Inc. - Product / Service
Skyworks Solutions Inc. - Key news
Skyworks Solutions Inc. - Key offerings
SWOT

15.16 TDK Corp.

TDK Corp. - Overview
TDK Corp. - Business segments
TDK Corp. - Key offerings
TDK Corp. - Segment focus
SWOT

15.17 Telefonaktiebolaget Ericsson

Telefonaktiebolaget Ericsson - Overview
Telefonaktiebolaget Ericsson - Business segments
Telefonaktiebolaget Ericsson - Key news
Telefonaktiebolaget Ericsson - Key offerings
Telefonaktiebolaget Ericsson - Segment focus
SWOT

15.18 Texas Instruments Inc.

Texas Instruments Inc. - Overview
Texas Instruments Inc. - Business segments
Texas Instruments Inc. - Key news
Texas Instruments Inc. - Key offerings
Texas Instruments Inc. - Segment focus
SWOT

16. Appendix

16.1 Scope of the report

Market definition
Objectives
Notes and caveats

16.2 Inclusions and exclusions checklist

Inclusions checklist
Exclusions checklist

16.3 Currency conversion rates for US$

16.4 Research methodology

16.5 Data procurement

Information sources

16.6 Data validation

16.7 Validation techniques employed for market sizing

16.8 Data synthesis

16.9 360 degree market analysis

16.10 List of abbreviations

Research Methodology

Technavio presents a detailed picture of the market by way of study, synthesis, and summation of data from multiple sources. The analysts have presented the various facets of the market with a particular focus on identifying the key industry influencers. The data thus presented is comprehensive, reliable, and the result of extensive research, both primary and secondary.

INFORMATION SOURCES

Primary sources

  • Manufacturers and suppliers
  • Channel partners
  • Industry experts
  • Strategic decision makers

Secondary sources

  • Industry journals and periodicals
  • Government data
  • Financial reports of key industry players
  • Historical data
  • Press releases

DATA ANALYSIS

Data Synthesis

  • Collation of data
  • Estimation of key figures
  • Analysis of derived insights

Data Validation

  • Triangulation with data models
  • Reference against proprietary databases
  • Corroboration with industry experts

REPORT WRITING

Qualitative

  • Market drivers
  • Market challenges
  • Market trends
  • Five forces analysis

Quantitative

  • Market size and forecast
  • Market segmentation
  • Geographical insights
  • Competitive landscape

Interested in this report?

Get your sample now to see our research methodology and insights!

Download Now

Frequently Asked Questions

Millimeter Wave Technology market growth will increase by USD 5895.1 million during 2026-2030.

The Millimeter Wave Technology market is expected to grow at a CAGR of 19.3% during 2026-2030.

Millimeter Wave Technology market is segmented by Component (Antennas and transceivers, Communication and networking components, RF and radio components, Frequency sources and related, Others) Product type (Telecommunication equipment, Radar and satellite communication systems, Imaging systems, Others) Application (Telecom infrastructure, Automotive, Military and defense, Mobile and consumer devices, Others)

Analog Devices Inc., Anritsu Corp., Aviat Networks Inc., BridgeWave Communications, Broadcom Inc., Ceragon Networks Ltd., Fujitsu Ltd., Infineon Technologies AG, Keysight Technologies Inc., Movandi Corp., Murata Manufacturing Co. Ltd., NEC Corp., Nokia Corp., NXP Semiconductors NV, Qorvo Inc., Skyworks Solutions Inc., Smiths Interconnect Group Ltd., TDK Corp., Telefonaktiebolaget Ericsson, Texas Instruments Inc. are a few of the key vendors in the Millimeter Wave Technology market.

APAC will register the highest growth rate of 37.7% among the other regions. Therefore, the Millimeter Wave Technology market in APAC is expected to garner significant business opportunities for the vendors during the forecast period.

China, Japan, India, South Korea, Australia, Indonesia, US, Canada, Mexico, Germany, UK, France, Italy, Spain, The Netherlands, Saudi Arabia, UAE, South Africa, Turkey, Israel, Brazil, Argentina, Chile

  • Proliferation of 5G standalone networks and enhanced mobile broadband deployment is the driving factor this market.

The Millimeter Wave Technology market vendors should focus on grabbing business opportunities from the Component segment as it accounted for the largest market share in the base year.
RIA - Research AI Assistant
Ask RIA
