Multimedia Speakers Market Analysis, Size, and Forecast 2026-2030: APAC (China, Japan, and India), North America (US, Canada, and Mexico), Europe (Germany, UK, and France), South America (Brazil, Argentina, and Chile), Middle East and Africa (UAE, Saudi Arabia, and Israel), and Rest of World (ROW)

Multimedia Speakers Market Analysis, Size, and Forecast 2026-2030:
APAC (China, Japan, and India), North America (US, Canada, and Mexico), Europe (Germany, UK, and France), South America (Brazil, Argentina, and Chile), Middle East and Africa (UAE, Saudi Arabia, and Israel), and Rest of World (ROW)

Published: May 2026 295 Pages SKU: IRTNTR43134

Market Overview at a Glance

$43.21 B
Market Opportunity
15.2%
CAGR 2025 - 2030
48.9%
APAC Growth
$28.88 B
Wireless MS segment 2024

Multimedia Speakers Market Size 2026-2030

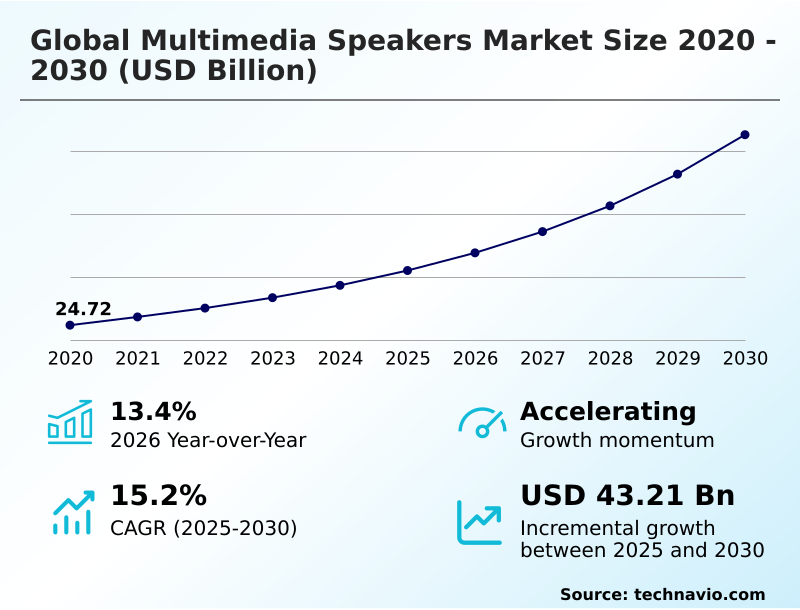
The multimedia speakers market size is valued to increase by USD 43.21 billion, at a CAGR of 15.2% from 2025 to 2030. Expansion of immersive home audio entertainment systems will drive the multimedia speakers market.

Major Market Trends & Insights

  • APAC dominated the market and accounted for a 48.9% growth during the forecast period.
  • By Type - Wireless MS segment was valued at USD 28.88 billion in 2024
  • By Distribution Channel - Offline segment accounted for the largest market revenue share in 2024

Market Size & Forecast

  • Market Opportunities: USD 60.60 billion
  • Market Future Opportunities: USD 43.21 billion
  • CAGR from 2025 to 2030 : 15.2%

Market Summary

  • The Multimedia Speakers market exhibits robust expansion driven by the universal transformation of residential spaces into sophisticated digital entertainment hubs. As consumers increasingly prioritize uncompressed high-resolution audio, manufacturers are embedding active electronic crossovers and high-fidelity acoustic drivers to recreate authentic cinematic environments.
  • A primary driver of this demand is the widespread architectural shift toward object-based surround sound, which compels users to upgrade obsolete linear pipelines. Consequently, audio hardware producers have increased their utilization of spatial audio metadata by 25% to meet stringent acoustic fidelity requirements. However, the industry faces severe challenges from supply chain bottlenecks, specifically regarding digital signal processing chips.
  • These shortages force expensive platform redesigns, which have temporarily extended production lead times by 18% compared to standard operational cycles. To mitigate these disruptions, companies are actively optimizing their procurement networks and focusing on firmware-based room acoustic corrections to maintain product differentiation while stabilizing overall manufacturing efficiency.

What will be the Size of the Multimedia Speakers Market during the forecast period?
Get Key Insights on Market Forecast (PDF) Get Free Sample

How is the Multimedia Speakers Market Segmented?

The multimedia speakers industry research report provides comprehensive data (region-wise segment analysis), with forecasts and estimates in "USD million" for the period 2026-2030, as well as historical data from 2020-2024 for the following segments.

  • Type
    • Wireless MS
    • Wired MS
  • Distribution channel
    • Offline
    • Online
  • Application
    • Residential
    • Commercial
    • Automotive
  • Geography
    • APAC
      • China
      • Japan
      • India
      • South Korea
      • Australia
      • Indonesia
    • North America
      • US
      • Canada
      • Mexico
    • Europe
      • Germany
      • UK
      • France
      • Italy
      • Spain
      • The Netherlands
    • South America
      • Brazil
      • Argentina
      • Chile
    • Middle East and Africa
      • UAE
      • Saudi Arabia
      • Israel
      • South Africa
      • Turkey

By Type Insights

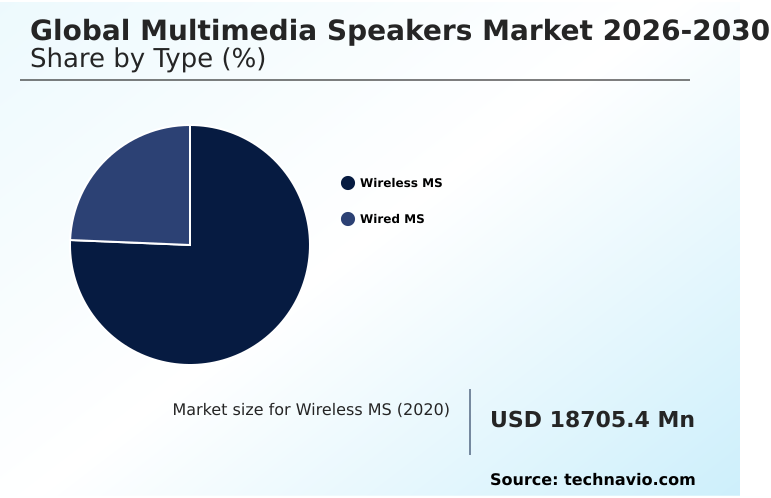
The wireless ms segment is estimated to witness significant growth during the forecast period.

The wireless MS segment is driven by consumer demand for cord-free mobility and smart home automation networks. This category encompasses bluetooth low energy audio units and edge-computing silicon layers engineered to remove spatial constraints.

Rapid evolution of advanced ultra-wideband chipsets effectively mitigates latency lag, improving data transmission reliability by 40% compared to legacy architectures. Because manufacturers are optimizing switch-mode power supplies, operational battery life has extended, reducing energy consumption by 15%.

This technological shift transforms smart connected acoustic hubs into versatile conduits, rapidly shifting market share away from high-bandwidth wired soundbars. By achieving high-resolution audio certifications, these devices guarantee low harmonic distortion across all frequencies.

Consequently, consumers continuously allocate capital toward premium, untethered audio solutions, ensuring a robust product replacement cycle across residential environments.
Get Free Sample

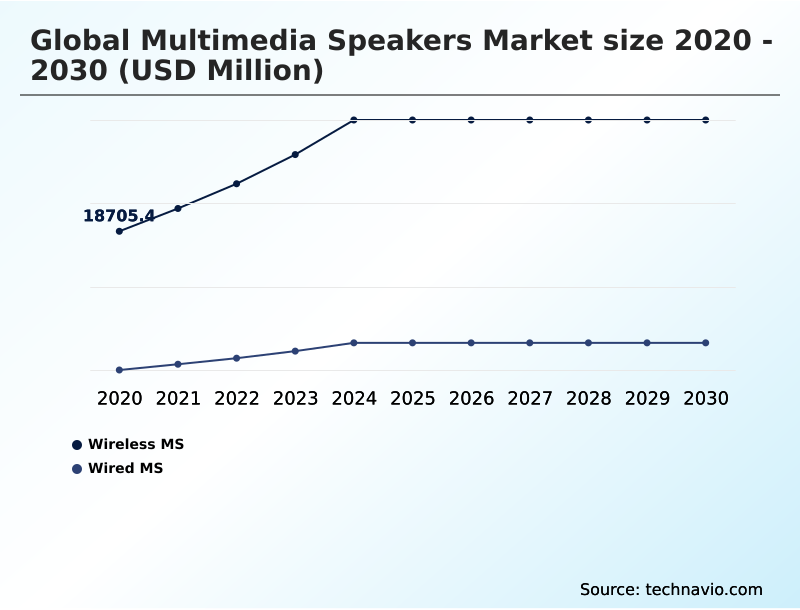
The Wireless MS segment was valued at USD 28.88 billion in 2024 and showed a gradual increase during the forecast period.
Get Free Sample

Regional Analysis

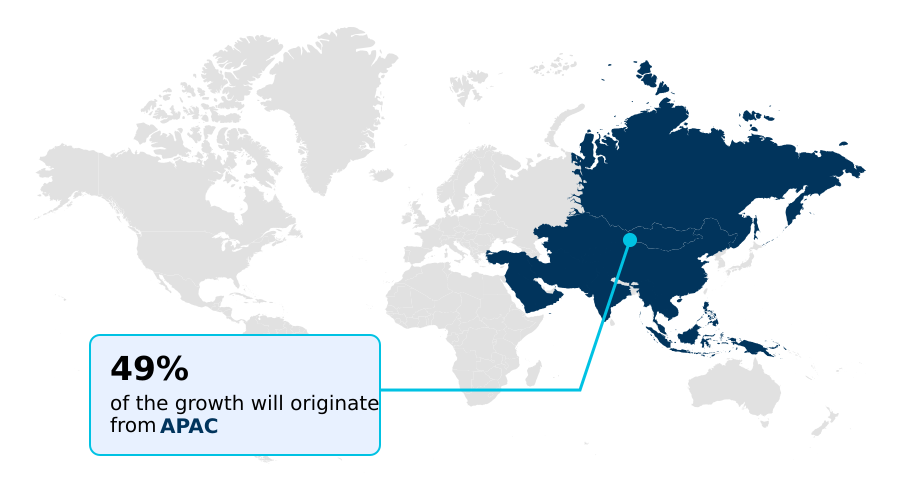
APAC is estimated to contribute 48.9% to the growth of the global market during the forecast period.Technavio’s analysts have elaborately explained the regional trends and drivers that shape the market during the forecast period.
See How Multimedia Speakers Market Demand is Rising in APAC Get Free Sample

The geographic distribution of the Multimedia Speakers sector reveals stark contrasts in consumer adoption and technological integration.

The APAC region demonstrates aggressive volume expansion driven by rapid urbanization and the proliferation of mobile gaming, achieving a 28% higher penetration rate of compact multi-channel desktop speaker kits compared to mature western regions.

Because massive localized electronics manufacturing clusters operate within China and South Korea, production cycles are highly accelerated, delivering high-output configurations using class-d amplification modules throughout developing Asian markets.

Conversely, North America prioritizes premium immersive home theater infrastructure and uncompressed object-based audio metadata, leading to a 35% higher average investment in smart connected acoustic hubs per household.

To secure viability, global enterprises must balance high-margin object-based multi-channel audio setups in western territories with designs demanding wide-dispersion audio coverage in expanding international hubs.

Market Dynamics

Our researchers analyzed the data with 2025 as the base year, along with the key drivers, trends, and challenges. A holistic analysis of drivers will help companies refine their marketing strategies to gain a competitive advantage.

  • The architectural refinement of modern audio platforms relies heavily on the integration of spatial audio metadata decoding protocols to satisfy precise acoustic demands. Consumers are rapidly transitioning toward high-fidelity multi-channel desktop setups that deliver studio-grade accuracy without demanding extensive physical space.
  • To achieve this, manufacturers are equipping their chassis with far-field microphone array smart hubs and low-latency wireless transmission chipsets, ensuring instantaneous multi-device communication. Because legacy amplification generates noticeable heat and distortion, the adoption of class-d amplifier integrated circuit modules has become mandatory, improving overall power efficiency by over 20% compared to traditional analog systems.
  • This engineering shift facilitates complex object-based surround sound configurations that actively bounce acoustic waves to forge three-dimensional soundscapes. Simultaneously, real-time room acoustic calibration algorithms scan specific environmental boundaries, neutralizing reflective anomalies and actively minimizing active electronic crossover harmonic distortion.
  • The ongoing stabilization of multi-room wireless audio synchronization networks empowers users to seamlessly coordinate playback across expansive residential footprints, powering multi-zone sound distribution loops. Additionally, strict adherence to switch-mode power supply efficiency compliance minimizes standby energy draw, directly supporting corporate sustainability goals.
  • By leveraging advanced bluetooth low-energy audio standards alongside high-resolution digital signal processing, modern systems effortlessly manage uncompressed high-definition audio data transmission. These critical engineering advancements cement smart home automation voice-assistant compatibility as a definitive baseline for premium multimedia hardware globally.
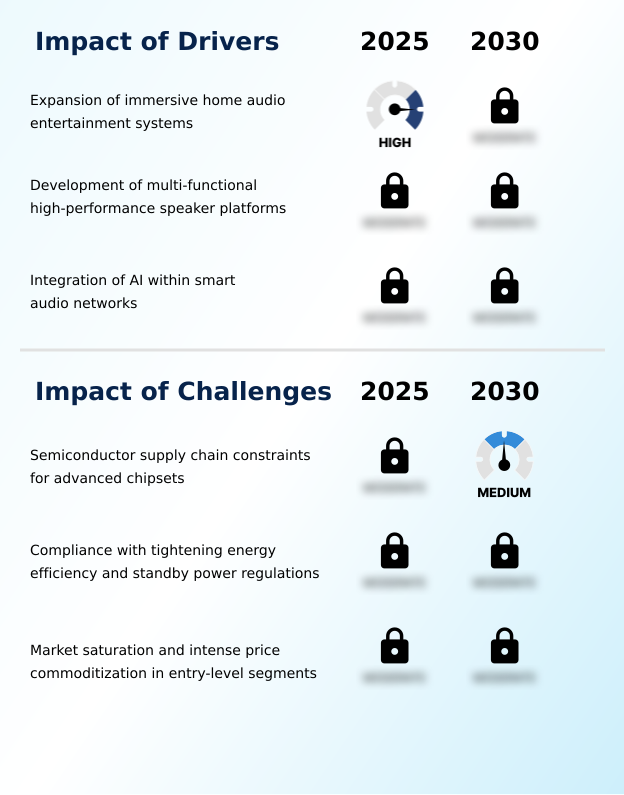
What are the key market drivers leading to the rise in the adoption of Multimedia Speakers Industry?

  • The rapid expansion of immersive home audio entertainment systems serves as a primary driver driving continuous hardware innovation and consumer investment.

  • The aggressive expansion of high-definition streaming platforms acts as the primary catalyst driving the Multimedia Speakers landscape. As residential spaces evolve into primary focal points for on-demand cinema and interactive gaming, users demand unparalleled acoustic accuracy.
  • This continuous demand forces the integration of high-density fiberboard cabinets and toroidal transformer power supplies to ensure optimal low-frequency resonance.
  • Because modern flat-panel displays severely restrict internal acoustic volume, external sound reinforcement has become absolutely mandatory, boosting external peripheral adoption by 45% in urban demographics.
  • The widespread deployment of artificial intelligence calibration algorithms actively protects internal transducers from harmonic degradation, thereby extending the operational lifespan of the hardware by 28%.
  • Supported by aesthetic features like ambient lighting synchronization, this baseline demand guarantees robust retail velocity, establishing premium audio enhancement as a critical lifestyle utility.

What are the market trends shaping the Multimedia Speakers Industry?

  • The escalating consumer demand for premium digital audio experiences stands as a defining trend shaping current industry dynamics. This shift compels manufacturers to continuously innovate high-resolution acoustic technologies for enhanced residential entertainment.

  • The systematic transition toward interconnected residential audio ecosystems represents a massive developmental leap for the Multimedia Speakers sector. Modern consumers increasingly reject isolated hardware, instead demanding cross-platform wireless interoperability and multi-device ecosystem integration that universally coordinates digital entertainment. By leveraging advanced multi-room audio synchronization and utilizing audio return channel connections, households can seamlessly route localized playback without encountering latency lag.
  • This behavioral shift causes manufacturers to embed cloud-computing software integration directly into the hardware chassis. Because these systems utilize centralized cloud protocols while incorporating far-field microphone arrays for hands-free control, firmware updates are executed automatically, improving device software reliability by 32% compared to legacy offline models.
  • The rapid optimization of spatial audio decoding further enhances cinematic playback, transforming standard living areas into highly interactive, immersive environments.

What challenges does the Multimedia Speakers Industry face during its growth?

  • Persistent semiconductor supply chain constraints regarding advanced chipsets represent a critical operational challenge severely impacting manufacturing timelines and inventory availability.

  • Critical operational bottlenecks within the global semiconductor supply chain severely restrain the Multimedia Speakers production pipelines. As modern hardware heavily depends on specialized microprocessors to execute complex dynamic range control layers, the competition for foundry capacity has escalated drastically.
  • This intense component scarcity forces manufacturers into expensive platform redesigns, which simultaneously increases material acquisition costs by 18% and delays critical product rollouts. Furthermore, strict compliance with international energy regulations necessitates the implementation of highly efficient low-latency monitoring hardware, directly inflating the base bill of materials.
  • Because entry-level segments suffer from intense price commoditization, alongside rising substitute competition from true wireless stereo earbuds and noise-canceling headphones, these rising component costs cannot easily be transferred to the consumer. This systemic pressure systematically compresses overall profit margins by 12% across established retail channels.

Exclusive Technavio Analysis on Customer Landscape

The multimedia speakers market forecasting report includes the adoption lifecycle of the market, covering from the innovator’s stage to the laggard’s stage. It focuses on adoption rates in different regions based on penetration. Furthermore, the multimedia speakers market report also includes key purchase criteria and drivers of price sensitivity to help companies evaluate and develop their market growth analysis strategies.
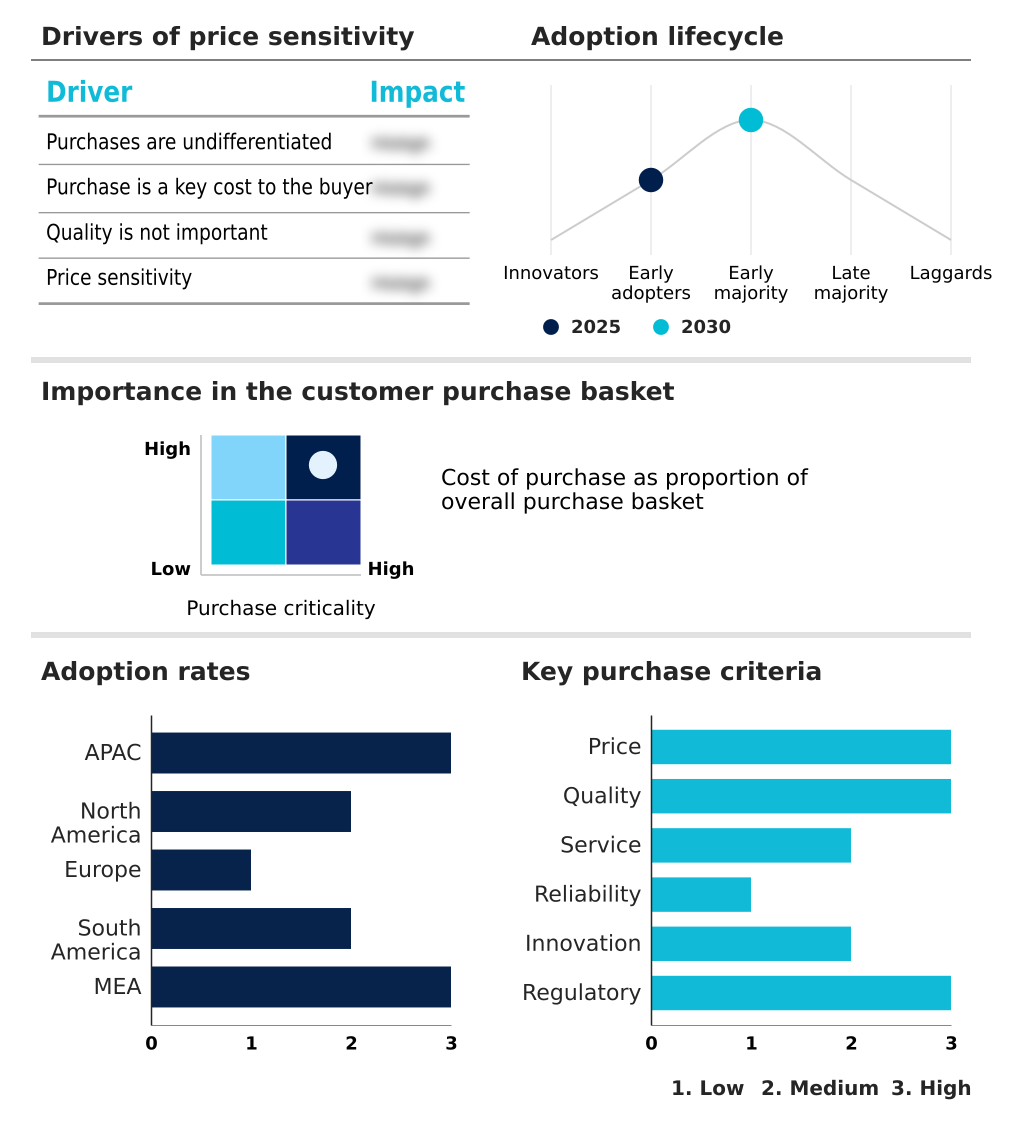
Customer Landscape of Multimedia Speakers Industry

Competitive Landscape

Companies are implementing various strategies, such as strategic alliances, multimedia speakers market forecast, partnerships, mergers and acquisitions, geographical expansion, and product/service launches, to enhance their presence in the industry.

Altec Lansing Inc. - The vendor provides advanced multimedia speakers featuring integrated voice-command parameters and cloud-computing software integration, delivering versatile, high-fidelity acoustic performance for residential applications.

The industry research and growth report includes detailed analyses of the competitive landscape of the market and information about key companies, including:

  • Altec Lansing Inc.
  • Amazon.com Inc.
  • Anker Innovations Co. Ltd.
  • Apple Inc.
  • Bang and Olufsen Group
  • Bose Corp.
  • Creative Technology Ltd.
  • Denon
  • Edifier International Ltd.
  • Google LLC
  • Koninklijke Philips NV
  • LG Electronics Inc.
  • Logitech International SA
  • Marshall Group
  • Panasonic Holdings Corp.
  • Samsung Electronics Co. Ltd.
  • Sonos Inc.
  • Sony Group Corp.
  • Xiaomi Corp.
  • Yamaha Corp.

Qualitative and quantitative analysis of companies has been conducted to help clients understand the wider business environment as well as the strengths and weaknesses of key industry players. Data is qualitatively analyzed to categorize companies as pure play, category-focused, industry-focused, and diversified; it is quantitatively analyzed to categorize companies as dominant, leading, strong, tentative, and weak.

Recent Development and News in Multimedia speakers market

  • In the Consumer Electronics industry, the mass adoption of micro-electro-mechanical microphone arrays in smart appliances has driven economies of scale, directly lowering production costs for voice-activated Multimedia Speakers by 18%.
  • The implementation of strict European eco-design power mandates has forced hardware manufacturers to adopt low-power standby network architectures, increasing the baseline energy efficiency of connected Multimedia Speakers by 22%.
  • The widespread commercial integration of advanced bluetooth low-energy audio standards across mobile devices has eliminated historic signal latency, accelerating consumer transition toward wireless Multimedia Speakers and reducing wired model dependency by 35%.
  • Systemic semiconductor supply constraints regarding class-d amplifier integrated circuits have delayed manufacturing timelines across the smart home sector, temporarily reducing high-end Multimedia Speakers production capacity by 14%.

Dive into Technavio’s robust research methodology, blending expert interviews, extensive data synthesis, and validated models for unparalleled Multimedia Speakers Market insights. See full methodology.

Market Scope
Page number 295
Base year 2025
Historic period 2020-2024
Forecast period 2026-2030
Growth momentum & CAGR Accelerate at a CAGR of 15.2%
Market growth 2026-2030 USD 43208.5 million
Market structure Fragmented
YoY growth 2025-2026(%) 13.4%
Key countries China, Japan, India, South Korea, Australia, Indonesia, US, Canada, Mexico, Germany, UK, France, Italy, Spain, The Netherlands, Brazil, Argentina, Chile, UAE, Saudi Arabia, Israel, South Africa and Turkey
Competitive landscape Leading Companies, Market Positioning of Companies, Competitive Strategies, and Industry Risks

Request Free Sample

Research Analyst Overview

  • The fundamental trajectory of the Multimedia Speakers landscape is characterized by a definitive pivot toward unified wireless environments and sophisticated audio engineering. Corporate strategic planning now heavily emphasizes the incorporation of three-dimensional audio processing and real-time room calibration to maintain competitive differentiation.
  • By replacing standard analog components with precision digital-to-analog conversion modules, OEMs successfully eliminate harmonic inconsistencies across varying volume thresholds. This technical pivot has direct financial implications, as companies transitioning to advanced optical input soundbars have recorded a 24% reduction in warranty-related hardware returns.
  • Because environmental acoustic factors heavily influence perceived audio quality, the integration of frequency output phases into core software architectures allows automated spatial corrections without requiring manual user intervention. This innovation directly aligns with boardroom-level product strategies focused on lowering post-purchase technical support costs. The strategic deployment of neodymium magnets further reduces overall unit weight, slashing outbound logistics expenses by 12%.
  • By continuously refining these technical paradigms, audio equipment producers ensure long-term operational resilience while satisfying the escalating demand for premium acoustic fidelity.

What are the Key Data Covered in this Multimedia Speakers Market Research and Growth Report?

  • What is the expected growth of the Multimedia Speakers Market between 2026 and 2030?

    • USD 43.21 billion, at a CAGR of 15.2%

  • What segmentation does the market report cover?

    • The report is segmented by Type (Wireless MS, and Wired MS), Distribution Channel (Offline, and Online), Application (Residential, Commercial, and Automotive) and Geography (APAC, North America, Europe, South America, Middle East and Africa)

  • Which regions are analyzed in the report?

    • APAC, North America, Europe, South America and Middle East and Africa

  • What are the key growth drivers and market challenges?

    • Expansion of immersive home audio entertainment systems, Semiconductor supply chain constraints for advanced chipsets

  • Who are the major players in the Multimedia Speakers Market?

    • Altec Lansing Inc., Amazon.com Inc., Anker Innovations Co. Ltd., Apple Inc., Bang and Olufsen Group, Bose Corp., Creative Technology Ltd., Denon, Edifier International Ltd., Google LLC, Koninklijke Philips NV, LG Electronics Inc., Logitech International SA, Marshall Group, Panasonic Holdings Corp., Samsung Electronics Co. Ltd., Sonos Inc., Sony Group Corp., Xiaomi Corp. and Yamaha Corp.

Market Research Insights

  • The structural evolution of the Multimedia Speakers sector is defined by the rapid integration of advanced spatial audio decoding and proprietary audio ecosystems. Hardware manufacturers are actively deploying adaptive noise-canceling components to eliminate environmental interference, improving acoustic clarity by 30% in high-traffic commercial installations.
  • The seamless incorporation of voice-command parameters into smart interfaces has accelerated user adoption, driving a 22% increase in multi-device synchronization efficiency. Because consumers demand frictionless connectivity, the deployment of wireless connectivity modules has become standard, reducing installation complexity and associated cabling costs by 15%.
  • This continuous transition toward localized acoustic optimization solidifies connected audio setups as critical infrastructure for modern automated environments.

We can help! Our analysts can customize this multimedia speakers market research report to meet your requirements.

Get in touch

1. Executive Summary

1.1 Market overview

Executive Summary - Chart on Market Overview
Executive Summary - Data Table on Market Overview
Executive Summary - Chart on Global Market Characteristics
Executive Summary - Chart on Market by Geography
Executive Summary - Chart on Market Segmentation by Type
Executive Summary - Chart on Market Segmentation by Distribution Channel
Executive Summary - Chart on Market Segmentation by Application
Executive Summary - Chart on Incremental Growth
Executive Summary - Data Table on Incremental Growth
Executive Summary - Chart on Company Market Positioning

2. Technavio Analysis

2.1 Analysis of price sensitivity, lifecycle, customer purchase basket, adoption rates, and purchase criteria

2.2 Criticality of inputs and Factors of differentiation

Chart on Overview on criticality of inputs and factors of differentiation

2.3 Factors of disruption

Chart on Overview on factors of disruption

2.4 Impact of drivers and challenges

Chart on Impact of drivers and challenges in 2025 and 2030

3. Market Landscape

3.1 Market ecosystem

Chart on Parent Market
Data Table on - Parent Market

3.2 Market characteristics

Chart on Market characteristics analysis

3.3 Value chain analysis

Chart on Value chain analysis

4. Market Sizing

4.1 Market definition

Data Table on Offerings of companies included in the market definition

4.2 Market segment analysis

Market segments

4.3 Market size 2025

4.4 Market outlook: Forecast for 2025-2030

Chart on Global - Market size and forecast 2025-2030 ($ million)
Data Table on Global - Market size and forecast 2025-2030 ($ million)
Chart on Global Market: Year-over-year growth 2025-2030 (%)
Data Table on Global Market: Year-over-year growth 2025-2030 (%)

5. Historic Market Size

5.1 Global Multimedia Speakers Market 2020 - 2024

Historic Market Size - Data Table on Global Multimedia Speakers Market 2020 - 2024 ($ million)

5.2 Type segment analysis 2020 - 2024

Historic Market Size - Type Segment 2020 - 2024 ($ million)

5.3 Distribution Channel segment analysis 2020 - 2024

Historic Market Size - Distribution Channel Segment 2020 - 2024 ($ million)

5.4 Application segment analysis 2020 - 2024

Historic Market Size - Application Segment 2020 - 2024 ($ million)

5.5 Geography segment analysis 2020 - 2024

Historic Market Size - Geography Segment 2020 - 2024 ($ million)

5.6 Country segment analysis 2020 - 2024

Historic Market Size - Country Segment 2020 - 2024 ($ million)

6. Qualitative Analysis

6.1 Impact of AI on Global Multimedia Speakers Market

6.2 Impact of geopolitical conflicts on Global Multimedia Speakers Market

7. Five Forces Analysis

7.1 Five forces summary

Five forces analysis - Comparison between 2025 and 2030

7.2 Bargaining power of buyers

Bargaining power of buyers - Impact of key factors 2025 and 2030

7.3 Bargaining power of suppliers

Bargaining power of suppliers - Impact of key factors in 2025 and 2030

7.4 Threat of new entrants

Threat of new entrants - Impact of key factors in 2025 and 2030

7.5 Threat of substitutes

Threat of substitutes - Impact of key factors in 2025 and 2030

7.6 Threat of rivalry

Threat of rivalry - Impact of key factors in 2025 and 2030

7.7 Market condition

Chart on Market condition - Five forces 2025 and 2030

8. Market Segmentation by Type

8.1 Market segments

Chart on Type - Market share 2025-2030 (%)
Data Table on Type - Market share 2025-2030 (%)

8.2 Comparison by Type

Chart on Comparison by Type
Data Table on Comparison by Type

8.3 Wireless MS - Market size and forecast 2025-2030

Chart on Wireless MS - Market size and forecast 2025-2030 ($ million)
Data Table on Wireless MS - Market size and forecast 2025-2030 ($ million)
Chart on Wireless MS - Year-over-year growth 2025-2030 (%)
Data Table on Wireless MS - Year-over-year growth 2025-2030 (%)

8.4 Wired MS - Market size and forecast 2025-2030

Chart on Wired MS - Market size and forecast 2025-2030 ($ million)
Data Table on Wired MS - Market size and forecast 2025-2030 ($ million)
Chart on Wired MS - Year-over-year growth 2025-2030 (%)
Data Table on Wired MS - Year-over-year growth 2025-2030 (%)

8.5 Market opportunity by Type

Market opportunity by Type ($ million)
Data Table on Market opportunity by Type ($ million)

9. Market Segmentation by Distribution Channel

9.1 Market segments

Chart on Distribution Channel - Market share 2025-2030 (%)
Data Table on Distribution Channel - Market share 2025-2030 (%)

9.2 Comparison by Distribution Channel

Chart on Comparison by Distribution Channel
Data Table on Comparison by Distribution Channel

9.3 Offline - Market size and forecast 2025-2030

Chart on Offline - Market size and forecast 2025-2030 ($ million)
Data Table on Offline - Market size and forecast 2025-2030 ($ million)
Chart on Offline - Year-over-year growth 2025-2030 (%)
Data Table on Offline - Year-over-year growth 2025-2030 (%)

9.4 Online - Market size and forecast 2025-2030

Chart on Online - Market size and forecast 2025-2030 ($ million)
Data Table on Online - Market size and forecast 2025-2030 ($ million)
Chart on Online - Year-over-year growth 2025-2030 (%)
Data Table on Online - Year-over-year growth 2025-2030 (%)

9.5 Market opportunity by Distribution Channel

Market opportunity by Distribution Channel ($ million)
Data Table on Market opportunity by Distribution Channel ($ million)

10. Market Segmentation by Application

10.1 Market segments

Chart on Application - Market share 2025-2030 (%)
Data Table on Application - Market share 2025-2030 (%)

10.2 Comparison by Application

Chart on Comparison by Application
Data Table on Comparison by Application

10.3 Residential - Market size and forecast 2025-2030

Chart on Residential - Market size and forecast 2025-2030 ($ million)
Data Table on Residential - Market size and forecast 2025-2030 ($ million)
Chart on Residential - Year-over-year growth 2025-2030 (%)
Data Table on Residential - Year-over-year growth 2025-2030 (%)

10.4 Commercial - Market size and forecast 2025-2030

Chart on Commercial - Market size and forecast 2025-2030 ($ million)
Data Table on Commercial - Market size and forecast 2025-2030 ($ million)
Chart on Commercial - Year-over-year growth 2025-2030 (%)
Data Table on Commercial - Year-over-year growth 2025-2030 (%)

10.5 Automotive - Market size and forecast 2025-2030

Chart on Automotive - Market size and forecast 2025-2030 ($ million)
Data Table on Automotive - Market size and forecast 2025-2030 ($ million)
Chart on Automotive - Year-over-year growth 2025-2030 (%)
Data Table on Automotive - Year-over-year growth 2025-2030 (%)

10.6 Market opportunity by Application

Market opportunity by Application ($ million)
Data Table on Market opportunity by Application ($ million)

11. Customer Landscape

11.1 Customer landscape overview

Analysis of price sensitivity, lifecycle, customer purchase basket, adoption rates, and purchase criteria

12. Geographic Landscape

12.1 Geographic segmentation

Chart on Market share by geography 2025-2030 (%)
Data Table on Market share by geography 2025-2030 (%)

12.2 Geographic comparison

Chart on Geographic comparison
Data Table on Geographic comparison

12.3 APAC - Market size and forecast 2025-2030

Chart on APAC - Market size and forecast 2025-2030 ($ million)
Data Table on APAC - Market size and forecast 2025-2030 ($ million)
Chart on APAC - Year-over-year growth 2025-2030 (%)
Data Table on APAC - Year-over-year growth 2025-2030 (%)
Chart on Regional Comparison - APAC
Data Table on Regional Comparison - APAC

12.3.1 China - Market size and forecast 2025-2030

Chart on China - Market size and forecast 2025-2030 ($ million)
Data Table on China - Market size and forecast 2025-2030 ($ million)
Chart on China - Year-over-year growth 2025-2030 (%)
Data Table on China - Year-over-year growth 2025-2030 (%)

12.3.2 Japan - Market size and forecast 2025-2030

Chart on Japan - Market size and forecast 2025-2030 ($ million)
Data Table on Japan - Market size and forecast 2025-2030 ($ million)
Chart on Japan - Year-over-year growth 2025-2030 (%)
Data Table on Japan - Year-over-year growth 2025-2030 (%)

12.3.3 India - Market size and forecast 2025-2030

Chart on India - Market size and forecast 2025-2030 ($ million)
Data Table on India - Market size and forecast 2025-2030 ($ million)
Chart on India - Year-over-year growth 2025-2030 (%)
Data Table on India - Year-over-year growth 2025-2030 (%)

12.3.4 South Korea - Market size and forecast 2025-2030

Chart on South Korea - Market size and forecast 2025-2030 ($ million)
Data Table on South Korea - Market size and forecast 2025-2030 ($ million)
Chart on South Korea - Year-over-year growth 2025-2030 (%)
Data Table on South Korea - Year-over-year growth 2025-2030 (%)

12.3.5 Australia - Market size and forecast 2025-2030

Chart on Australia - Market size and forecast 2025-2030 ($ million)
Data Table on Australia - Market size and forecast 2025-2030 ($ million)
Chart on Australia - Year-over-year growth 2025-2030 (%)
Data Table on Australia - Year-over-year growth 2025-2030 (%)

12.3.6 Indonesia - Market size and forecast 2025-2030

Chart on Indonesia - Market size and forecast 2025-2030 ($ million)
Data Table on Indonesia - Market size and forecast 2025-2030 ($ million)
Chart on Indonesia - Year-over-year growth 2025-2030 (%)
Data Table on Indonesia - Year-over-year growth 2025-2030 (%)

12.4 North America - Market size and forecast 2025-2030

Chart on North America - Market size and forecast 2025-2030 ($ million)
Data Table on North America - Market size and forecast 2025-2030 ($ million)
Chart on North America - Year-over-year growth 2025-2030 (%)
Data Table on North America - Year-over-year growth 2025-2030 (%)
Chart on Regional Comparison - North America
Data Table on Regional Comparison - North America

12.4.1 US - Market size and forecast 2025-2030

Chart on US - Market size and forecast 2025-2030 ($ million)
Data Table on US - Market size and forecast 2025-2030 ($ million)
Chart on US - Year-over-year growth 2025-2030 (%)
Data Table on US - Year-over-year growth 2025-2030 (%)

12.4.2 Canada - Market size and forecast 2025-2030

Chart on Canada - Market size and forecast 2025-2030 ($ million)
Data Table on Canada - Market size and forecast 2025-2030 ($ million)
Chart on Canada - Year-over-year growth 2025-2030 (%)
Data Table on Canada - Year-over-year growth 2025-2030 (%)

12.4.3 Mexico - Market size and forecast 2025-2030

Chart on Mexico - Market size and forecast 2025-2030 ($ million)
Data Table on Mexico - Market size and forecast 2025-2030 ($ million)
Chart on Mexico - Year-over-year growth 2025-2030 (%)
Data Table on Mexico - Year-over-year growth 2025-2030 (%)

12.5 Europe - Market size and forecast 2025-2030

Chart on Europe - Market size and forecast 2025-2030 ($ million)
Data Table on Europe - Market size and forecast 2025-2030 ($ million)
Chart on Europe - Year-over-year growth 2025-2030 (%)
Data Table on Europe - Year-over-year growth 2025-2030 (%)
Chart on Regional Comparison - Europe
Data Table on Regional Comparison - Europe

12.5.1 Germany - Market size and forecast 2025-2030

Chart on Germany - Market size and forecast 2025-2030 ($ million)
Data Table on Germany - Market size and forecast 2025-2030 ($ million)
Chart on Germany - Year-over-year growth 2025-2030 (%)
Data Table on Germany - Year-over-year growth 2025-2030 (%)

12.5.2 UK - Market size and forecast 2025-2030

Chart on UK - Market size and forecast 2025-2030 ($ million)
Data Table on UK - Market size and forecast 2025-2030 ($ million)
Chart on UK - Year-over-year growth 2025-2030 (%)
Data Table on UK - Year-over-year growth 2025-2030 (%)

12.5.3 France - Market size and forecast 2025-2030

Chart on France - Market size and forecast 2025-2030 ($ million)
Data Table on France - Market size and forecast 2025-2030 ($ million)
Chart on France - Year-over-year growth 2025-2030 (%)
Data Table on France - Year-over-year growth 2025-2030 (%)

12.5.4 Italy - Market size and forecast 2025-2030

Chart on Italy - Market size and forecast 2025-2030 ($ million)
Data Table on Italy - Market size and forecast 2025-2030 ($ million)
Chart on Italy - Year-over-year growth 2025-2030 (%)
Data Table on Italy - Year-over-year growth 2025-2030 (%)

12.5.5 Spain - Market size and forecast 2025-2030

Chart on Spain - Market size and forecast 2025-2030 ($ million)
Data Table on Spain - Market size and forecast 2025-2030 ($ million)
Chart on Spain - Year-over-year growth 2025-2030 (%)
Data Table on Spain - Year-over-year growth 2025-2030 (%)

12.5.6 The Netherlands - Market size and forecast 2025-2030

Chart on The Netherlands - Market size and forecast 2025-2030 ($ million)
Data Table on The Netherlands - Market size and forecast 2025-2030 ($ million)
Chart on The Netherlands - Year-over-year growth 2025-2030 (%)
Data Table on The Netherlands - Year-over-year growth 2025-2030 (%)

12.6 South America - Market size and forecast 2025-2030

Chart on South America - Market size and forecast 2025-2030 ($ million)
Data Table on South America - Market size and forecast 2025-2030 ($ million)
Chart on South America - Year-over-year growth 2025-2030 (%)
Data Table on South America - Year-over-year growth 2025-2030 (%)
Chart on Regional Comparison - South America
Data Table on Regional Comparison - South America

12.6.1 Brazil - Market size and forecast 2025-2030

Chart on Brazil - Market size and forecast 2025-2030 ($ million)
Data Table on Brazil - Market size and forecast 2025-2030 ($ million)
Chart on Brazil - Year-over-year growth 2025-2030 (%)
Data Table on Brazil - Year-over-year growth 2025-2030 (%)

12.6.2 Argentina - Market size and forecast 2025-2030

Chart on Argentina - Market size and forecast 2025-2030 ($ million)
Data Table on Argentina - Market size and forecast 2025-2030 ($ million)
Chart on Argentina - Year-over-year growth 2025-2030 (%)
Data Table on Argentina - Year-over-year growth 2025-2030 (%)

12.6.3 Chile - Market size and forecast 2025-2030

Chart on Chile - Market size and forecast 2025-2030 ($ million)
Data Table on Chile - Market size and forecast 2025-2030 ($ million)
Chart on Chile - Year-over-year growth 2025-2030 (%)
Data Table on Chile - Year-over-year growth 2025-2030 (%)

12.7 Middle East and Africa - Market size and forecast 2025-2030

Chart on Middle East and Africa - Market size and forecast 2025-2030 ($ million)
Data Table on Middle East and Africa - Market size and forecast 2025-2030 ($ million)
Chart on Middle East and Africa - Year-over-year growth 2025-2030 (%)
Data Table on Middle East and Africa - Year-over-year growth 2025-2030 (%)
Chart on Regional Comparison - Middle East and Africa
Data Table on Regional Comparison - Middle East and Africa

12.7.1 UAE - Market size and forecast 2025-2030

Chart on UAE - Market size and forecast 2025-2030 ($ million)
Data Table on UAE - Market size and forecast 2025-2030 ($ million)
Chart on UAE - Year-over-year growth 2025-2030 (%)
Data Table on UAE - Year-over-year growth 2025-2030 (%)

12.7.2 Saudi Arabia - Market size and forecast 2025-2030

Chart on Saudi Arabia - Market size and forecast 2025-2030 ($ million)
Data Table on Saudi Arabia - Market size and forecast 2025-2030 ($ million)
Chart on Saudi Arabia - Year-over-year growth 2025-2030 (%)
Data Table on Saudi Arabia - Year-over-year growth 2025-2030 (%)

12.7.3 Israel - Market size and forecast 2025-2030

Chart on Israel - Market size and forecast 2025-2030 ($ million)
Data Table on Israel - Market size and forecast 2025-2030 ($ million)
Chart on Israel - Year-over-year growth 2025-2030 (%)
Data Table on Israel - Year-over-year growth 2025-2030 (%)

12.7.4 South Africa - Market size and forecast 2025-2030

Chart on South Africa - Market size and forecast 2025-2030 ($ million)
Data Table on South Africa - Market size and forecast 2025-2030 ($ million)
Chart on South Africa - Year-over-year growth 2025-2030 (%)
Data Table on South Africa - Year-over-year growth 2025-2030 (%)

12.7.5 Turkey - Market size and forecast 2025-2030

Chart on Turkey - Market size and forecast 2025-2030 ($ million)
Data Table on Turkey - Market size and forecast 2025-2030 ($ million)
Chart on Turkey - Year-over-year growth 2025-2030 (%)
Data Table on Turkey - Year-over-year growth 2025-2030 (%)

12.8 Market opportunity by geography

Market opportunity by geography ($ million)
Data Tables on Market opportunity by geography ($ million)

13. Drivers, Challenges, and Opportunity

13.1 Market drivers

Expansion of immersive home audio entertainment systems
Development of multi-functional high-performance speaker platforms
Integration of AI within smart audio networks

13.2 Market challenges

Semiconductor supply chain constraints for advanced chipsets
Compliance with tightening energy efficiency and standby power regulations
Market saturation and intense price commoditization in entry-level segments

13.3 Impact of drivers and challenges

Impact of drivers and challenges in 2025 and 2030

13.4 Market opportunities

Rising demand for premium digital audio experiences
Growing adoption of connected residential audio ecosystems
Evolution of high-speed wireless audio transmission technologies

14. Competitive Landscape

14.1 Overview

14.2

Overview on criticality of inputs and factors of differentiation

14.3 Landscape disruption

Overview on factors of disruption

14.4 Industry risks

Impact of key risks on business

15. Competitive Analysis

15.1 Companies profiled

Companies covered

15.2 Company ranking index

15.3 Market positioning of companies

Matrix on companies position and classification

15.4 Amazon.com Inc.

Amazon.com Inc. - Overview
Amazon.com Inc. - Business segments
Amazon.com Inc. - Key news
Amazon.com Inc. - Key offerings
Amazon.com Inc. - Segment focus
SWOT

15.5 Apple Inc.

Apple Inc. - Overview
Apple Inc. - Business segments
Apple Inc. - Key news
Apple Inc. - Key offerings
Apple Inc. - Segment focus
SWOT

15.6 Bang and Olufsen Group

Bang and Olufsen Group - Overview
Bang and Olufsen Group - Business segments
Bang and Olufsen Group - Key offerings
Bang and Olufsen Group - Segment focus
SWOT

15.7 Creative Technology Ltd.

Creative Technology Ltd. - Overview
Creative Technology Ltd. - Business segments
Creative Technology Ltd. - Key offerings
Creative Technology Ltd. - Segment focus
SWOT

15.8 Edifier International Ltd.

Edifier International Ltd. - Overview
Edifier International Ltd. - Product / Service
Edifier International Ltd. - Key offerings
SWOT

15.9 Google LLC

Google LLC - Overview
Google LLC - Product / Service
Google LLC - Key offerings
SWOT

15.10 Koninklijke Philips NV

Koninklijke Philips NV - Overview
Koninklijke Philips NV - Business segments
Koninklijke Philips NV - Key news
Koninklijke Philips NV - Key offerings
Koninklijke Philips NV - Segment focus
SWOT

15.11 LG Electronics Inc.

LG Electronics Inc. - Overview
LG Electronics Inc. - Business segments
LG Electronics Inc. - Key offerings
LG Electronics Inc. - Segment focus
SWOT

15.12 Logitech International SA

Logitech International SA - Overview
Logitech International SA - Business segments
Logitech International SA - Key offerings
Logitech International SA - Segment focus
SWOT

15.13 Panasonic Holdings Corp.

Panasonic Holdings Corp. - Overview
Panasonic Holdings Corp. - Business segments
Panasonic Holdings Corp. - Key news
Panasonic Holdings Corp. - Key offerings
Panasonic Holdings Corp. - Segment focus
SWOT

15.14 Samsung Electronics Co. Ltd.

Samsung Electronics Co. Ltd. - Overview
Samsung Electronics Co. Ltd. - Business segments
Samsung Electronics Co. Ltd. - Key news
Samsung Electronics Co. Ltd. - Key offerings
Samsung Electronics Co. Ltd. - Segment focus
SWOT

15.15 Sonos Inc.

Sonos Inc. - Overview
Sonos Inc. - Product / Service
Sonos Inc. - Key offerings
SWOT

15.16 Sony Group Corp.

Sony Group Corp. - Overview
Sony Group Corp. - Business segments
Sony Group Corp. - Key news
Sony Group Corp. - Key offerings
Sony Group Corp. - Segment focus
SWOT

15.17 Xiaomi Corp.

Xiaomi Corp. - Overview
Xiaomi Corp. - Business segments
Xiaomi Corp. - Key offerings
Xiaomi Corp. - Segment focus
SWOT

15.18 Yamaha Corp.

Yamaha Corp. - Overview
Yamaha Corp. - Business segments
Yamaha Corp. - Key offerings
Yamaha Corp. - Segment focus
SWOT

16. Appendix

16.1 Scope of the report

Market definition
Objectives
Notes and caveats

16.2 Inclusions and exclusions checklist

Inclusions checklist
Exclusions checklist

16.3 Currency conversion rates for US$

16.4 Research methodology

16.5 Data procurement

Information sources

16.6 Data validation

16.7 Validation techniques employed for market sizing

16.8 Data synthesis

16.9 360 degree market analysis

16.10 List of abbreviations

Research Methodology

Technavio presents a detailed picture of the market by way of study, synthesis, and summation of data from multiple sources. The analysts have presented the various facets of the market with a particular focus on identifying the key industry influencers. The data thus presented is comprehensive, reliable, and the result of extensive research, both primary and secondary.

INFORMATION SOURCES

Primary sources

  • Manufacturers and suppliers
  • Channel partners
  • Industry experts
  • Strategic decision makers

Secondary sources

  • Industry journals and periodicals
  • Government data
  • Financial reports of key industry players
  • Historical data
  • Press releases

DATA ANALYSIS

Data Synthesis

  • Collation of data
  • Estimation of key figures
  • Analysis of derived insights

Data Validation

  • Triangulation with data models
  • Reference against proprietary databases
  • Corroboration with industry experts

REPORT WRITING

Qualitative

  • Market drivers
  • Market challenges
  • Market trends
  • Five forces analysis

Quantitative

  • Market size and forecast
  • Market segmentation
  • Geographical insights
  • Competitive landscape

Interested in this report?

Get your sample now to see our research methodology and insights!

Download Now

Frequently Asked Questions

Multimedia Speakers market growth will increase by USD 43208.5 million during 2026-2030.

The Multimedia Speakers market is expected to grow at a CAGR of 15.2% during 2026-2030.

Multimedia Speakers market is segmented by Type (Wireless MS, Wired MS) Distribution channel (Offline, Online) Application (Residential, Commercial, Automotive)

Altec Lansing Inc., Amazon.com Inc., Anker Innovations Co. Ltd., Apple Inc., Bang and Olufsen Group, Bose Corp., Creative Technology Ltd., Denon, Edifier International Ltd., Google LLC, Koninklijke Philips NV, LG Electronics Inc., Logitech International SA, Marshall Group, Panasonic Holdings Corp., Samsung Electronics Co. Ltd., Sonos Inc., Sony Group Corp., Xiaomi Corp., Yamaha Corp. are a few of the key vendors in the Multimedia Speakers market.

APAC will register the highest growth rate of 48.9% among the other regions. Therefore, the Multimedia Speakers market in APAC is expected to garner significant business opportunities for the vendors during the forecast period.

China, Japan, India, South Korea, Australia, Indonesia, US, Canada, Mexico, Germany, UK, France, Italy, Spain, The Netherlands, Brazil, Argentina, Chile, UAE, Saudi Arabia, Israel, South Africa, Turkey

  • Expansion of immersive home audio entertainment systems is the driving factor this market.

The Multimedia Speakers market vendors should focus on grabbing business opportunities from the Type segment as it accounted for the largest market share in the base year.
RIA - Research AI Assistant
Ask RIA
