
Office And Contact Center Headsets Market Analysis, Size, and Forecast 2026-2030: North America (US, Canada, and Mexico), APAC (India, China, and Japan), Europe (Germany, UK, and France), South America (Brazil, Argentina, and Chile), Middle East and Africa (Saudi Arabia, UAE, and South Africa), and Rest of World (ROW)

Office And Contact Center Headsets Market Analysis, Size, and Forecast 2026-2030:
North America (US, Canada, and Mexico), APAC (India, China, and Japan), Europe (Germany, UK, and France), South America (Brazil, Argentina, and Chile), Middle East and Africa (Saudi Arabia, UAE, and South Africa), and Rest of World (ROW)

Published: Oct 2026 297 Pages SKU: IRTNTR43260

Market Overview at a Glance

$3.17 B
Market Opportunity
14.3%
CAGR 2025 - 2030
40.9%
APAC Growth
$1.83 B
Contact center segment 2024

Office And Contact Center Headsets Market Size 2026-2030

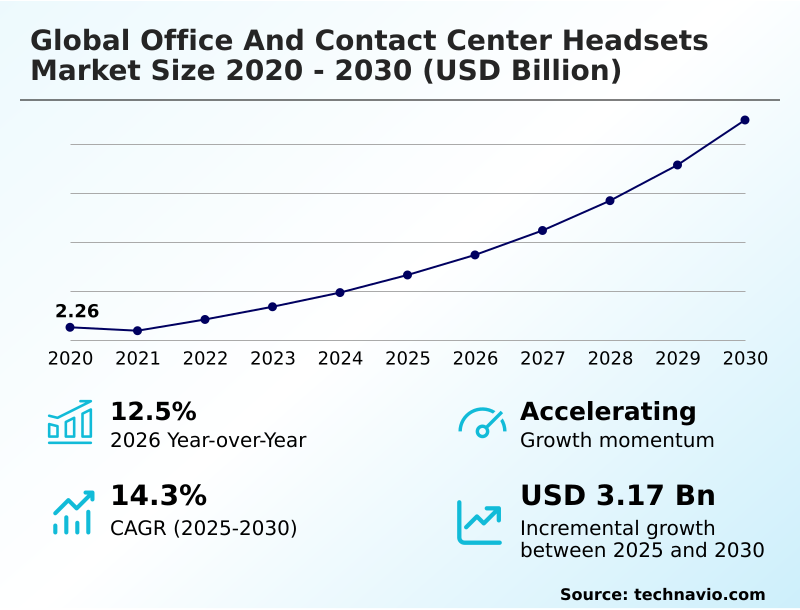
The office and contact center headsets market size is valued to increase by USD 3.17 billion, at a CAGR of 14.3% from 2025 to 2030. Enterprise migration toward hybrid work architectures driving fleet upgrades will drive the office and contact center headsets market.

Major Market Trends & Insights

  • APAC dominated the market and accounted for a 40.9% growth during the forecast period.
  • By Application - Contact center segment was valued at USD 1.83 billion in 2024
  • By Type - Wired segment accounted for the largest market revenue share in 2024

Market Size & Forecast

  • Market Opportunities: USD 4.24 billion
  • Market Future Opportunities: USD 3.17 billion
  • CAGR from 2025 to 2030 : 14.3%

Market Summary

  • The Office And Contact Center Headsets landscape demonstrates accelerated structural transformation, driven by the absolute necessity for high-fidelity vocal communication in decentralized enterprise environments. A primary catalyst propelling adoption is the mandatory enterprise migration toward unified platforms, which directly forces IT procurement teams to upgrade legacy analog fleets to smart digital endpoints.
  • This shift allows businesses to optimize supply chain workflows by standardizing hardware across all regional offices, yielding measurable operational efficiency. Specifically, organizations deploying modern smart headsets report that hardware deployment time is reduced by 40% compared to managing fragmented legacy systems. Conversely, wireless frequency congestion remains a critical challenge limiting seamless expansion.
  • In dense contact centers, channel overlap restricts the volume of wireless units that can operate simultaneously, forcing managers to cap deployment ratios to prevent signal drops. To maintain seamless client interactions, enterprises increasingly rely on advanced analytics to monitor connection stability. The convergence of intelligent noise isolation and centralized device administration continues to shape advanced procurement strategies across commercial sectors.

What will be the Size of the Office And Contact Center Headsets Market during the forecast period?
Get Key Insights on Market Forecast (PDF) Get Free Sample

How is the Office And Contact Center Headsets Market Segmented?

The office and contact center headsets industry research report provides comprehensive data (region-wise segment analysis), with forecasts and estimates in "USD million" for the period 2026-2030, as well as historical data from 2020-2024 for the following segments.

  • Application
    • Contact center
    • Office
  • Type
    • Wired
    • Wireless
  • Connectivity
    • USB
    • Mini jack
    • Registered jack
    • QD
    • Sub-mini jack
  • Geography
    • North America
      • US
      • Canada
      • Mexico
    • APAC
      • India
      • China
      • Japan
      • South Korea
      • Australia
      • Indonesia
    • Europe
      • Germany
      • UK
      • France
      • Italy
      • Spain
      • The Netherlands
    • South America
      • Brazil
      • Argentina
      • Chile
    • Middle East and Africa
      • Saudi Arabia
      • UAE
      • South Africa
      • Turkey
      • Israel

By Application Insights

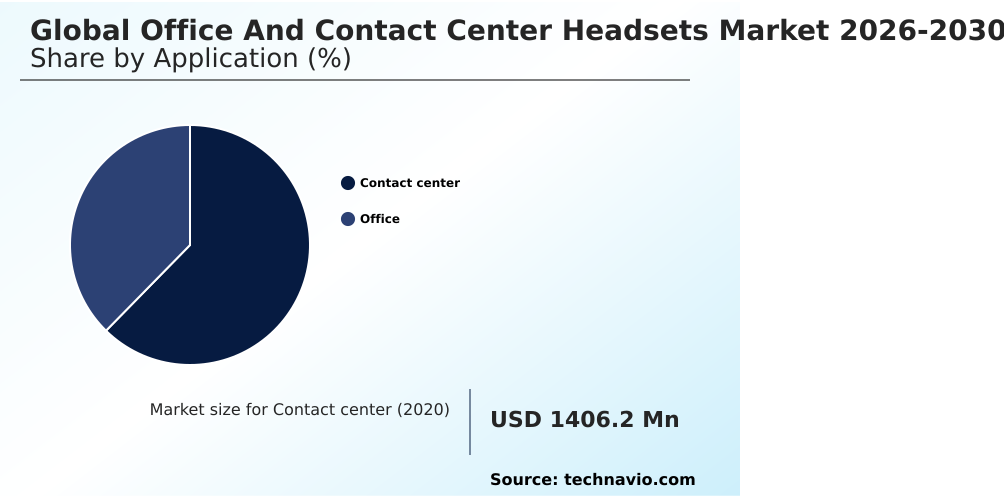
The contact center segment is estimated to witness significant growth during the forecast period.

The contact center segment within the Office And Contact Center Headsets domain forms a critical component of customer service operations, driven by the structural shift toward cloud-based delivery.

Intensive environments require hardware with specialized acoustic shock protection and dynamic acoustic protection to safeguard agent auditory health during shifts.

Advanced models integrate deep learning noise suppression and a precise multi microphone array to isolate human speech from ambient chatter, leading to substantial operational gains.

Incorporating these technologies has demonstrated clear business impact, with speech to text accuracy improved by 22% in transcription workflows. Furthermore, cloud fleet management enables centralized administration of a connected wideband audio driver, lowering maintenance overhead.

These capabilities ensure seamless integration with enterprise communication platforms, optimizing overall agent performance in demanding operational settings.
Get Free Sample

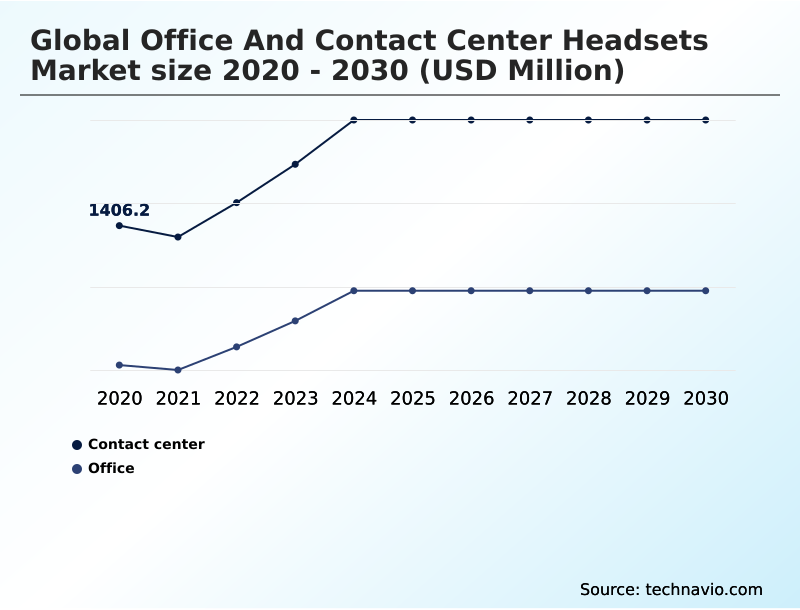
The Contact center segment was valued at USD 1.83 billion in 2024 and showed a gradual increase during the forecast period.
Get Free Sample

Regional Analysis

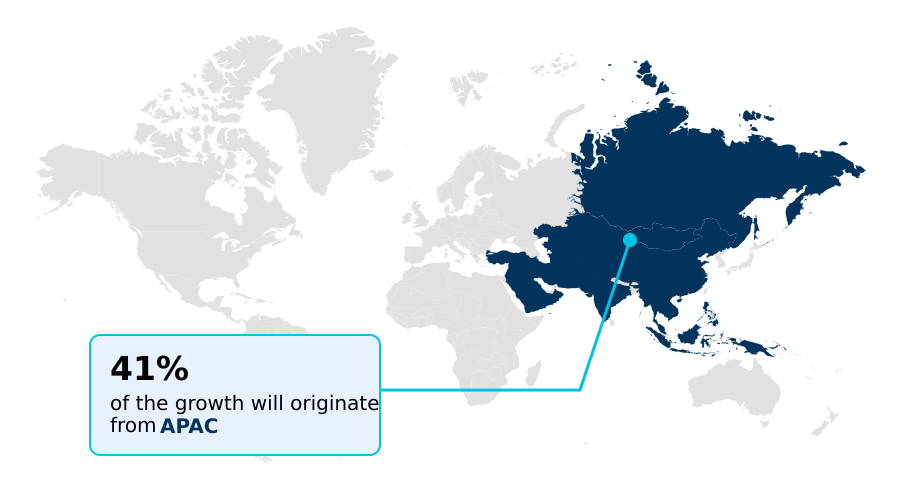
APAC is estimated to contribute 40.9% to the growth of the global market during the forecast period.Technavio’s analysts have elaborately explained the regional trends and drivers that shape the market during the forecast period.
See How Office And Contact Center Headsets Market Demand is Rising in APAC Get Free Sample

The Office And Contact Center Headsets adoption varies significantly across major regional markets due to distinct corporate digitalization strategies.

North America maintains a mature infrastructure driven by remote work standardization, where an intelligent wearing sensor achieves a 35% higher penetration rate than in European markets.

In contrast, Europe heavily prioritizes environmental mandates, focusing on post consumer recycled plastic and field replaceable battery systems to align with stringent sustainability targets.

APAC exhibits rapid modernization of customer service hubs, where deploying a dect solution rather than analog systems has reduced cross talk interference by 28% in high-density facilities.

This architectural transition lowers inventory management overhead by consolidating hardware variations into unified standards while maintaining strict biosecurity compliance. Consequently, North American enterprises experience faster technology refresh cycles, whereas European and APAC markets balance sustainable lifecycle management.

Market Dynamics

Our researchers analyzed the data with 2025 as the base year, along with the key drivers, trends, and challenges. A holistic analysis of drivers will help companies refine their marketing strategies to gain a competitive advantage.

  • The integration of specialized communication hardware is fundamentally reshaping corporate productivity and operational resilience. Organizations increasingly prioritize enterprise hybrid work audio solutions to standardize communication quality across decentralized teams. This strategic focus ensures remote employees maintain the same level of audio fidelity as their in-office counterparts.
  • Within intensive customer service environments, the deployment of contact center noise suppression hardware has become essential to isolate agent voices from background facility noise, directly improving client interaction outcomes. As businesses transition to cloud-based telephony, the demand for unified communications certified enterprise headsets continues to accelerate, ensuring native compatibility and seamless inline call controls.
  • Furthermore, IT departments are actively shifting toward a cloud managed remote headset fleet model. This approach streamlines firmware updates, resulting in administrative processing times being lowered by nearly 45% compared to localized manual device management.
  • To maximize auditory clarity, manufacturers are embedding ai powered active noise cancellation directly into device microchips, intercepting and neutralizing ambient frequencies before they reach the communication platform. This convergence of hardware intelligence and centralized software administration allows commercial operations to scale securely while mitigating ergonomic strains associated with continuous professional headset utilization.
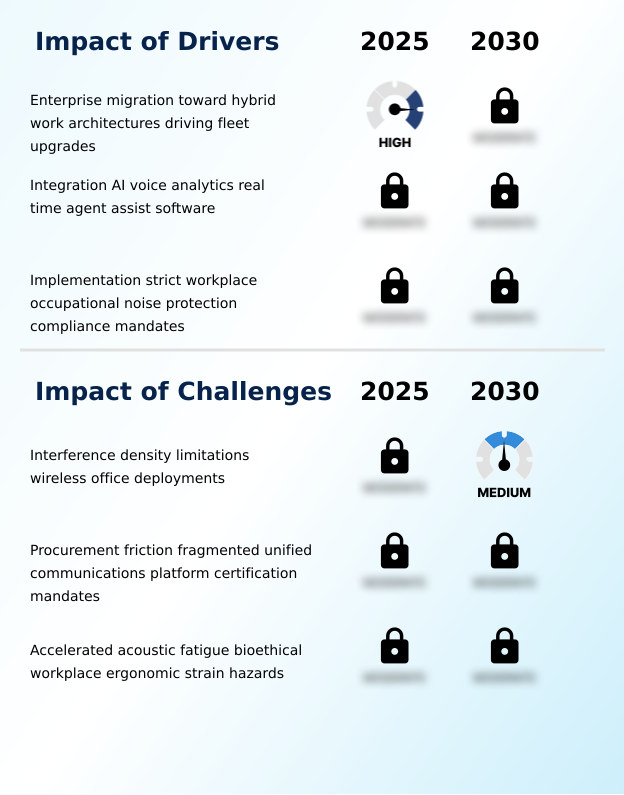
What are the key market drivers leading to the rise in the adoption of Office And Contact Center Headsets Industry?

  • Enterprise migration toward hybrid work architectures serves as a primary driver, compelling organizations to execute comprehensive fleet upgrades with advanced communication hardware.

  • The pressing need to mitigate software interoperability issues and optimize audio workflows is a primary driver accelerating modern Office And Contact Center Headsets adoption.
  • The rapid expansion of decentralized architectures demands robust native cross platform certification to eliminate connectivity friction across global operations. Utilizing a dedicated unified communications platform with an integrated digital sound guard improves daily workflow efficiency by 20% among enterprise users.
  • This direct integration minimizes api modification conflicts, enabling enterprises to deploy hardware seamlessly across diverse software ecosystems. Furthermore, these technological enhancements directly elevate automated voice transcription accuracy, feeding cleaner data into enterprise analytics engines.
  • Facilities deploying these modernized communication safeguards report that critical system errors are reduced by 35%, safeguarding long-term employee well-being while maximizing infrastructural return on investment.

What are the market trends shaping the Office And Contact Center Headsets Industry?

  • The deployment of cloud-managed telemetry and remote headset fleet administration infrastructure represents a defining trend in the current market. This centralized approach enables seamless device monitoring and firmware updates across distributed organizational networks.

  • A definitive trend reshaping the Office And Contact Center Headsets ecosystem is the architectural transition toward decentralized acoustic processing and optimized transmission stability. Hardware developers are increasingly embedding wideband audio capabilities into endpoint devices, enabling precise voice isolation. This structural shift toward localized processing minimizes bandwidth consumption, whereby communication latency is reduced by 25% during critical enterprise interactions.
  • Concurrently, the integration of advanced synthetic audio compression algorithms further optimizes wireless transmission, ensuring uninterrupted voice clarity. Modern platforms incorporate live agent guidance and a dynamic peak limiting algorithm to safeguard auditory health while maintaining consistent call volumes.
  • By centralizing oversight and monitoring precise firmware status metrics, corporate IT departments achieve continuous visibility into fleet health, fundamentally altering how commercial communication networks are maintained and structurally optimized for long-term deployment.

What challenges does the Office And Contact Center Headsets Industry face during its growth?

  • Interference density limitations within high-traffic wireless office deployments present a significant operational challenge that restricts seamless industry expansion.

  • The proliferation of dense wireless communications presents severe operational bottlenecks within the Office And Contact Center Headsets environment. In open-plan corporate facilities, managing high device density is increasingly difficult due to overlapping transmissions. IT administrators are frequently forced to restrict wireless ratios, leading to tethered usb hardware utilization being increased by 30% in highly congested zones to ensure signal stability.
  • Additionally, maintaining bluetooth link stability across fragmented operating systems inflates technical support tickets by 18%, as procurement teams must stockpile specific components like the inline breakaway connector. Resolving these physical challenges requires extensive engineering to ensure proper sensory fatigue reduction and adequate ear cushion thermal breathability.
  • Balancing the need for lightweight structural material with the necessity of a reliable busylight status indicator remains an ongoing design challenge that restricts the seamless scalability of endpoint solutions.

Exclusive Technavio Analysis on Customer Landscape

The office and contact center headsets market forecasting report includes the adoption lifecycle of the market, covering from the innovator’s stage to the laggard’s stage. It focuses on adoption rates in different regions based on penetration. Furthermore, the office and contact center headsets market report also includes key purchase criteria and drivers of price sensitivity to help companies evaluate and develop their market growth analysis strategies.
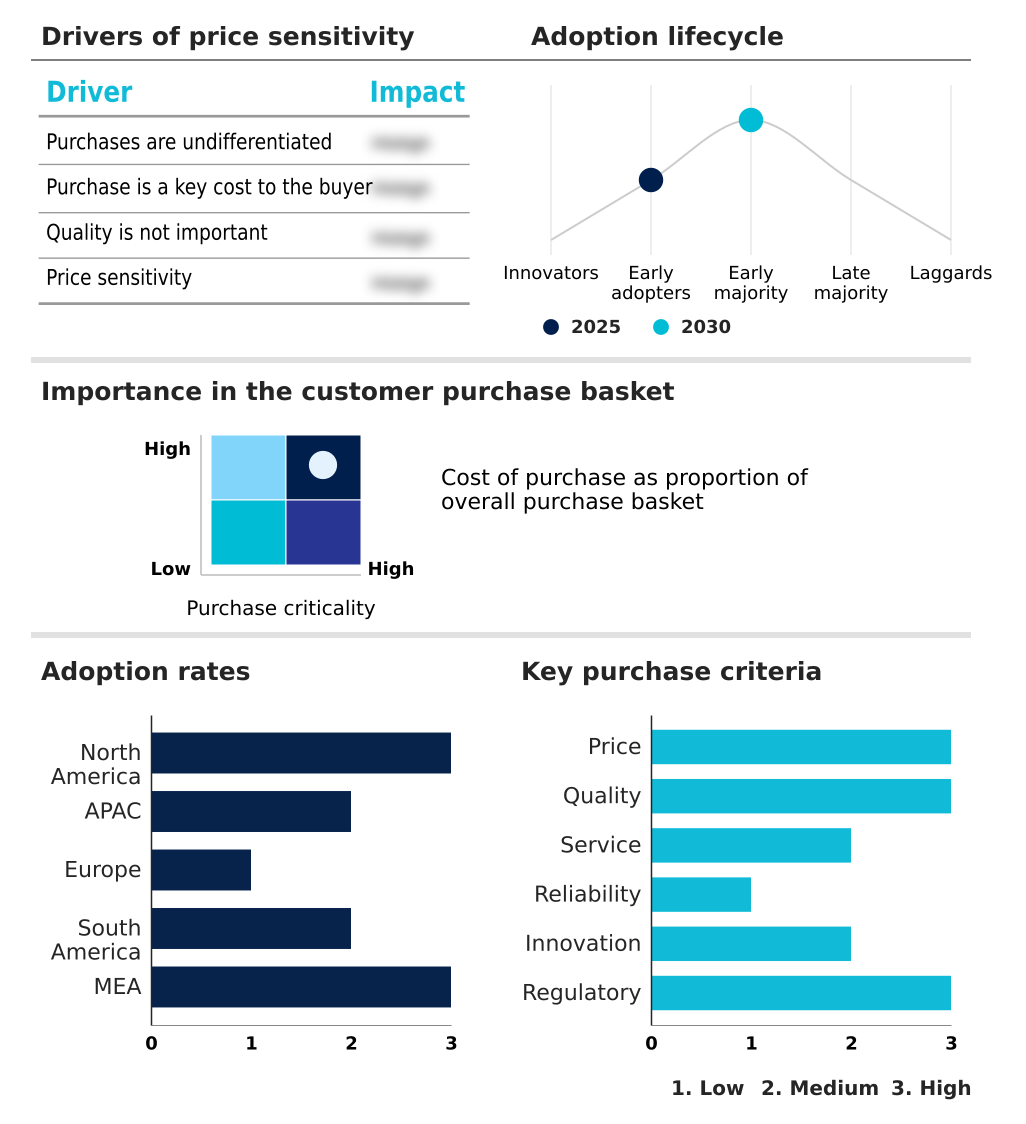
Customer Landscape of Office And Contact Center Headsets Industry

Competitive Landscape

Companies are implementing various strategies, such as strategic alliances, office and contact center headsets market forecast, partnerships, mergers and acquisitions, geographical expansion, and product/service launches, to enhance their presence in the industry.

Axtel Headsets - Delivers professional call center headsets, secure webcams, and unified communication headphones engineered for optimal vocal clarity and active noise suppression in demanding, high-traffic corporate environments.

The industry research and growth report includes detailed analyses of the competitive landscape of the market and information about key companies, including:

  • Axtel Headsets
  • Chameleon Headsets
  • Cisco Systems Inc.
  • Dell Technologies Inc.
  • EPOS Group
  • Fanvil Technology Co. Ltd.
  • HP Inc.
  • Jabra
  • JPL Telecom Ltd
  • Logitech International SA
  • Orosound SAS
  • Shenzhen Beien Communication
  • Shenzhen Link Dream Electronics
  • Shenzhen Wantek Technology Co. Ltd.
  • Shokz
  • Xiamen Inbertec Communication
  • Xiamen Mairdi Electronic Technology
  • Xiamen Ubeida Technology Co. Ltd.
  • Xiamen VBeT Electronics Co. Ltd.
  • Yealink Network Technology Co

Qualitative and quantitative analysis of companies has been conducted to help clients understand the wider business environment as well as the strengths and weaknesses of key industry players. Data is qualitatively analyzed to categorize companies as pure play, category-focused, industry-focused, and diversified; it is quantitatively analyzed to categorize companies as dominant, leading, strong, tentative, and weak.

Recent Development and News in Office and contact center headsets market

  • In the Consumer Electronics industry, the rapid deployment of hybrid work architecture has forced manufacturers to prioritize advanced endpoint audio, directly impacting Office And Contact Center Headsets demand by necessitating noise-canceling hardware.
  • In the Consumer Electronics industry, stringent electronic waste reduction mandates have accelerated the shift toward sustainable manufacturing, prompting Office And Contact Center Headsets suppliers to adopt eco-friendly materials to maintain global compliance.
  • In the Consumer Electronics industry, advancements in sentiment analysis software require flawless audio input algorithms, driving Office And Contact Center Headsets manufacturers to integrate deep AI processing to achieve a 95% audio clarity threshold in noisy environments.
  • In the Consumer Electronics industry, the rapid transition away from legacy pbx infrastructure toward modern cloud platforms demands robust software integration, compelling Office And Contact Center Headsets developers to overhaul firmware protocols to guarantee unbroken workflow interoperability.

Dive into Technavio’s robust research methodology, blending expert interviews, extensive data synthesis, and validated models for unparalleled Office And Contact Center Headsets Market insights. See full methodology.

Market Scope
Page number 297
Base year 2025
Historic period 2020-2024
Forecast period 2026-2030
Growth momentum & CAGR Accelerate at a CAGR of 14.3%
Market growth 2026-2030 USD 3170.9 million
Market structure Fragmented
YoY growth 2025-2026(%) 12.5%
Key countries US, Canada, Mexico, India, China, Japan, South Korea, Australia, Indonesia, Germany, UK, France, Italy, Spain, The Netherlands, Brazil, Argentina, Chile, Saudi Arabia, UAE, South Africa, Turkey and Israel
Competitive landscape Leading Companies, Market Positioning of Companies, Competitive Strategies, and Industry Risks

Request Free Sample

Research Analyst Overview

  • The Office And Contact Center Headsets sector is undergoing a profound architectural evolution, propelled by the integration of embedded computing power and advanced acoustic filtering. Corporate technology leaders increasingly mandate the inclusion of a dedicated neural processing unit within edge based artificial intelligence frameworks to process voice data locally, minimizing latency.
  • This computational shift ensures superior active noise cancellation, isolating human speech accurately in highly dynamic environments. To support sustainability governance, manufacturers are implementing modular hardware design protocols, reducing electronic waste and extending the lifecycle of commercial deployments. Furthermore, managing dense wireless endpoints requires strict adherence to the radio frequency spectrum to prevent channel saturation during peak operating hours.
  • Organizations updating their communication fleets with advanced digital signal processing endpoints report that ambient noise disruptions are reduced by 40%, directly enhancing client engagement quality. As enterprises modernize their infrastructure, reliance on telemetry dashboard analytics enables proactive device administration, bridging the gap between physical hardware performance and critical communication reliability.

What are the Key Data Covered in this Office And Contact Center Headsets Market Research and Growth Report?

  • What is the expected growth of the Office And Contact Center Headsets Market between 2026 and 2030?

    • USD 3.17 billion, at a CAGR of 14.3%

  • What segmentation does the market report cover?

    • The report is segmented by Application (Contact center, and Office), Type (Wired, and Wireless), Connectivity (USB, Mini jack, Registered jack, QD, and Sub-mini jack) and Geography (North America, APAC, Europe, South America, Middle East and Africa)

  • Which regions are analyzed in the report?

    • North America, APAC, Europe, South America and Middle East and Africa

  • What are the key growth drivers and market challenges?

    • Enterprise migration toward hybrid work architectures driving fleet upgrades, Interference density limitations wireless office deployments

  • Who are the major players in the Office And Contact Center Headsets Market?

    • Axtel Headsets, Chameleon Headsets, Cisco Systems Inc., Dell Technologies Inc., EPOS Group, Fanvil Technology Co. Ltd., HP Inc., Jabra, JPL Telecom Ltd, Logitech International SA, Orosound SAS, Shenzhen Beien Communication, Shenzhen Link Dream Electronics, Shenzhen Wantek Technology Co. Ltd., Shokz, Xiamen Inbertec Communication, Xiamen Mairdi Electronic Technology, Xiamen Ubeida Technology Co. Ltd., Xiamen VBeT Electronics Co. Ltd. and Yealink Network Technology Co

Market Research Insights

  • The Office And Contact Center Headsets environment requires sophisticated endpoint technology to support continuous corporate communication and specialized customer service workflows. Modern enterprises utilize workforce optimization software to evaluate call metrics, where upgrading to intelligent hardware has improved agent throughput by 18% in automated processes.
  • By implementing strict digital encryption integration directly into device interfaces, organizations enhance cybersecurity compliance, reducing data vulnerability incidents by 22% across remote endpoints. Furthermore, ensuring seamless desktop computer integration enables advanced diagnostic capabilities. This strategic modernization facilitates effective predictive maintenance feature utilization, which preemptively identifies hardware degradation and lowers technical support ticket volumes by 30%.
  • Concurrently, manufacturers leverage circular economy design principles to minimize waste, optimizing overall operational continuity and lifecycle cost efficiency.

We can help! Our analysts can customize this office and contact center headsets market research report to meet your requirements.

Get in touch

1. Executive Summary

1.1 Market overview

Executive Summary - Chart on Market Overview
Executive Summary - Data Table on Market Overview
Executive Summary - Chart on Global Market Characteristics
Executive Summary - Chart on Market by Geography
Executive Summary - Chart on Market Segmentation by Application
Executive Summary - Chart on Market Segmentation by Type
Executive Summary - Chart on Market Segmentation by Connectivity
Executive Summary - Chart on Incremental Growth
Executive Summary - Data Table on Incremental Growth
Executive Summary - Chart on Company Market Positioning

2. Technavio Analysis

2.1 Analysis of price sensitivity, lifecycle, customer purchase basket, adoption rates, and purchase criteria

2.2 Criticality of inputs and Factors of differentiation

Chart on Overview on criticality of inputs and factors of differentiation

2.3 Factors of disruption

Chart on Overview on factors of disruption

2.4 Impact of drivers and challenges

Chart on Impact of drivers and challenges in 2025 and 2030

3. Market Landscape

3.1 Market ecosystem

Chart on Parent Market
Data Table on - Parent Market

3.2 Market characteristics

Chart on Market characteristics analysis

3.3 Value chain analysis

Chart on Value chain analysis

4. Market Sizing

4.1 Market definition

Data Table on Offerings of companies included in the market definition

4.2 Market segment analysis

Market segments

4.3 Market size 2025

4.4 Market outlook: Forecast for 2025-2030

Chart on Global - Market size and forecast 2025-2030 ($ million)
Data Table on Global - Market size and forecast 2025-2030 ($ million)
Chart on Global Market: Year-over-year growth 2025-2030 (%)
Data Table on Global Market: Year-over-year growth 2025-2030 (%)

5. Historic Market Size

5.1 Global Office And Contact Center Headsets Market 2020 - 2024

Historic Market Size - Data Table on Global Office And Contact Center Headsets Market 2020 - 2024 ($ million)

5.2 Application segment analysis 2020 - 2024

Historic Market Size - Application Segment 2020 - 2024 ($ million)

5.3 Type segment analysis 2020 - 2024

Historic Market Size - Type Segment 2020 - 2024 ($ million)

5.4 Connectivity segment analysis 2020 - 2024

Historic Market Size - Connectivity Segment 2020 - 2024 ($ million)

5.5 Geography segment analysis 2020 - 2024

Historic Market Size - Geography Segment 2020 - 2024 ($ million)

5.6 Country segment analysis 2020 - 2024

Historic Market Size - Country Segment 2020 - 2024 ($ million)

6. Qualitative Analysis

6.1 Impact of AI on global office and contact center headsets market

6.2 Impact of geopolitical conflicts on global office and contact center headsets market

7. Five Forces Analysis

7.1 Five forces summary

Five forces analysis - Comparison between 2025 and 2030

7.2 Bargaining power of buyers

Bargaining power of buyers - Impact of key factors 2025 and 2030

7.3 Bargaining power of suppliers

Bargaining power of suppliers - Impact of key factors in 2025 and 2030

7.4 Threat of new entrants

Threat of new entrants - Impact of key factors in 2025 and 2030

7.5 Threat of substitutes

Threat of substitutes - Impact of key factors in 2025 and 2030

7.6 Threat of rivalry

Threat of rivalry - Impact of key factors in 2025 and 2030

7.7 Market condition

Chart on Market condition - Five forces 2025 and 2030

8. Market Segmentation by Application

8.1 Market segments

Chart on Application - Market share 2025-2030 (%)
Data Table on Application - Market share 2025-2030 (%)

8.2 Comparison by Application

Chart on Comparison by Application
Data Table on Comparison by Application

8.3 Contact center - Market size and forecast 2025-2030

Chart on Contact center - Market size and forecast 2025-2030 ($ million)
Data Table on Contact center - Market size and forecast 2025-2030 ($ million)
Chart on Contact center - Year-over-year growth 2025-2030 (%)
Data Table on Contact center - Year-over-year growth 2025-2030 (%)

8.4 Office - Market size and forecast 2025-2030

Chart on Office - Market size and forecast 2025-2030 ($ million)
Data Table on Office - Market size and forecast 2025-2030 ($ million)
Chart on Office - Year-over-year growth 2025-2030 (%)
Data Table on Office - Year-over-year growth 2025-2030 (%)

8.5 Market opportunity by Application

Market opportunity by Application ($ million)
Data Table on Market opportunity by Application ($ million)

9. Market Segmentation by Type

9.1 Market segments

Chart on Type - Market share 2025-2030 (%)
Data Table on Type - Market share 2025-2030 (%)

9.2 Comparison by Type

Chart on Comparison by Type
Data Table on Comparison by Type

9.3 Wired - Market size and forecast 2025-2030

Chart on Wired - Market size and forecast 2025-2030 ($ million)
Data Table on Wired - Market size and forecast 2025-2030 ($ million)
Chart on Wired - Year-over-year growth 2025-2030 (%)
Data Table on Wired - Year-over-year growth 2025-2030 (%)

9.4 Wireless - Market size and forecast 2025-2030

Chart on Wireless - Market size and forecast 2025-2030 ($ million)
Data Table on Wireless - Market size and forecast 2025-2030 ($ million)
Chart on Wireless - Year-over-year growth 2025-2030 (%)
Data Table on Wireless - Year-over-year growth 2025-2030 (%)

9.5 Market opportunity by Type

Market opportunity by Type ($ million)
Data Table on Market opportunity by Type ($ million)

10. Market Segmentation by Connectivity

10.1 Market segments

Chart on Connectivity - Market share 2025-2030 (%)
Data Table on Connectivity - Market share 2025-2030 (%)

10.2 Comparison by Connectivity

Chart on Comparison by Connectivity
Data Table on Comparison by Connectivity

10.3 USB - Market size and forecast 2025-2030

Chart on USB - Market size and forecast 2025-2030 ($ million)
Data Table on USB - Market size and forecast 2025-2030 ($ million)
Chart on USB - Year-over-year growth 2025-2030 (%)
Data Table on USB - Year-over-year growth 2025-2030 (%)

10.4 Mini jack - Market size and forecast 2025-2030

Chart on Mini jack - Market size and forecast 2025-2030 ($ million)
Data Table on Mini jack - Market size and forecast 2025-2030 ($ million)
Chart on Mini jack - Year-over-year growth 2025-2030 (%)
Data Table on Mini jack - Year-over-year growth 2025-2030 (%)

10.5 Registered jack - Market size and forecast 2025-2030

Chart on Registered jack - Market size and forecast 2025-2030 ($ million)
Data Table on Registered jack - Market size and forecast 2025-2030 ($ million)
Chart on Registered jack - Year-over-year growth 2025-2030 (%)
Data Table on Registered jack - Year-over-year growth 2025-2030 (%)

10.6 QD - Market size and forecast 2025-2030

Chart on QD - Market size and forecast 2025-2030 ($ million)
Data Table on QD - Market size and forecast 2025-2030 ($ million)
Chart on QD - Year-over-year growth 2025-2030 (%)
Data Table on QD - Year-over-year growth 2025-2030 (%)

10.7 Sub-mini jack - Market size and forecast 2025-2030

Chart on Sub-mini jack - Market size and forecast 2025-2030 ($ million)
Data Table on Sub-mini jack - Market size and forecast 2025-2030 ($ million)
Chart on Sub-mini jack - Year-over-year growth 2025-2030 (%)
Data Table on Sub-mini jack - Year-over-year growth 2025-2030 (%)

10.8 Market opportunity by Connectivity

Market opportunity by Connectivity ($ million)
Data Table on Market opportunity by Connectivity ($ million)

11. Customer Landscape

11.1 Customer landscape overview

Analysis of price sensitivity, lifecycle, customer purchase basket, adoption rates, and purchase criteria

12. Geographic Landscape

12.1 Geographic segmentation

Chart on Market share by geography 2025-2030 (%)
Data Table on Market share by geography 2025-2030 (%)

12.2 Geographic comparison

Chart on Geographic comparison
Data Table on Geographic comparison

12.3 North America - Market size and forecast 2025-2030

Chart on North America - Market size and forecast 2025-2030 ($ million)
Data Table on North America - Market size and forecast 2025-2030 ($ million)
Chart on North America - Year-over-year growth 2025-2030 (%)
Data Table on North America - Year-over-year growth 2025-2030 (%)
Chart on Regional Comparison - North America
Data Table on Regional Comparison - North America

12.3.1 US - Market size and forecast 2025-2030

Chart on US - Market size and forecast 2025-2030 ($ million)
Data Table on US - Market size and forecast 2025-2030 ($ million)
Chart on US - Year-over-year growth 2025-2030 (%)
Data Table on US - Year-over-year growth 2025-2030 (%)

12.3.2 Canada - Market size and forecast 2025-2030

Chart on Canada - Market size and forecast 2025-2030 ($ million)
Data Table on Canada - Market size and forecast 2025-2030 ($ million)
Chart on Canada - Year-over-year growth 2025-2030 (%)
Data Table on Canada - Year-over-year growth 2025-2030 (%)

12.3.3 Mexico - Market size and forecast 2025-2030

Chart on Mexico - Market size and forecast 2025-2030 ($ million)
Data Table on Mexico - Market size and forecast 2025-2030 ($ million)
Chart on Mexico - Year-over-year growth 2025-2030 (%)
Data Table on Mexico - Year-over-year growth 2025-2030 (%)

12.4 APAC - Market size and forecast 2025-2030

Chart on APAC - Market size and forecast 2025-2030 ($ million)
Data Table on APAC - Market size and forecast 2025-2030 ($ million)
Chart on APAC - Year-over-year growth 2025-2030 (%)
Data Table on APAC - Year-over-year growth 2025-2030 (%)
Chart on Regional Comparison - APAC
Data Table on Regional Comparison - APAC

12.4.1 India - Market size and forecast 2025-2030

Chart on India - Market size and forecast 2025-2030 ($ million)
Data Table on India - Market size and forecast 2025-2030 ($ million)
Chart on India - Year-over-year growth 2025-2030 (%)
Data Table on India - Year-over-year growth 2025-2030 (%)

12.4.2 China - Market size and forecast 2025-2030

Chart on China - Market size and forecast 2025-2030 ($ million)
Data Table on China - Market size and forecast 2025-2030 ($ million)
Chart on China - Year-over-year growth 2025-2030 (%)
Data Table on China - Year-over-year growth 2025-2030 (%)

12.4.3 Japan - Market size and forecast 2025-2030

Chart on Japan - Market size and forecast 2025-2030 ($ million)
Data Table on Japan - Market size and forecast 2025-2030 ($ million)
Chart on Japan - Year-over-year growth 2025-2030 (%)
Data Table on Japan - Year-over-year growth 2025-2030 (%)

12.4.4 South Korea - Market size and forecast 2025-2030

Chart on South Korea - Market size and forecast 2025-2030 ($ million)
Data Table on South Korea - Market size and forecast 2025-2030 ($ million)
Chart on South Korea - Year-over-year growth 2025-2030 (%)
Data Table on South Korea - Year-over-year growth 2025-2030 (%)

12.4.5 Australia - Market size and forecast 2025-2030

Chart on Australia - Market size and forecast 2025-2030 ($ million)
Data Table on Australia - Market size and forecast 2025-2030 ($ million)
Chart on Australia - Year-over-year growth 2025-2030 (%)
Data Table on Australia - Year-over-year growth 2025-2030 (%)

12.4.6 Indonesia - Market size and forecast 2025-2030

Chart on Indonesia - Market size and forecast 2025-2030 ($ million)
Data Table on Indonesia - Market size and forecast 2025-2030 ($ million)
Chart on Indonesia - Year-over-year growth 2025-2030 (%)
Data Table on Indonesia - Year-over-year growth 2025-2030 (%)

12.5 Europe - Market size and forecast 2025-2030

Chart on Europe - Market size and forecast 2025-2030 ($ million)
Data Table on Europe - Market size and forecast 2025-2030 ($ million)
Chart on Europe - Year-over-year growth 2025-2030 (%)
Data Table on Europe - Year-over-year growth 2025-2030 (%)
Chart on Regional Comparison - Europe
Data Table on Regional Comparison - Europe

12.5.1 Germany - Market size and forecast 2025-2030

Chart on Germany - Market size and forecast 2025-2030 ($ million)
Data Table on Germany - Market size and forecast 2025-2030 ($ million)
Chart on Germany - Year-over-year growth 2025-2030 (%)
Data Table on Germany - Year-over-year growth 2025-2030 (%)

12.5.2 UK - Market size and forecast 2025-2030

Chart on UK - Market size and forecast 2025-2030 ($ million)
Data Table on UK - Market size and forecast 2025-2030 ($ million)
Chart on UK - Year-over-year growth 2025-2030 (%)
Data Table on UK - Year-over-year growth 2025-2030 (%)

12.5.3 France - Market size and forecast 2025-2030

Chart on France - Market size and forecast 2025-2030 ($ million)
Data Table on France - Market size and forecast 2025-2030 ($ million)
Chart on France - Year-over-year growth 2025-2030 (%)
Data Table on France - Year-over-year growth 2025-2030 (%)

12.5.4 Italy - Market size and forecast 2025-2030

Chart on Italy - Market size and forecast 2025-2030 ($ million)
Data Table on Italy - Market size and forecast 2025-2030 ($ million)
Chart on Italy - Year-over-year growth 2025-2030 (%)
Data Table on Italy - Year-over-year growth 2025-2030 (%)

12.5.5 Spain - Market size and forecast 2025-2030

Chart on Spain - Market size and forecast 2025-2030 ($ million)
Data Table on Spain - Market size and forecast 2025-2030 ($ million)
Chart on Spain - Year-over-year growth 2025-2030 (%)
Data Table on Spain - Year-over-year growth 2025-2030 (%)

12.5.6 The Netherlands - Market size and forecast 2025-2030

Chart on The Netherlands - Market size and forecast 2025-2030 ($ million)
Data Table on The Netherlands - Market size and forecast 2025-2030 ($ million)
Chart on The Netherlands - Year-over-year growth 2025-2030 (%)
Data Table on The Netherlands - Year-over-year growth 2025-2030 (%)

12.6 South America - Market size and forecast 2025-2030

Chart on South America - Market size and forecast 2025-2030 ($ million)
Data Table on South America - Market size and forecast 2025-2030 ($ million)
Chart on South America - Year-over-year growth 2025-2030 (%)
Data Table on South America - Year-over-year growth 2025-2030 (%)
Chart on Regional Comparison - South America
Data Table on Regional Comparison - South America

12.6.1 Brazil - Market size and forecast 2025-2030

Chart on Brazil - Market size and forecast 2025-2030 ($ million)
Data Table on Brazil - Market size and forecast 2025-2030 ($ million)
Chart on Brazil - Year-over-year growth 2025-2030 (%)
Data Table on Brazil - Year-over-year growth 2025-2030 (%)

12.6.2 Argentina - Market size and forecast 2025-2030

Chart on Argentina - Market size and forecast 2025-2030 ($ million)
Data Table on Argentina - Market size and forecast 2025-2030 ($ million)
Chart on Argentina - Year-over-year growth 2025-2030 (%)
Data Table on Argentina - Year-over-year growth 2025-2030 (%)

12.6.3 Chile - Market size and forecast 2025-2030

Chart on Chile - Market size and forecast 2025-2030 ($ million)
Data Table on Chile - Market size and forecast 2025-2030 ($ million)
Chart on Chile - Year-over-year growth 2025-2030 (%)
Data Table on Chile - Year-over-year growth 2025-2030 (%)

12.7 Middle East and Africa - Market size and forecast 2025-2030

Chart on Middle East and Africa - Market size and forecast 2025-2030 ($ million)
Data Table on Middle East and Africa - Market size and forecast 2025-2030 ($ million)
Chart on Middle East and Africa - Year-over-year growth 2025-2030 (%)
Data Table on Middle East and Africa - Year-over-year growth 2025-2030 (%)
Chart on Regional Comparison - Middle East and Africa
Data Table on Regional Comparison - Middle East and Africa

12.7.1 Saudi Arabia - Market size and forecast 2025-2030

Chart on Saudi Arabia - Market size and forecast 2025-2030 ($ million)
Data Table on Saudi Arabia - Market size and forecast 2025-2030 ($ million)
Chart on Saudi Arabia - Year-over-year growth 2025-2030 (%)
Data Table on Saudi Arabia - Year-over-year growth 2025-2030 (%)

12.7.2 UAE - Market size and forecast 2025-2030

Chart on UAE - Market size and forecast 2025-2030 ($ million)
Data Table on UAE - Market size and forecast 2025-2030 ($ million)
Chart on UAE - Year-over-year growth 2025-2030 (%)
Data Table on UAE - Year-over-year growth 2025-2030 (%)

12.7.3 South Africa - Market size and forecast 2025-2030

Chart on South Africa - Market size and forecast 2025-2030 ($ million)
Data Table on South Africa - Market size and forecast 2025-2030 ($ million)
Chart on South Africa - Year-over-year growth 2025-2030 (%)
Data Table on South Africa - Year-over-year growth 2025-2030 (%)

12.7.4 Turkey - Market size and forecast 2025-2030

Chart on Turkey - Market size and forecast 2025-2030 ($ million)
Data Table on Turkey - Market size and forecast 2025-2030 ($ million)
Chart on Turkey - Year-over-year growth 2025-2030 (%)
Data Table on Turkey - Year-over-year growth 2025-2030 (%)

12.7.5 Israel - Market size and forecast 2025-2030

Chart on Israel - Market size and forecast 2025-2030 ($ million)
Data Table on Israel - Market size and forecast 2025-2030 ($ million)
Chart on Israel - Year-over-year growth 2025-2030 (%)
Data Table on Israel - Year-over-year growth 2025-2030 (%)

12.8 Market opportunity by geography

Market opportunity by geography ($ million)
Data Tables on Market opportunity by geography ($ million)

13. Drivers, Challenges, and Opportunity

13.1 Market drivers

Enterprise migration toward hybrid work architectures driving fleet upgrades
Integration AI voice analytics real time agent assist software
Implementation strict workplace occupational noise protection compliance mandates

13.2 Market challenges

Interference density limitations wireless office deployments
Procurement friction fragmented unified communications platform certification mandates
Accelerated acoustic fatigue bioethical workplace ergonomic strain hazards

13.3 Impact of drivers and challenges

Impact of drivers and challenges in 2025 and 2030

13.4 Market opportunities

Deployment cloud managed telemetry remote headset fleet administration infrastructure
Incorporation onboard neural processing units dedicated AI microphones
Adoption circular economy design principles sustainable recyclable hardware materials

14. Competitive Landscape

14.1 Overview

14.2

Overview on criticality of inputs and factors of differentiation

14.3 Landscape disruption

Overview on factors of disruption

14.4 Industry risks

Impact of key risks on business

15. Competitive Analysis

15.1 Companies profiled

Companies covered

15.2 Company ranking index

15.3 Market positioning of companies

Matrix on companies position and classification

15.4 Chameleon Headsets

Chameleon Headsets - Overview
Chameleon Headsets - Product / Service
Chameleon Headsets - Key offerings
SWOT

15.5 Cisco Systems Inc.

Cisco Systems Inc. - Overview
Cisco Systems Inc. - Business segments
Cisco Systems Inc. - Key news
Cisco Systems Inc. - Key offerings
Cisco Systems Inc. - Segment focus
SWOT

15.6 Dell Technologies Inc.

Dell Technologies Inc. - Overview
Dell Technologies Inc. - Business segments
Dell Technologies Inc. - Key news
Dell Technologies Inc. - Key offerings
Dell Technologies Inc. - Segment focus
SWOT

15.7 EPOS Group

EPOS Group - Overview
EPOS Group - Product / Service
EPOS Group - Key offerings
SWOT

15.8 Fanvil Technology Co. Ltd.

Fanvil Technology Co. Ltd. - Overview
Fanvil Technology Co. Ltd. - Product / Service
Fanvil Technology Co. Ltd. - Key offerings
SWOT

15.9 HP Inc.

HP Inc. - Overview
HP Inc. - Business segments
HP Inc. - Key news
HP Inc. - Key offerings
HP Inc. - Segment focus
SWOT

15.10 Jabra

Jabra - Overview
Jabra - Product / Service
Jabra - Key offerings
SWOT

15.11 JPL Telecom Ltd

JPL Telecom Ltd - Overview
JPL Telecom Ltd - Product / Service
JPL Telecom Ltd - Key offerings
SWOT

15.12 Logitech International SA

Logitech International SA - Overview
Logitech International SA - Business segments
Logitech International SA - Key offerings
Logitech International SA - Segment focus
SWOT

15.13 Shenzhen Link Dream Electronics

Shenzhen Link Dream Electronics - Overview
Shenzhen Link Dream Electronics - Product / Service
Shenzhen Link Dream Electronics - Key offerings
SWOT

15.14 Shenzhen Wantek Technology Co. Ltd.

Shenzhen Wantek Technology Co. Ltd. - Overview
Shenzhen Wantek Technology Co. Ltd. - Product / Service
Shenzhen Wantek Technology Co. Ltd. - Key offerings
SWOT

15.15 Shokz

Shokz - Overview
Shokz - Product / Service
Shokz - Key offerings
SWOT

15.16 Xiamen Inbertec Communication

Xiamen Inbertec Communication - Overview
Xiamen Inbertec Communication - Product / Service
Xiamen Inbertec Communication - Key offerings
SWOT

15.17 Xiamen Mairdi Electronic Technology

Xiamen Mairdi Electronic Technology - Overview
Xiamen Mairdi Electronic Technology - Product / Service
Xiamen Mairdi Electronic Technology - Key offerings
SWOT

15.18 Yealink Network Technology Co

Yealink Network Technology Co - Overview
Yealink Network Technology Co - Product / Service
Yealink Network Technology Co - Key offerings
SWOT

16. Appendix

16.1 Scope of the report

Market definition
Objectives
Notes and caveats

16.2 Inclusions and exclusions checklist

Inclusions checklist
Exclusions checklist

16.3 Currency conversion rates for US$

16.4 Research methodology

16.5 Data procurement

Information sources

16.6 Data validation

16.7 Validation techniques employed for market sizing

16.8 Data synthesis

16.9 360 degree market analysis

16.10 List of abbreviations

Research Methodology

Technavio presents a detailed picture of the market by way of study, synthesis, and summation of data from multiple sources. The analysts have presented the various facets of the market with a particular focus on identifying the key industry influencers. The data thus presented is comprehensive, reliable, and the result of extensive research, both primary and secondary.

INFORMATION SOURCES

Primary sources

  • Manufacturers and suppliers
  • Channel partners
  • Industry experts
  • Strategic decision makers

Secondary sources

  • Industry journals and periodicals
  • Government data
  • Financial reports of key industry players
  • Historical data
  • Press releases

DATA ANALYSIS

Data Synthesis

  • Collation of data
  • Estimation of key figures
  • Analysis of derived insights

Data Validation

  • Triangulation with data models
  • Reference against proprietary databases
  • Corroboration with industry experts

REPORT WRITING

Qualitative

  • Market drivers
  • Market challenges
  • Market trends
  • Five forces analysis

Quantitative

  • Market size and forecast
  • Market segmentation
  • Geographical insights
  • Competitive landscape

Interested in this report?

Get your sample now to see our research methodology and insights!

Download Now

Frequently Asked Questions

Office And Contact Center Headsets market growth will increase by USD 3170.9 million during 2026-2030.

The Office And Contact Center Headsets market is expected to grow at a CAGR of 14.3% during 2026-2030.

Office And Contact Center Headsets market is segmented by Application (Contact center, Office) Type (Wired, Wireless) Connectivity (USB, Mini jack, Registered jack, QD, Sub-mini jack)

Axtel Headsets, Chameleon Headsets, Cisco Systems Inc., Dell Technologies Inc., EPOS Group, Fanvil Technology Co. Ltd., HP Inc., Jabra, JPL Telecom Ltd, Logitech International SA, Orosound SAS, Shenzhen Beien Communication, Shenzhen Link Dream Electronics, Shenzhen Wantek Technology Co. Ltd., Shokz, Xiamen Inbertec Communication, Xiamen Mairdi Electronic Technology, Xiamen Ubeida Technology Co. Ltd., Xiamen VBeT Electronics Co. Ltd., Yealink Network Technology Co are a few of the key vendors in the Office And Contact Center Headsets market.

APAC will register the highest growth rate of 40.9% among the other regions. Therefore, the Office And Contact Center Headsets market in APAC is expected to garner significant business opportunities for the vendors during the forecast period.

US, Canada, Mexico, India, China, Japan, South Korea, Australia, Indonesia, Germany, UK, France, Italy, Spain, The Netherlands, Brazil, Argentina, Chile, Saudi Arabia, UAE, South Africa, Turkey, Israel

  • Enterprise migration toward hybrid work architectures driving fleet upgrades is the driving factor this market.

The Office And Contact Center Headsets market vendors should focus on grabbing business opportunities from the Application segment as it accounted for the largest market share in the base year.
RIA - Research AI Assistant
Ask RIA
