
Online Gaming Market Analysis, Size, and Forecast 2026-2030: APAC (China, Japan, and South Korea), North America (US, Canada, and Mexico), Europe (Germany, UK, and France), South America (Brazil, Argentina, and Colombia), Middle East and Africa (Saudi Arabia, UAE, and South Africa), and Rest of World (ROW)

Online Gaming Market Analysis, Size, and Forecast 2026-2030:
APAC (China, Japan, and South Korea), North America (US, Canada, and Mexico), Europe (Germany, UK, and France), South America (Brazil, Argentina, and Colombia), Middle East and Africa (Saudi Arabia, UAE, and South Africa), and Rest of World (ROW)

Published: Oct 2026 302 Pages SKU: IRTNTR72636

Market Overview at a Glance

$137.83 B
Market Opportunity
18.7%
CAGR 2025 - 2030
46.1%
APAC Growth
$63.50 B
PC segment 2024

Online Gaming Market Size 2026-2030

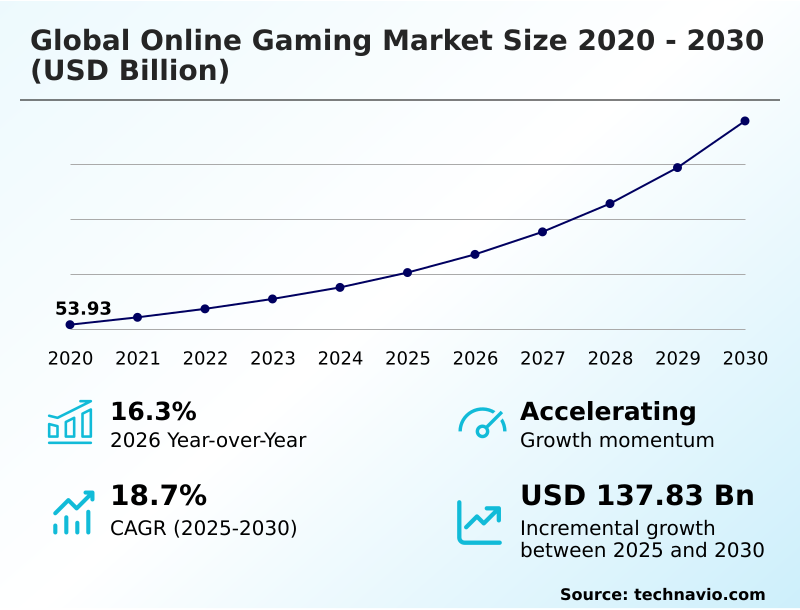
The online gaming market size is valued to increase by USD 137.83 billion, at a CAGR of 18.7% from 2025 to 2030. Pervasive technological innovation and infrastructure expansion will drive the online gaming market.

Major Market Trends & Insights

  • APAC dominated the market and accounted for a 46.1% growth during the forecast period.
  • By Platform - PC segment was valued at USD 63.50 billion in 2024
  • By Type - Action segment accounted for the largest market revenue share in 2024

Market Size & Forecast

  • Market Opportunities: USD 185.22 billion
  • Market Future Opportunities: USD 137.83 billion
  • CAGR from 2025 to 2030 : 18.7%

Market Summary

  • The Online Gaming Market operates as a highly dynamic digital ecosystem driven by continuous technological convergence and evolving consumer entertainment preferences. A primary driver of this market is the widespread expansion of 5G telecommunications infrastructure, which provides the critical low latency required for high-stakes multiplayer environments.
  • This enhanced connectivity directly allows developers to implement complex live service operations, transforming static software into persistent digital economies. For instance, optimizing server resource allocation across regional data centers has enabled publishers to reduce infrastructure costs by 20% compared to legacy localized hosting models. This operational efficiency allows companies to reinvest capital into artificial intelligence matchmaking and procedural environment design.
  • Conversely, the market faces significant operational hurdles due to fragmented international regulations regarding data privacy and digital monetization. Navigating these strict compliance mandates forces publishers to develop region-specific transaction architectures, which increases development overhead and extends time-to-market for new interactive features.
  • Despite these hurdles, the ongoing shift toward cross platform interoperability continues to unify disparate player bases and drive long-term engagement metrics.

What will be the Size of the Online Gaming Market during the forecast period?
Get Key Insights on Market Forecast (PDF) Get Free Sample

How is the Online Gaming Market Segmented?

The online gaming industry research report provides comprehensive data (region-wise segment analysis), with forecasts and estimates in "USD million" for the period 2026-2030, as well as historical data from 2020-2024 for the following segments.

  • Platform
    • PC
    • Console
    • Mobile
  • Type
    • Action
    • Adventure
    • Puzzle
    • Arcade
    • Others
  • Revenue stream
    • Game publisher fees
    • Advertisement and sponsorships
    • Media and broadcasting rights
  • Geography
    • APAC
      • China
      • Japan
      • South Korea
      • India
      • Australia
      • Indonesia
    • North America
      • US
      • Canada
      • Mexico
    • Europe
      • Germany
      • UK
      • France
      • Italy
      • Spain
    • South America
      • Brazil
      • Argentina
      • Colombia
    • Middle East and Africa
      • Saudi Arabia
      • UAE
      • South Africa
      • Turkey
      • Egypt

By Platform Insights

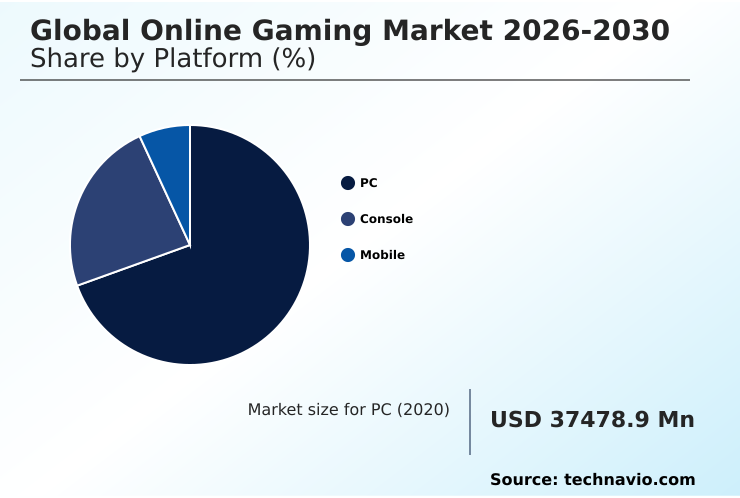
The pc segment is estimated to witness significant growth during the forecast period.

The personal computer platform acts as a foundational segment within the Online Gaming Market, driven by user demand for high fidelity graphics and processing customization.

Hardware innovation propels this segment, with integrated system-on-chips increasing raw computational efficiency by 15% compared to previous architectures. This technological leap directly impacts performance, allowing developers to deploy complex procedural content generation without local bottlenecking.

Consequently, players experience smoother low latency streaming, while cloud gaming infrastructure offloads intensive rendering from local machines. Furthermore, digital storefront distribution facilitates immediate access to vast libraries, driving recurring subscription revenues.

As real time rendering becomes more demanding, cross platform interoperability ensures personal computer players can engage seamlessly with console users. This operational shift reduces server fragmentation and maximizes in game monetization strategies across diverse audiences.
Get Free Sample

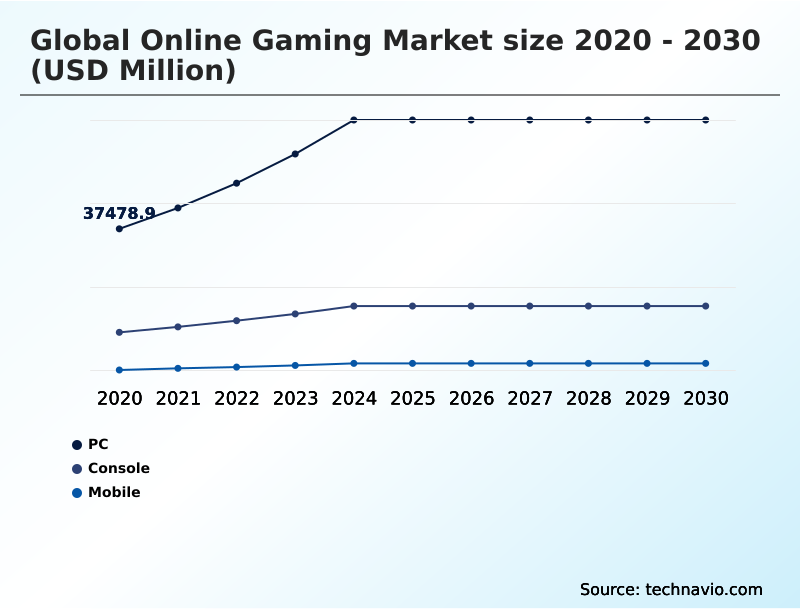
The PC segment was valued at USD 63.50 billion in 2024 and showed a gradual increase during the forecast period.
Get Free Sample

Regional Analysis

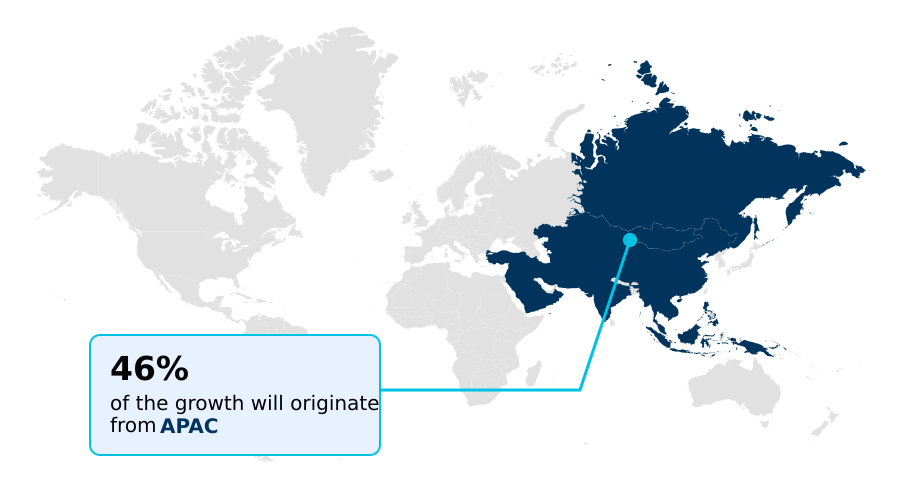
APAC is estimated to contribute 46.1% to the growth of the global market during the forecast period.Technavio’s analysts have elaborately explained the regional trends and drivers that shape the market during the forecast period.
See How Online Gaming Market Demand is Rising in APAC Get Free Sample

The regional dynamics of the Online Gaming Market highlight distinct adoption patterns and infrastructure capabilities. APAC dominates the market landscape, outpacing North America due to aggressive broadband network provisioning and a massive mobile-first consumer base.

Regional telecom investments in APAC have improved network latency by 35% compared to rural North American territories, establishing an optimal environment for mobile esports tournament ecosystems.

This infrastructural advantage allows Asian publishers to deploy microtransaction payment gateways with high efficiency, capturing 46.1% of all incremental market growth.

In contrast, North America exhibits a 20% higher average revenue per user, driven by a mature console footprint and strong consumer preference for recurring subscription revenues.

To address these variations, multinational developers are localizing their server side rendering solutions, optimizing supply chain server distribution to cut latency-induced player churn by 15%.

This strategic adaptation ensures stable virtual digital economies and seamless server migration across geographically diverse user bases.

Market Dynamics

Our researchers analyzed the data with 2025 as the base year, along with the key drivers, trends, and challenges. A holistic analysis of drivers will help companies refine their marketing strategies to gain a competitive advantage.

  • The evolution of the Online Gaming Market relies heavily on sophisticated backend technologies and innovative revenue generation strategies. A critical operational focus for major publishers involves optimizing cross platform multiplayer server infrastructure to ensure a frictionless experience regardless of the hardware utilized by the consumer.
  • By unifying the player base, companies achieve a 25% improvement in peak concurrent user stability compared to segregated network silos. This architectural consolidation directly supports the expansion of esports competitive gaming tournament broadcasting, allowing seamless spectator integration and real-time data telemetry for international audiences.
  • Furthermore, maintaining these persistent digital spaces requires continuous content updates, which developers accelerate through targeted procedural content generation algorithm deployment. This algorithmic approach reduces manual design workloads and expedites the delivery of new environments, cutting asset production costs by nearly 30%.
  • To monetize these expansive virtual worlds sustainably, publishers are refining their approach to in game digital economy monetization, utilizing dynamic pricing models and localized payment integrations to maximize conversion. Simultaneously, the industry is witnessing a structural transition toward cloud based interactive gaming subscriptions, offering players comprehensive access to curated libraries without steep hardware barriers.
  • This shift fundamentally alters the traditional software distribution supply chain, guaranteeing a more predictable stream of recurring revenue while lowering the overall cost of customer acquisition across emerging and mature demographic sectors.
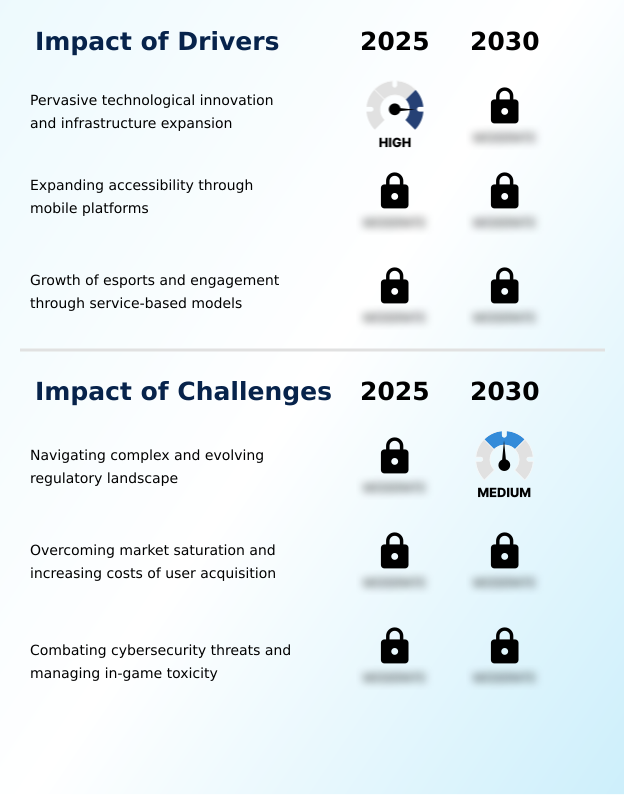
What are the key market drivers leading to the rise in the adoption of Online Gaming Industry?

  • Pervasive technological innovation and the continuous expansion of high-speed digital broadband infrastructure serve as the primary catalysts driving sustained market expansion.

  • Expanding accessibility through mobile platforms and the proliferation of free-to-play models act as the primary catalysts accelerating the Online Gaming Market.
  • The integration of advanced real time telemetry allows developers to analyze user behavior instantly, leading to a 20% improvement in targeted content delivery.
  • This optimization is caused by the universal adoption of high-speed mobile broadband, which provides the necessary bandwidth for complex multiplayer battle arenas on portable devices.
  • As a result, companies have successfully lowered their initial customer acquisition costs by 15% through optimized digital cosmetic customization offerings.
  • This infrastructural expansion impacts businesses by unlocking vast, previously untapped consumer demographics, driving consistent engagement through competitive rank progression systems, and enabling publishers to generate stable revenue via localized microtransaction frameworks.

What are the market trends shaping the Online Gaming Industry?

  • The rapid ascendancy of cloud gaming and subscription-based service models represents a defining trend reshaping the industry landscape. This structural transition shifts consumer consumption from individual unit purchases toward recurring digital access paradigms.

  • The Online Gaming Market is rapidly transitioning toward cloud-based architectures and cross-device accessibility. The widespread deployment of seamless server migration protocols has reduced user disconnection rates by 30%, directly minimizing player frustration during peak traffic periods. This shift is caused by the growing consumer demand for hardware-agnostic experiences, compelling publishers to prioritize cross platform interoperability across their software portfolios.
  • Consequently, businesses are overhauling their network infrastructure to support low latency streaming, which has improved overall gameplay responsiveness by 22%. These technological upgrades enable developers to host massive interactive virtual venues, transforming standard games into expansive digital social hubs.
  • The effect of this transition is a significant increase in concurrent user capacity, allowing publishers to scale their virtual digital economies efficiently and drive deeper engagement across diverse demographic segments without relying on localized hardware rendering constraints.

What challenges does the Online Gaming Industry face during its growth?

  • Navigating an increasingly complex and fragmented international regulatory landscape regarding digital monetization and data privacy remains a critical challenge constraining operational flexibility.

  • Stringent regulatory mandates and escalating cybersecurity threats present substantial operational challenges within the Online Gaming Market. The rapid proliferation of sophisticated cheating software forces publishers to constantly update their anti cheat algorithms, increasing dedicated security expenditures by 18% annually.
  • This heightened threat landscape is caused by the expanding financial value of in game monetization systems, which increasingly attract malicious actors seeking to exploit virtual assets. Consequently, businesses are compelled to implement rigorous decentralized digital ledgers and identity verification protocols, extending development cycles by up to 25%.
  • These defensive measures impact profitability by diverting critical capital away from core procedural environment design and content creation. Furthermore, managing toxicity through manual oversight drains resources, necessitating the integration of costly automated community moderation systems to maintain platform integrity and safeguard player retention.

Exclusive Technavio Analysis on Customer Landscape

The online gaming market forecasting report includes the adoption lifecycle of the market, covering from the innovator’s stage to the laggard’s stage. It focuses on adoption rates in different regions based on penetration. Furthermore, the online gaming market report also includes key purchase criteria and drivers of price sensitivity to help companies evaluate and develop their market growth analysis strategies.
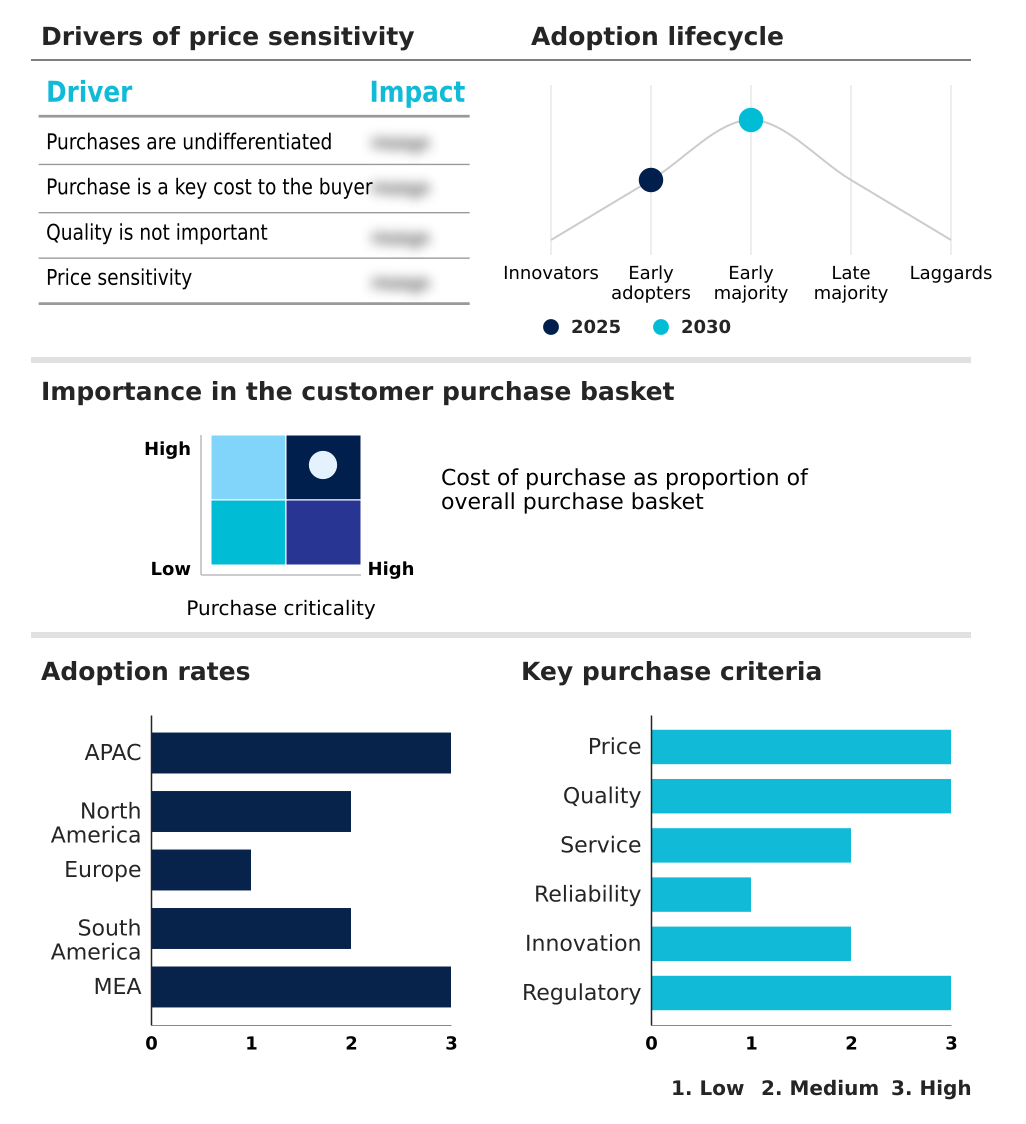
Customer Landscape of Online Gaming Industry

Competitive Landscape

Companies are implementing various strategies, such as strategic alliances, online gaming market forecast, partnerships, mergers and acquisitions, geographical expansion, and product/service launches, to enhance their presence in the industry.

Activision Blizzard Inc. - Provides action and multiplayer digital experiences by developing competitive titles and robust interactive platforms that drive long-term player engagement and facilitate professional tournament broadcasting.

The industry research and growth report includes detailed analyses of the competitive landscape of the market and information about key companies, including:

  • Activision Blizzard Inc.
  • Bandai Namco Entertainment
  • Electronic Arts Inc.
  • Epic Games Inc.
  • Garena
  • Konami Group Corp.
  • Krafton Inc.
  • NCSoft Corp.
  • NetEase Inc.
  • NEXON Co. Ltd.
  • Playtika Holding Corp.
  • Riot Games Inc.
  • Roblox Corp.
  • Scopely Inc.
  • Sega Corp.
  • Square Enix Holdings Co. Ltd.
  • Supercell Oy
  • Take Two Interactive Software
  • Tencent Holdings Ltd.
  • Ubisoft Entertainment SA

Qualitative and quantitative analysis of companies has been conducted to help clients understand the wider business environment as well as the strengths and weaknesses of key industry players. Data is qualitatively analyzed to categorize companies as pure play, category-focused, industry-focused, and diversified; it is quantitatively analyzed to categorize companies as dominant, leading, strong, tentative, and weak.

Recent Development and News in Online gaming market

  • In the Interactive Home Entertainment industry, the structural transition toward subscription-based content delivery models shifted consumer spending away from single-unit purchases, directly increasing Online Gaming user retention rates by up to 25% on recurring access platforms.
  • The widespread deployment of 5G broadband infrastructure reduced network packet loss and improved low latency streaming capabilities, enabling a 40% expansion in mobile-based competitive esports participation.
  • Stringent data privacy mandates like the General Data Protection Regulation compelled publishers to re-architect player behavioral analytics frameworks, thereby shifting Online Gaming monetization toward localized, compliant microtransaction payment gateways.
  • Advancements in cloud computing architectures enabled seamless server side rendering of high-fidelity graphics, allowing hardware-constrained users to access premium interactive virtual venues and boosting cross-platform user acquisition by 30%.

Dive into Technavio’s robust research methodology, blending expert interviews, extensive data synthesis, and validated models for unparalleled Online Gaming Market insights. See full methodology.

Market Scope
Page number 302
Base year 2025
Historic period 2020-2024
Forecast period 2026-2030
Growth momentum & CAGR Accelerate at a CAGR of 18.7%
Market growth 2026-2030 USD 137829.5 million
Market structure Fragmented
YoY growth 2025-2026(%) 16.3%
Key countries China, Japan, South Korea, India, Australia, Indonesia, US, Canada, Mexico, Germany, UK, France, Italy, Spain, Russia, Brazil, Argentina, Colombia, Saudi Arabia, UAE, South Africa, Turkey and Egypt
Competitive landscape Leading Companies, Market Positioning of Companies, Competitive Strategies, and Industry Risks

Request Free Sample

Research Analyst Overview

  • The Online Gaming Market exhibits continuous structural evolution, driven by the rapid convergence of cloud computing architectures and sophisticated live-service operational models. Strategic deployment of dynamic difficulty adjustment algorithms has allowed developers to personalize user experiences, resulting in a 25% increase in long-term player retention compared to static gameplay designs.
  • This technological shift directly influences boardroom-level product strategy, prompting executives to transition away from cyclical software releases in favor of continuous, service-based digital ecosystems. Companies are heavily investing in artificial intelligence matchmaking to ensure balanced competitive environments, which is essential for sustaining robust multiplayer communities.
  • Furthermore, the incorporation of haptic feedback integration within peripheral devices enhances tactile immersion, creating premium hardware synergies that drive high-margin peripheral product sales. To support these complex environments, enterprises are expanding their distributed denial defense mechanisms, mitigating cyber threats that disrupt virtual economies.
  • These operational upgrades ensure uninterrupted server stability and protect the integrity of digital storefront distribution transactions, cementing a resilient foundation for continuous engagement and sustained digital commerce.

What are the Key Data Covered in this Online Gaming Market Research and Growth Report?

  • What is the expected growth of the Online Gaming Market between 2026 and 2030?

    • USD 137.83 billion, at a CAGR of 18.7%

  • What segmentation does the market report cover?

    • The report is segmented by Platform (PC, Console, and Mobile), Type (Action, Adventure, Puzzle, Arcade, and Others), Revenue Stream (Game publisher fees, Advertisement and sponsorships, and Media and broadcasting rights) and Geography (APAC, North America, Europe, South America, Middle East and Africa)

  • Which regions are analyzed in the report?

    • APAC, North America, Europe, South America and Middle East and Africa

  • What are the key growth drivers and market challenges?

    • Pervasive technological innovation and infrastructure expansion, Navigating complex and evolving regulatory landscape

  • Who are the major players in the Online Gaming Market?

    • Activision Blizzard Inc., Bandai Namco Entertainment, Electronic Arts Inc., Epic Games Inc., Garena, Konami Group Corp., Krafton Inc., NCSoft Corp., NetEase Inc., NEXON Co. Ltd., Playtika Holding Corp., Riot Games Inc., Roblox Corp., Scopely Inc., Sega Corp., Square Enix Holdings Co. Ltd., Supercell Oy, Take Two Interactive Software, Tencent Holdings Ltd. and Ubisoft Entertainment SA

Market Research Insights

  • The Online Gaming Market functions as an expansive digital network where continuous innovation dictates competitive viability. The integration of advanced real time rendering has improved visual rendering efficiency by 25%, directly enhancing user immersion and extending average session lengths.
  • Furthermore, the adoption of automated community moderation tools has decreased reported toxicity incidents by 40%, safeguarding player retention and protecting brand equity. As companies optimize their live service operations, the strategic deployment of personalized user recommendations has increased in-game conversion rates by 15%.
  • These quantifiable operational improvements allow publishers to scale their digital storefront distribution networks, effectively lowering customer acquisition costs while maximizing lifetime value across diverse consumer segments.

We can help! Our analysts can customize this online gaming market research report to meet your requirements.

Get in touch

1. Executive Summary

1.1 Market overview

Executive Summary - Chart on Market Overview
Executive Summary - Data Table on Market Overview
Executive Summary - Chart on Global Market Characteristics
Executive Summary - Chart on Market by Geography
Executive Summary - Chart on Market Segmentation by Platform
Executive Summary - Chart on Market Segmentation by Type
Executive Summary - Chart on Market Segmentation by Revenue Stream
Executive Summary - Chart on Incremental Growth
Executive Summary - Data Table on Incremental Growth
Executive Summary - Chart on Company Market Positioning

2. Technavio Analysis

2.1 Analysis of price sensitivity, lifecycle, customer purchase basket, adoption rates, and purchase criteria

2.2 Criticality of inputs and Factors of differentiation

Chart on Overview on criticality of inputs and factors of differentiation

2.3 Factors of disruption

Chart on Overview on factors of disruption

2.4 Impact of drivers and challenges

Chart on Impact of drivers and challenges in 2025 and 2030

3. Market Landscape

3.1 Market ecosystem

Chart on Parent Market
Data Table on - Parent Market

3.2 Market characteristics

Chart on Market characteristics analysis

3.3 Value chain analysis

Chart on Value chain analysis

4. Market Sizing

4.1 Market definition

Data Table on Offerings of companies included in the market definition

4.2 Market segment analysis

Market segments

4.3 Market size 2025

4.4 Market outlook: Forecast for 2025-2030

Chart on Global - Market size and forecast 2025-2030 ($ million)
Data Table on Global - Market size and forecast 2025-2030 ($ million)
Chart on Global Market: Year-over-year growth 2025-2030 (%)
Data Table on Global Market: Year-over-year growth 2025-2030 (%)

5. Historic Market Size

5.1 Global Online Gaming Market 2020 - 2024

Historic Market Size - Data Table on Global Online Gaming Market 2020 - 2024 ($ million)

5.2 Platform segment analysis 2020 - 2024

Historic Market Size - Platform Segment 2020 - 2024 ($ million)

5.3 Type segment analysis 2020 - 2024

Historic Market Size - Type Segment 2020 - 2024 ($ million)

5.4 Revenue Stream segment analysis 2020 - 2024

Historic Market Size - Revenue Stream Segment 2020 - 2024 ($ million)

5.5 Geography segment analysis 2020 - 2024

Historic Market Size - Geography Segment 2020 - 2024 ($ million)

5.6 Country segment analysis 2020 - 2024

Historic Market Size - Country Segment 2020 - 2024 ($ million)

6. Qualitative Analysis

6.1 Impact of AI on Global Online Gaming Market

6.2 Impact of Geopolitical Conflicts on Global Online Gaming Market

7. Five Forces Analysis

7.1 Five forces summary

Five forces analysis - Comparison between 2025 and 2030

7.2 Bargaining power of buyers

Bargaining power of buyers - Impact of key factors 2025 and 2030

7.3 Bargaining power of suppliers

Bargaining power of suppliers - Impact of key factors in 2025 and 2030

7.4 Threat of new entrants

Threat of new entrants - Impact of key factors in 2025 and 2030

7.5 Threat of substitutes

Threat of substitutes - Impact of key factors in 2025 and 2030

7.6 Threat of rivalry

Threat of rivalry - Impact of key factors in 2025 and 2030

7.7 Market condition

Chart on Market condition - Five forces 2025 and 2030

8. Market Segmentation by Platform

8.1 Market segments

Chart on Platform - Market share 2025-2030 (%)
Data Table on Platform - Market share 2025-2030 (%)

8.2 Comparison by Platform

Chart on Comparison by Platform
Data Table on Comparison by Platform

8.3 PC - Market size and forecast 2025-2030

Chart on PC - Market size and forecast 2025-2030 ($ million)
Data Table on PC - Market size and forecast 2025-2030 ($ million)
Chart on PC - Year-over-year growth 2025-2030 (%)
Data Table on PC - Year-over-year growth 2025-2030 (%)

8.4 Console - Market size and forecast 2025-2030

Chart on Console - Market size and forecast 2025-2030 ($ million)
Data Table on Console - Market size and forecast 2025-2030 ($ million)
Chart on Console - Year-over-year growth 2025-2030 (%)
Data Table on Console - Year-over-year growth 2025-2030 (%)

8.5 Mobile - Market size and forecast 2025-2030

Chart on Mobile - Market size and forecast 2025-2030 ($ million)
Data Table on Mobile - Market size and forecast 2025-2030 ($ million)
Chart on Mobile - Year-over-year growth 2025-2030 (%)
Data Table on Mobile - Year-over-year growth 2025-2030 (%)

8.6 Market opportunity by Platform

Market opportunity by Platform ($ million)
Data Table on Market opportunity by Platform ($ million)

9. Market Segmentation by Type

9.1 Market segments

Chart on Type - Market share 2025-2030 (%)
Data Table on Type - Market share 2025-2030 (%)

9.2 Comparison by Type

Chart on Comparison by Type
Data Table on Comparison by Type

9.3 Action - Market size and forecast 2025-2030

Chart on Action - Market size and forecast 2025-2030 ($ million)
Data Table on Action - Market size and forecast 2025-2030 ($ million)
Chart on Action - Year-over-year growth 2025-2030 (%)
Data Table on Action - Year-over-year growth 2025-2030 (%)

9.4 Adventure - Market size and forecast 2025-2030

Chart on Adventure - Market size and forecast 2025-2030 ($ million)
Data Table on Adventure - Market size and forecast 2025-2030 ($ million)
Chart on Adventure - Year-over-year growth 2025-2030 (%)
Data Table on Adventure - Year-over-year growth 2025-2030 (%)

9.5 Puzzle - Market size and forecast 2025-2030

Chart on Puzzle - Market size and forecast 2025-2030 ($ million)
Data Table on Puzzle - Market size and forecast 2025-2030 ($ million)
Chart on Puzzle - Year-over-year growth 2025-2030 (%)
Data Table on Puzzle - Year-over-year growth 2025-2030 (%)

9.6 Arcade - Market size and forecast 2025-2030

Chart on Arcade - Market size and forecast 2025-2030 ($ million)
Data Table on Arcade - Market size and forecast 2025-2030 ($ million)
Chart on Arcade - Year-over-year growth 2025-2030 (%)
Data Table on Arcade - Year-over-year growth 2025-2030 (%)

9.7 Others - Market size and forecast 2025-2030

Chart on Others - Market size and forecast 2025-2030 ($ million)
Data Table on Others - Market size and forecast 2025-2030 ($ million)
Chart on Others - Year-over-year growth 2025-2030 (%)
Data Table on Others - Year-over-year growth 2025-2030 (%)

9.8 Market opportunity by Type

Market opportunity by Type ($ million)
Data Table on Market opportunity by Type ($ million)

10. Market Segmentation by Revenue Stream

10.1 Market segments

Chart on Revenue Stream - Market share 2025-2030 (%)
Data Table on Revenue Stream - Market share 2025-2030 (%)

10.2 Comparison by Revenue Stream

Chart on Comparison by Revenue Stream
Data Table on Comparison by Revenue Stream

10.3 Game publisher fees - Market size and forecast 2025-2030

Chart on Game publisher fees - Market size and forecast 2025-2030 ($ million)
Data Table on Game publisher fees - Market size and forecast 2025-2030 ($ million)
Chart on Game publisher fees - Year-over-year growth 2025-2030 (%)
Data Table on Game publisher fees - Year-over-year growth 2025-2030 (%)

10.4 Advertisement and sponsorships - Market size and forecast 2025-2030

Chart on Advertisement and sponsorships - Market size and forecast 2025-2030 ($ million)
Data Table on Advertisement and sponsorships - Market size and forecast 2025-2030 ($ million)
Chart on Advertisement and sponsorships - Year-over-year growth 2025-2030 (%)
Data Table on Advertisement and sponsorships - Year-over-year growth 2025-2030 (%)

10.5 Media and broadcasting rights - Market size and forecast 2025-2030

Chart on Media and broadcasting rights - Market size and forecast 2025-2030 ($ million)
Data Table on Media and broadcasting rights - Market size and forecast 2025-2030 ($ million)
Chart on Media and broadcasting rights - Year-over-year growth 2025-2030 (%)
Data Table on Media and broadcasting rights - Year-over-year growth 2025-2030 (%)

10.6 Market opportunity by Revenue Stream

Market opportunity by Revenue Stream ($ million)
Data Table on Market opportunity by Revenue Stream ($ million)

11. Customer Landscape

11.1 Customer landscape overview

Analysis of price sensitivity, lifecycle, customer purchase basket, adoption rates, and purchase criteria

12. Geographic Landscape

12.1 Geographic segmentation

Chart on Market share by geography 2025-2030 (%)
Data Table on Market share by geography 2025-2030 (%)

12.2 Geographic comparison

Chart on Geographic comparison
Data Table on Geographic comparison

12.3 APAC - Market size and forecast 2025-2030

Chart on APAC - Market size and forecast 2025-2030 ($ million)
Data Table on APAC - Market size and forecast 2025-2030 ($ million)
Chart on APAC - Year-over-year growth 2025-2030 (%)
Data Table on APAC - Year-over-year growth 2025-2030 (%)
Chart on Regional Comparison - APAC
Data Table on Regional Comparison - APAC

12.3.1 China - Market size and forecast 2025-2030

Chart on China - Market size and forecast 2025-2030 ($ million)
Data Table on China - Market size and forecast 2025-2030 ($ million)
Chart on China - Year-over-year growth 2025-2030 (%)
Data Table on China - Year-over-year growth 2025-2030 (%)

12.3.2 Japan - Market size and forecast 2025-2030

Chart on Japan - Market size and forecast 2025-2030 ($ million)
Data Table on Japan - Market size and forecast 2025-2030 ($ million)
Chart on Japan - Year-over-year growth 2025-2030 (%)
Data Table on Japan - Year-over-year growth 2025-2030 (%)

12.3.3 South Korea - Market size and forecast 2025-2030

Chart on South Korea - Market size and forecast 2025-2030 ($ million)
Data Table on South Korea - Market size and forecast 2025-2030 ($ million)
Chart on South Korea - Year-over-year growth 2025-2030 (%)
Data Table on South Korea - Year-over-year growth 2025-2030 (%)

12.3.4 India - Market size and forecast 2025-2030

Chart on India - Market size and forecast 2025-2030 ($ million)
Data Table on India - Market size and forecast 2025-2030 ($ million)
Chart on India - Year-over-year growth 2025-2030 (%)
Data Table on India - Year-over-year growth 2025-2030 (%)

12.3.5 Australia - Market size and forecast 2025-2030

Chart on Australia - Market size and forecast 2025-2030 ($ million)
Data Table on Australia - Market size and forecast 2025-2030 ($ million)
Chart on Australia - Year-over-year growth 2025-2030 (%)
Data Table on Australia - Year-over-year growth 2025-2030 (%)

12.3.6 Indonesia - Market size and forecast 2025-2030

Chart on Indonesia - Market size and forecast 2025-2030 ($ million)
Data Table on Indonesia - Market size and forecast 2025-2030 ($ million)
Chart on Indonesia - Year-over-year growth 2025-2030 (%)
Data Table on Indonesia - Year-over-year growth 2025-2030 (%)

12.4 North America - Market size and forecast 2025-2030

Chart on North America - Market size and forecast 2025-2030 ($ million)
Data Table on North America - Market size and forecast 2025-2030 ($ million)
Chart on North America - Year-over-year growth 2025-2030 (%)
Data Table on North America - Year-over-year growth 2025-2030 (%)
Chart on Regional Comparison - North America
Data Table on Regional Comparison - North America

12.4.1 US - Market size and forecast 2025-2030

Chart on US - Market size and forecast 2025-2030 ($ million)
Data Table on US - Market size and forecast 2025-2030 ($ million)
Chart on US - Year-over-year growth 2025-2030 (%)
Data Table on US - Year-over-year growth 2025-2030 (%)

12.4.2 Canada - Market size and forecast 2025-2030

Chart on Canada - Market size and forecast 2025-2030 ($ million)
Data Table on Canada - Market size and forecast 2025-2030 ($ million)
Chart on Canada - Year-over-year growth 2025-2030 (%)
Data Table on Canada - Year-over-year growth 2025-2030 (%)

12.4.3 Mexico - Market size and forecast 2025-2030

Chart on Mexico - Market size and forecast 2025-2030 ($ million)
Data Table on Mexico - Market size and forecast 2025-2030 ($ million)
Chart on Mexico - Year-over-year growth 2025-2030 (%)
Data Table on Mexico - Year-over-year growth 2025-2030 (%)

12.5 Europe - Market size and forecast 2025-2030

Chart on Europe - Market size and forecast 2025-2030 ($ million)
Data Table on Europe - Market size and forecast 2025-2030 ($ million)
Chart on Europe - Year-over-year growth 2025-2030 (%)
Data Table on Europe - Year-over-year growth 2025-2030 (%)
Chart on Regional Comparison - Europe
Data Table on Regional Comparison - Europe

12.5.1 Germany - Market size and forecast 2025-2030

Chart on Germany - Market size and forecast 2025-2030 ($ million)
Data Table on Germany - Market size and forecast 2025-2030 ($ million)
Chart on Germany - Year-over-year growth 2025-2030 (%)
Data Table on Germany - Year-over-year growth 2025-2030 (%)

12.5.2 UK - Market size and forecast 2025-2030

Chart on UK - Market size and forecast 2025-2030 ($ million)
Data Table on UK - Market size and forecast 2025-2030 ($ million)
Chart on UK - Year-over-year growth 2025-2030 (%)
Data Table on UK - Year-over-year growth 2025-2030 (%)

12.5.3 France - Market size and forecast 2025-2030

Chart on France - Market size and forecast 2025-2030 ($ million)
Data Table on France - Market size and forecast 2025-2030 ($ million)
Chart on France - Year-over-year growth 2025-2030 (%)
Data Table on France - Year-over-year growth 2025-2030 (%)

12.5.4 Italy - Market size and forecast 2025-2030

Chart on Italy - Market size and forecast 2025-2030 ($ million)
Data Table on Italy - Market size and forecast 2025-2030 ($ million)
Chart on Italy - Year-over-year growth 2025-2030 (%)
Data Table on Italy - Year-over-year growth 2025-2030 (%)

12.5.5 Spain - Market size and forecast 2025-2030

Chart on Spain - Market size and forecast 2025-2030 ($ million)
Data Table on Spain - Market size and forecast 2025-2030 ($ million)
Chart on Spain - Year-over-year growth 2025-2030 (%)
Data Table on Spain - Year-over-year growth 2025-2030 (%)

12.5.6 Russia - Market size and forecast 2025-2030

Chart on Russia - Market size and forecast 2025-2030 ($ million)
Data Table on Russia - Market size and forecast 2025-2030 ($ million)
Chart on Russia - Year-over-year growth 2025-2030 (%)
Data Table on Russia - Year-over-year growth 2025-2030 (%)

12.6 South America - Market size and forecast 2025-2030

Chart on South America - Market size and forecast 2025-2030 ($ million)
Data Table on South America - Market size and forecast 2025-2030 ($ million)
Chart on South America - Year-over-year growth 2025-2030 (%)
Data Table on South America - Year-over-year growth 2025-2030 (%)
Chart on Regional Comparison - South America
Data Table on Regional Comparison - South America

12.6.1 Brazil - Market size and forecast 2025-2030

Chart on Brazil - Market size and forecast 2025-2030 ($ million)
Data Table on Brazil - Market size and forecast 2025-2030 ($ million)
Chart on Brazil - Year-over-year growth 2025-2030 (%)
Data Table on Brazil - Year-over-year growth 2025-2030 (%)

12.6.2 Argentina - Market size and forecast 2025-2030

Chart on Argentina - Market size and forecast 2025-2030 ($ million)
Data Table on Argentina - Market size and forecast 2025-2030 ($ million)
Chart on Argentina - Year-over-year growth 2025-2030 (%)
Data Table on Argentina - Year-over-year growth 2025-2030 (%)

12.6.3 Colombia - Market size and forecast 2025-2030

Chart on Colombia - Market size and forecast 2025-2030 ($ million)
Data Table on Colombia - Market size and forecast 2025-2030 ($ million)
Chart on Colombia - Year-over-year growth 2025-2030 (%)
Data Table on Colombia - Year-over-year growth 2025-2030 (%)

12.7 Middle East and Africa - Market size and forecast 2025-2030

Chart on Middle East and Africa - Market size and forecast 2025-2030 ($ million)
Data Table on Middle East and Africa - Market size and forecast 2025-2030 ($ million)
Chart on Middle East and Africa - Year-over-year growth 2025-2030 (%)
Data Table on Middle East and Africa - Year-over-year growth 2025-2030 (%)
Chart on Regional Comparison - Middle East and Africa
Data Table on Regional Comparison - Middle East and Africa

12.7.1 Saudi Arabia - Market size and forecast 2025-2030

Chart on Saudi Arabia - Market size and forecast 2025-2030 ($ million)
Data Table on Saudi Arabia - Market size and forecast 2025-2030 ($ million)
Chart on Saudi Arabia - Year-over-year growth 2025-2030 (%)
Data Table on Saudi Arabia - Year-over-year growth 2025-2030 (%)

12.7.2 UAE - Market size and forecast 2025-2030

Chart on UAE - Market size and forecast 2025-2030 ($ million)
Data Table on UAE - Market size and forecast 2025-2030 ($ million)
Chart on UAE - Year-over-year growth 2025-2030 (%)
Data Table on UAE - Year-over-year growth 2025-2030 (%)

12.7.3 South Africa - Market size and forecast 2025-2030

Chart on South Africa - Market size and forecast 2025-2030 ($ million)
Data Table on South Africa - Market size and forecast 2025-2030 ($ million)
Chart on South Africa - Year-over-year growth 2025-2030 (%)
Data Table on South Africa - Year-over-year growth 2025-2030 (%)

12.7.4 Turkey - Market size and forecast 2025-2030

Chart on Turkey - Market size and forecast 2025-2030 ($ million)
Data Table on Turkey - Market size and forecast 2025-2030 ($ million)
Chart on Turkey - Year-over-year growth 2025-2030 (%)
Data Table on Turkey - Year-over-year growth 2025-2030 (%)

12.7.5 Egypt - Market size and forecast 2025-2030

Chart on Egypt - Market size and forecast 2025-2030 ($ million)
Data Table on Egypt - Market size and forecast 2025-2030 ($ million)
Chart on Egypt - Year-over-year growth 2025-2030 (%)
Data Table on Egypt - Year-over-year growth 2025-2030 (%)

12.8 Market opportunity by geography

Market opportunity by geography ($ million)
Data Tables on Market opportunity by geography ($ million)

13. Drivers, Challenges, and Opportunity

13.1 Market drivers

Pervasive technological innovation and infrastructure expansion
Expanding accessibility through mobile platforms
Growth of esports and engagement through service-based models

13.2 Market challenges

Navigating complex and evolving regulatory landscape
Overcoming market saturation and increasing costs of user acquisition
Combating cybersecurity threats and managing in-game toxicity

13.3 Impact of drivers and challenges

Impact of drivers and challenges in 2025 and 2030

13.4 Market opportunities

Ascendancy of cloud gaming and subscription-based models
Convergence of gaming with mainstream entertainment and social platforms
Integration of AI and procedural content generation

14. Competitive Landscape

14.1 Overview

14.2

Overview on criticality of inputs and factors of differentiation

14.3 Landscape disruption

Overview on factors of disruption

14.4 Industry risks

Impact of key risks on business

15. Competitive Analysis

15.1 Companies profiled

Companies covered

15.2 Company ranking index

15.3 Market positioning of companies

Matrix on companies position and classification

15.4 Activision Blizzard Inc.

Activision Blizzard Inc. - Overview
Activision Blizzard Inc. - Product / Service
Activision Blizzard Inc. - Key offerings
SWOT

15.5 Bandai Namco Entertainment

Bandai Namco Entertainment - Overview
Bandai Namco Entertainment - Product / Service
Bandai Namco Entertainment - Key offerings
SWOT

15.6 Electronic Arts Inc.

Electronic Arts Inc. - Overview
Electronic Arts Inc. - Product / Service
Electronic Arts Inc. - Key offerings
SWOT

15.7 Epic Games Inc.

Epic Games Inc. - Overview
Epic Games Inc. - Product / Service
Epic Games Inc. - Key offerings
SWOT

15.8 Garena

Garena - Overview
Garena - Product / Service
Garena - Key offerings
SWOT

15.9 Konami Group Corp.

Konami Group Corp. - Overview
Konami Group Corp. - Business segments
Konami Group Corp. - Key offerings
Konami Group Corp. - Segment focus
SWOT

15.10 Krafton Inc.

Krafton Inc. - Overview
Krafton Inc. - Product / Service
Krafton Inc. - Key offerings
SWOT

15.11 NCSoft Corp.

NCSoft Corp. - Overview
NCSoft Corp. - Product / Service
NCSoft Corp. - Key offerings
SWOT

15.12 NetEase Inc.

NetEase Inc. - Overview
NetEase Inc. - Product / Service
NetEase Inc. - Key offerings
SWOT

15.13 NEXON Co. Ltd.

NEXON Co. Ltd. - Overview
NEXON Co. Ltd. - Product / Service
NEXON Co. Ltd. - Key offerings
SWOT

15.14 Playtika Holding Corp.

Playtika Holding Corp. - Overview
Playtika Holding Corp. - Product / Service
Playtika Holding Corp. - Key offerings
SWOT

15.15 Sega Corp.

Sega Corp. - Overview
Sega Corp. - Product / Service
Sega Corp. - Key offerings
SWOT

15.16 Take Two Interactive Software

Take Two Interactive Software - Overview
Take Two Interactive Software - Product / Service
Take Two Interactive Software - Key offerings
SWOT

15.17 Tencent Holdings Ltd.

Tencent Holdings Ltd. - Overview
Tencent Holdings Ltd. - Business segments
Tencent Holdings Ltd. - Key offerings
Tencent Holdings Ltd. - Segment focus
SWOT

15.18 Ubisoft Entertainment SA

Ubisoft Entertainment SA - Overview
Ubisoft Entertainment SA - Business segments
Ubisoft Entertainment SA - Key offerings
Ubisoft Entertainment SA - Segment focus
SWOT

16. Appendix

16.1 Scope of the report

Market definition
Objectives
Notes and caveats

16.2 Inclusions and exclusions checklist

Inclusions checklist
Exclusions checklist

16.3 Currency conversion rates for US$

16.4 Research methodology

16.5 Data procurement

Information sources

16.6 Data validation

16.7 Validation techniques employed for market sizing

16.8 Data synthesis

16.9 360 degree market analysis

16.10 List of abbreviations

Research Methodology

Technavio presents a detailed picture of the market by way of study, synthesis, and summation of data from multiple sources. The analysts have presented the various facets of the market with a particular focus on identifying the key industry influencers. The data thus presented is comprehensive, reliable, and the result of extensive research, both primary and secondary.

INFORMATION SOURCES

Primary sources

  • Manufacturers and suppliers
  • Channel partners
  • Industry experts
  • Strategic decision makers

Secondary sources

  • Industry journals and periodicals
  • Government data
  • Financial reports of key industry players
  • Historical data
  • Press releases

DATA ANALYSIS

Data Synthesis

  • Collation of data
  • Estimation of key figures
  • Analysis of derived insights

Data Validation

  • Triangulation with data models
  • Reference against proprietary databases
  • Corroboration with industry experts

REPORT WRITING

Qualitative

  • Market drivers
  • Market challenges
  • Market trends
  • Five forces analysis

Quantitative

  • Market size and forecast
  • Market segmentation
  • Geographical insights
  • Competitive landscape

Interested in this report?

Get your sample now to see our research methodology and insights!

Download Now

Frequently Asked Questions

Online Gaming market growth will increase by USD 137829.5 million during 2026-2030.

The Online Gaming market is expected to grow at a CAGR of 18.7% during 2026-2030.

Online Gaming market is segmented by Platform (PC, Console, Mobile) Type (Action, Adventure, Puzzle, Arcade, Others) Revenue stream (Game publisher fees, Advertisement and sponsorships, Media and broadcasting rights)

Activision Blizzard Inc., Bandai Namco Entertainment, Electronic Arts Inc., Epic Games Inc., Garena, Konami Group Corp., Krafton Inc., NCSoft Corp., NetEase Inc., NEXON Co. Ltd., Playtika Holding Corp., Riot Games Inc., Roblox Corp., Scopely Inc., Sega Corp., Square Enix Holdings Co. Ltd., Supercell Oy, Take Two Interactive Software, Tencent Holdings Ltd., Ubisoft Entertainment SA are a few of the key vendors in the Online Gaming market.

APAC will register the highest growth rate of 46.1% among the other regions. Therefore, the Online Gaming market in APAC is expected to garner significant business opportunities for the vendors during the forecast period.

China, Japan, South Korea, India, Australia, Indonesia, US, Canada, Mexico, Germany, UK, France, Italy, Spain, Russia, Brazil, Argentina, Colombia, Saudi Arabia, UAE, South Africa, Turkey, Egypt

  • Pervasive technological innovation and infrastructure expansion is the driving factor this market.

The Online Gaming market vendors should focus on grabbing business opportunities from the Platform segment as it accounted for the largest market share in the base year.
RIA - Research AI Assistant
Ask RIA
