
Operations Support Business Support Software Market Analysis, Size, and Forecast 2026-2030: North America (US, Canada, and Mexico), Europe (Germany, UK, and France), APAC (China, Japan, and India), South America (Brazil, Argentina, and Chile), Middle East and Africa (Saudi Arabia, UAE, and South Africa), and Rest of World (ROW)

Operations Support Business Support Software Market Analysis, Size, and Forecast 2026-2030:
North America (US, Canada, and Mexico), Europe (Germany, UK, and France), APAC (China, Japan, and India), South America (Brazil, Argentina, and Chile), Middle East and Africa (Saudi Arabia, UAE, and South Africa), and Rest of World (ROW)

Published: Oct 2026 318 Pages SKU: IRTNTR44368

Market Overview at a Glance

$104.40 B
Market Opportunity
16.9%
CAGR 2025 - 2030
28.9%
APAC Growth
$38.69 B
BSS segment 2024

Operations Support Business Support Software Market Size 2026-2030

The operations support business support software market size is valued to increase by USD 104.40 billion, at a CAGR of 16.9% from 2025 to 2030. Monetization imperative for 5G standalone network slicing will drive the operations support business support software market.

Major Market Trends & Insights

  • APAC dominated the market and accounted for a 28.9% growth during the forecast period.
  • By Product - BSS segment was valued at USD 38.69 billion in 2024
  • By Deployment - Cloud-based segment accounted for the largest market revenue share in 2024

Market Size & Forecast

  • Market Opportunities: USD 144.52 billion
  • Market Future Opportunities: USD 104.40 billion
  • CAGR from 2025 to 2030 : 16.9%

Market Summary

  • The Operations Support Business Support Software Market operates as the critical digital infrastructure layer enabling telecommunications operators and digital service providers to automate network administration and subscriber billing. As operators deploy dense multi-node environments, the strategic necessity to monetize standalone wireless frameworks serves as a primary expansion driver, forcing network managers to replace static billing engines with agile revenue platforms.
  • Consequently, telecom operators deploying closed loop automation modules have successfully reduced routine network provisioning times by 80%, demonstrating massive operational efficiency gains. In real-world enterprise supply chains, automated service fulfillment ensures that autonomous logistics facilities maintain uninterrupted connectivity for robotic fleets.
  • However, entrenched legacy software systems and unindexed telemetry logs present severe operational challenges, often causing data synchronization errors during system migrations. The architectural transition toward standardized open application programming interfaces allows tech companies to integrate partner services seamlessly.
  • Ultimately, overcoming isolated operational data silos remains essential for organizations striving to implement fully zero touch network provisioning without disrupting active subscriber service agreements.

What will be the Size of the Operations Support Business Support Software Market during the forecast period?
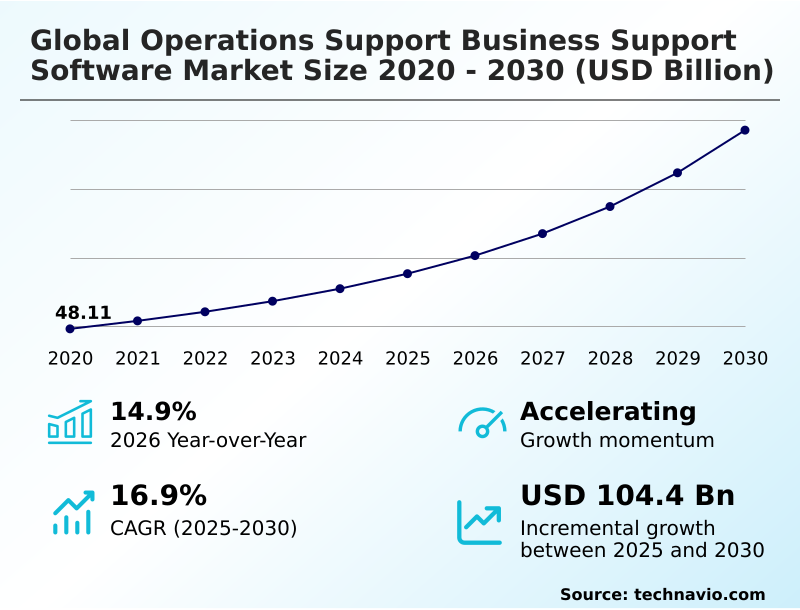
Get Key Insights on Market Forecast (PDF) Get Free Sample

How is the Operations Support Business Support Software Market Segmented?

The operations support business support software industry research report provides comprehensive data (region-wise segment analysis), with forecasts and estimates in "USD million" for the period 2026-2030, as well as historical data from 2020-2024 for the following segments.

  • Product
    • BSS
    • OSS
  • Deployment
    • Cloud-based
    • On-premises
  • Solution
    • Billing and revenue management
    • Customer and product management
    • Service assurance
    • Service fulfillment
    • Others
  • Sector
    • Large enterprises
    • SMEs
  • Geography
    • North America
      • US
      • Canada
      • Mexico
    • Europe
      • Germany
      • UK
      • France
      • Italy
      • Spain
      • The Netherlands
    • APAC
      • China
      • Japan
      • India
      • South Korea
      • Australia
      • Indonesia
    • South America
      • Brazil
      • Argentina
      • Chile
    • Middle East and Africa
      • Saudi Arabia
      • UAE
      • South Africa
      • Israel
      • Turkey

By Product Insights

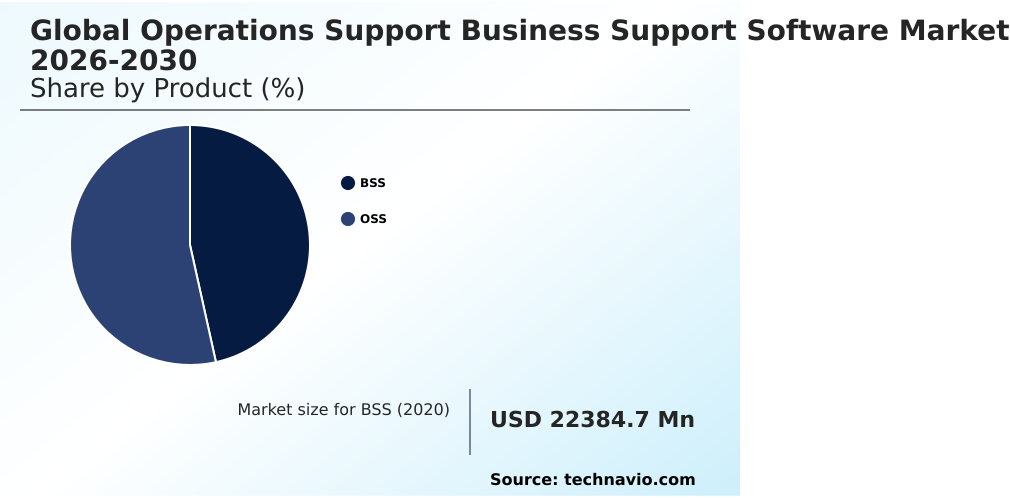
The bss segment is estimated to witness significant growth during the forecast period.

The business support software segment functions as the foundational commercial layer for telecommunications providers, facilitating advanced digital service monetization. By transitioning to cloud native microservices architectures, operators execute real time revenue management and automate billing workflows across complex partner ecosystems.

Upgrading to modern platforms allows network administrators to implement intent based pricing without manual intervention. Integrating agentic artificial intelligence orchestration into digital customer care frameworks has improved predictive customer churn analytics accuracy by 22%, significantly lowering subscriber acquisition costs.

These sophisticated software systems enable service providers to enforce precise rating policies dynamically, ensuring seamless billing cycles and preventing revenue leakage across high-volume digital enterprise transactions.
Get Free Sample

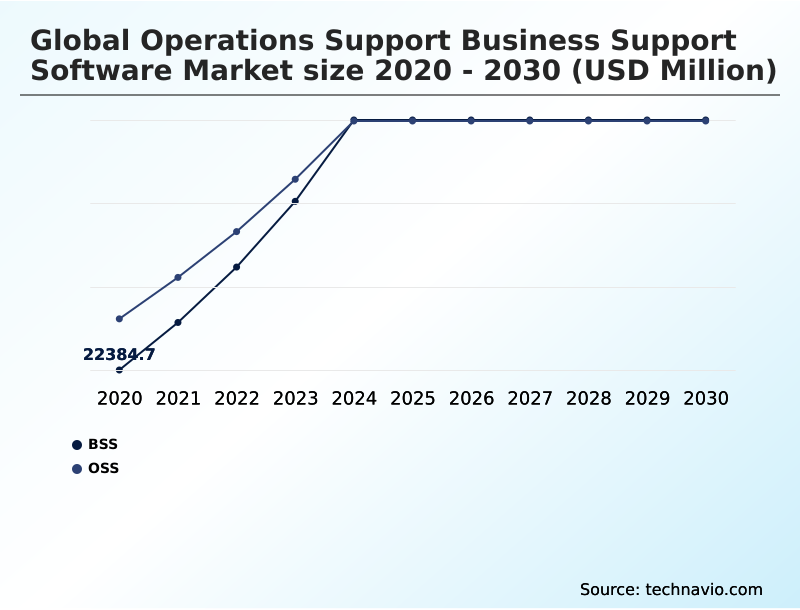
The BSS segment was valued at USD 38.69 billion in 2024 and showed a gradual increase during the forecast period.
Get Free Sample

Regional Analysis

APAC is estimated to contribute 28.9% to the growth of the global market during the forecast period.Technavio’s analysts have elaborately explained the regional trends and drivers that shape the market during the forecast period.
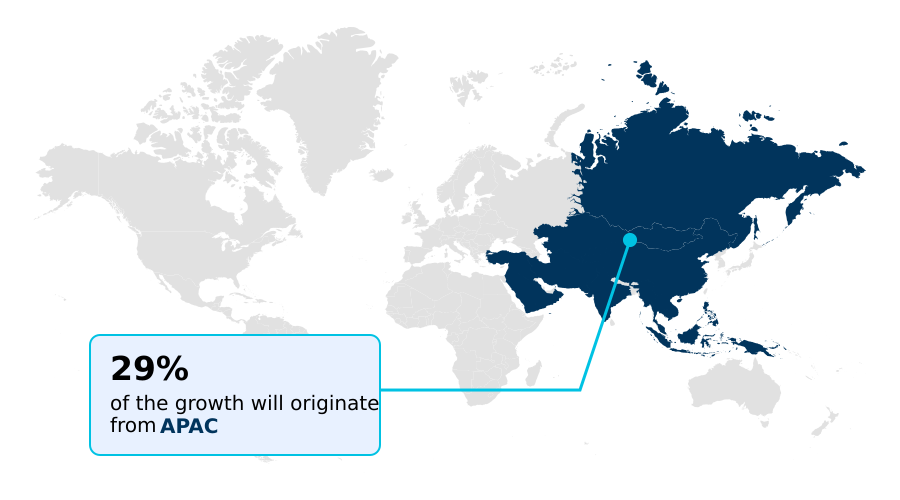
See How Operations Support Business Support Software Market Demand is Rising in APAC Get Free Sample

The geographic adoption landscape for operations software reveals distinct maturity levels between established and emerging digital economies.

North America demonstrates robust adoption of multi access edge computing, where major telecommunications carriers have improved network latency management efficiency by 25% through localized data processing.

Conversely, the APAC territory exhibits a 15% higher year-over-year adoption rate for cloud native revenue management platforms, driven by explosive mobile subscriber growth and extensive fiber optic deployments.

In APAC, operators utilizing dynamic network slicing have reduced enterprise service activation times by over 40%, optimizing supply chain connectivity for regional manufacturers.

While European organizations heavily prioritize compliance-driven fraud management mechanisms to protect cross-border data privacy, North American enterprises focus aggressively on integrating machine learning fault prediction to minimize infrastructure downtime.

These regional strategies highlight how localized regulatory frameworks dictate the deployment speed of serverless compute frameworks globally.

Market Dynamics

Our researchers analyzed the data with 2025 as the base year, along with the key drivers, trends, and challenges. A holistic analysis of drivers will help companies refine their marketing strategies to gain a competitive advantage.

  • The structural evolution of enterprise communications requires continuous investment in agile management systems to support massive digital workloads and hyper-connected supply chains. As organizations transition away from static hardware allocations, the monetization of private 5G networks has become a central priority, enabling telecom operators to offer dedicated, high-bandwidth connections directly to industrial manufacturing facilities.
  • Managing these sophisticated networks demands robust cloud native revenue management platforms capable of processing thousands of dynamic micro-transactions per second, ensuring accurate billing without human intervention. In complex multi-partner environments, establishing autonomous multi party digital ecosystem partnerships is critical for distributing digital services seamlessly, allowing telecommunications providers to bundle third-party cybersecurity and cloud storage applications directly into unified enterprise invoices.
  • When comparing operational efficiency, networks utilizing automated diagnostic software resolve connectivity bottlenecks approximately 45% faster than legacy systems relying on manual technician dispatches. This massive reduction in downtime ensures that autonomous warehouse fleets maintain uninterrupted data synchronization.
  • Furthermore, the integration of predictive customer care software platforms enables service providers to anticipate subscriber issues before they trigger service desk calls, drastically lowering inbound support ticketing volumes. To prevent provisioning failures during peak utilization, operations software now relies on real time physical resource constraints identification, mapping available bandwidth against guaranteed service level agreements automatically.
  • By modernizing these internal administrative layers, communications companies successfully transition from basic utility providers to agile technology facilitators capable of driving substantial long-term enterprise value.
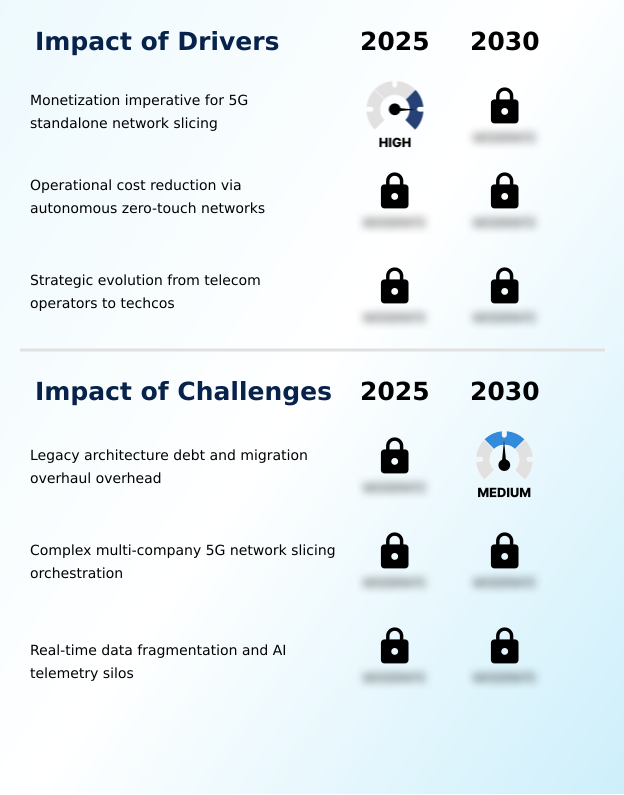
What are the key market drivers leading to the rise in the adoption of Operations Support Business Support Software Industry?

  • The strategic imperative to monetize 5G standalone network slicing serves as a primary catalyst driving widespread demand for advanced operational and business software platforms.

  • The commercial necessity to generate high-margin enterprise revenue from massive 5G infrastructure investments is accelerating the adoption of sophisticated operational software.
  • As operators transition into comprehensive digital service providers, they require advanced platforms capable of executing multi attribute rating across complex IoT services.
  • By automating routine network configurations, companies leveraging self healing corrective actions have decreased field technician dispatches by over 60%, drastically cutting manual labor overhead.
  • Furthermore, the integration of programmable network capabilities allows business systems to adjust bandwidth allocations dynamically based on client demand. This operational agility empowers service providers to enforce guaranteed latency thresholds flawlessly, elevating enterprise subscriber satisfaction scores by 20%.
  • Deploying intent driven operations ultimately enables operators to convert raw connectivity into highly tailored, premium enterprise solutions.

What are the market trends shaping the Operations Support Business Support Software Industry?

  • The integration of agentic artificial intelligence and autonomous decision fabrics is emerging as a definitive trend within the industry. This technological advancement enables operators to automate complex operational workflows and enhance real-time network orchestration capabilities.

  • The widespread architectural shift toward open digital architecture is radically transforming how service providers integrate third-party applications into core billing environments. Driven by the necessity to eliminate vendor lock-in, telecom operators are aggressively standardizing their software components.
  • This modular approach allows organizations utilizing standardized open application programming interfaces to reduce system integration costs by up to 40% when launching collaborative digital marketplaces. Consequently, network engineers can deploy virtualized radio access networks dynamically, improving spectral resource allocation efficiency by 25% across high-density urban zones.
  • The migration from monolithic installations to agile containerized microservices enables continuous software delivery pipelines that update billing logic without system downtime. By implementing intelligent cross domain orchestration, operators successfully manage complex 5G network slices spanning multiple vendor hardware domains, ensuring that enterprise clients receive guaranteed service levels for mission critical industrial automation tasks.

What challenges does the Operations Support Business Support Software Industry face during its growth?

  • Substantial legacy architecture debt and the high overhead costs associated with extensive system migration overhauls present significant structural challenges to industry expansion.

  • The deeply entrenched legacy architecture debt associated with monolithic software infrastructure severely restricts the modernization of global telecommunications operations. Attempting to migrate complex billing logic exposes operators to immense integration friction, frequently extending deployment timelines by up to 35%.
  • Because traditional networks trap performance metrics inside isolated operational data silos, intelligent software agents lack the contextual visibility required for accurate network healing. Furthermore, the presence of unindexed telemetry logs prevents predictive analytics engines from identifying signal degradation efficiently.
  • Without unified zero copy data architectures, automated provisioning attempts across network function virtualization deployments often result in resource allocation errors, elevating order fallout rates by 15%. Resolving these data fragmentation bottlenecks demands massive engineering investments, significantly delaying the commercial launch of mission critical enterprise applications.

Exclusive Technavio Analysis on Customer Landscape

The operations support business support software market forecasting report includes the adoption lifecycle of the market, covering from the innovator’s stage to the laggard’s stage. It focuses on adoption rates in different regions based on penetration. Furthermore, the operations support business support software market report also includes key purchase criteria and drivers of price sensitivity to help companies evaluate and develop their market growth analysis strategies.
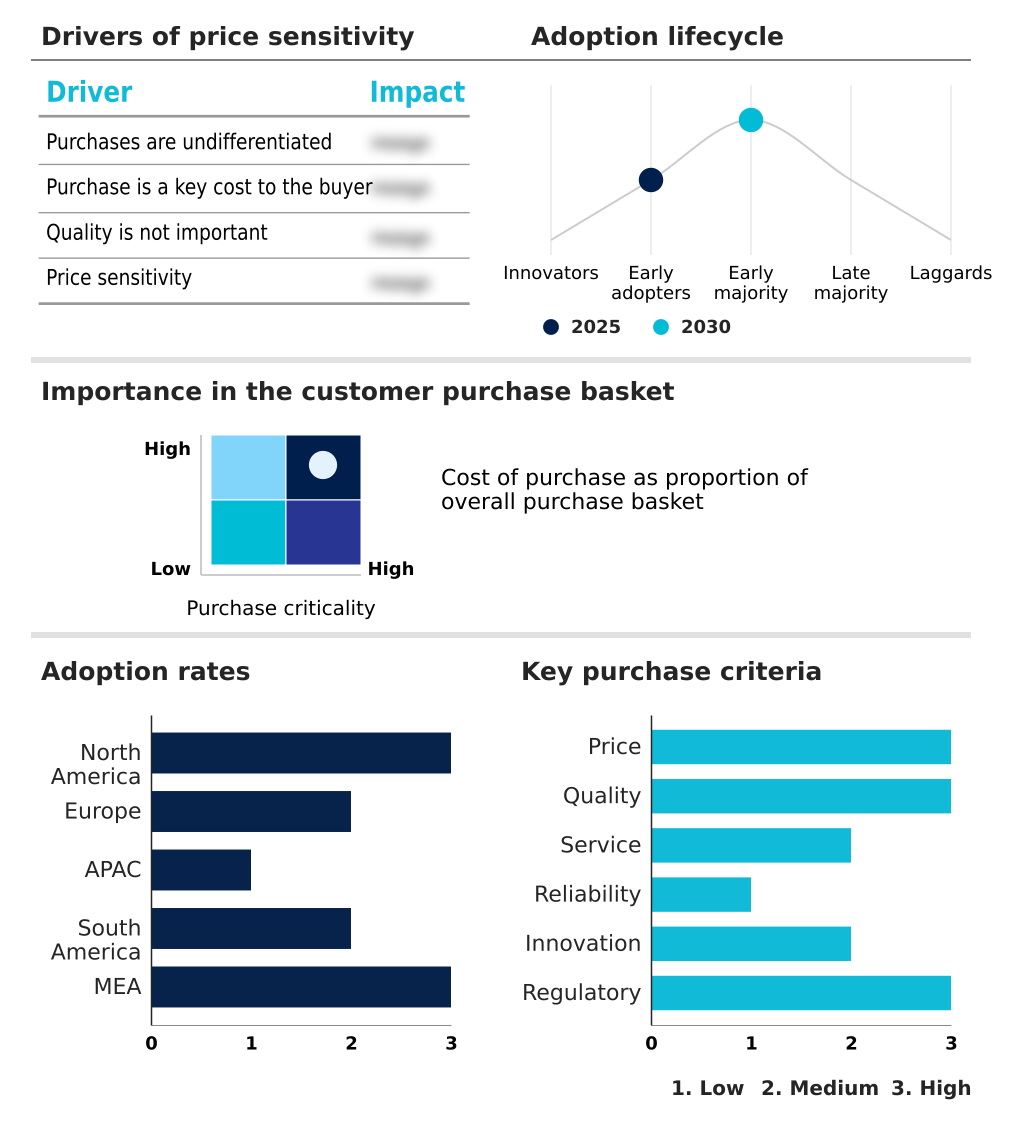
Customer Landscape of Operations Support Business Support Software Industry

Competitive Landscape

Companies are implementing various strategies, such as strategic alliances, operations support business support software market forecast, partnerships, mergers and acquisitions, geographical expansion, and product/service launches, to enhance their presence in the industry.

Accenture Plc - The vendor provides comprehensive operational and business software platforms, including intelligent networking suites and centralized digital catalogs, designed to streamline customer care and automate telecommunications billing operations.

The industry research and growth report includes detailed analyses of the competitive landscape of the market and information about key companies, including:

  • Accenture Plc
  • Alepo Technologies Inc.
  • Amdocs Ltd.
  • BearingPoint Holding BV
  • Cerillion Plc
  • Cisco Systems Inc.
  • Comarch SA
  • CSG Systems International Inc.
  • Hewlett Packard Enterprise Co.
  • Huawei Technologies Co. Ltd.
  • IBM Corp.
  • Infosys Ltd.
  • NEC Corp.
  • NetCracker Technology Corp.
  • Nokia Corp.
  • Optiva Inc.
  • Oracle Corp.
  • Tecnotree Corp.
  • Telefonaktiebolaget Ericsson
  • Wipro Ltd.

Qualitative and quantitative analysis of companies has been conducted to help clients understand the wider business environment as well as the strengths and weaknesses of key industry players. Data is qualitatively analyzed to categorize companies as pure play, category-focused, industry-focused, and diversified; it is quantitatively analyzed to categorize companies as dominant, leading, strong, tentative, and weak.

Recent Development and News in Operations support business support software market

  • In the Communications Equipment industry, the rapid expansion of disaggregated telecommunications networks has drastically increased data telemetry volumes, directly impacting Operations Support Business Support Software demand by requiring advanced root cause analysis automation to maintain 99.9% uptime.
  • The widespread commercial integration of software defined wide area networks across enterprise campuses has shifted traffic routing paradigms, driving the need for Operations Support Business Support Software that can dynamically manage guaranteed latency thresholds and execute end to end service orchestration across distributed nodes.
  • Stringent data sovereignty mandates governing digital value creation and cross-border data transfers have restricted public cloud usage, compelling operators to adopt localized Operations Support Business Support Software equipped with zero copy data architectures to ensure 100% compliance while mitigating legacy architecture debt.
  • The standardization of open network interfaces has accelerated the adoption of software defined networking components, expanding the deployment of Operations Support Business Support Software that utilize real time event streaming to optimize hardware utilization rates by over 30% across virtualized environments.

Dive into Technavio’s robust research methodology, blending expert interviews, extensive data synthesis, and validated models for unparalleled Operations Support Business Support Software Market insights. See full methodology.

Market Scope
Page number 318
Base year 2025
Historic period 2020-2024
Forecast period 2026-2030
Growth momentum & CAGR Accelerate at a CAGR of 16.9%
Market growth 2026-2030 USD 104401.0 million
Market structure Fragmented
YoY growth 2025-2026(%) 14.9%
Key countries US, Canada, Mexico, Germany, UK, France, Italy, Spain, The Netherlands, China, Japan, India, South Korea, Australia, Indonesia, Brazil, Argentina, Chile, Saudi Arabia, UAE, South Africa, Israel and Turkey
Competitive landscape Leading Companies, Market Positioning of Companies, Competitive Strategies, and Industry Risks

Request Free Sample

Research Analyst Overview

  • The rapid proliferation of hybrid cloud environments is fundamentally restructuring how telecommunications operators orchestrate complex digital services. Chief Information Officers are aggressively prioritizing the deployment of intent based orchestration to streamline massive network inventories and align technical provisioning directly with commercial product catalogs.
  • By replacing fragmented legacy databases with unified network inventory synchronization systems, organizations have achieved a 30% reduction in order fallout rates, directly accelerating revenue recognition for newly activated enterprise accounts. This operational modernization ensures that automated service fulfillment processes execute flawlessly across disparate physical and virtual domains without manual engineering intervention.
  • The transition toward autonomous fault management is allowing network administrators to pinpoint and resolve degraded signal paths before enterprise clients experience connectivity loss. To support these autonomous decision fabrics, operators are implementing resilient telemetry data pipelines that continuously feed clean performance metrics into centralized analytics engines. These advanced platforms empower executives to launch flexible, usage-based B2B connectivity products rapidly.
  • Ultimately, the successful deployment of omnichannel customer experiences relies entirely upon a flexible, highly automated operational software foundation capable of scaling intelligently alongside unpredictable commercial demand.

What are the Key Data Covered in this Operations Support Business Support Software Market Research and Growth Report?

  • What is the expected growth of the Operations Support Business Support Software Market between 2026 and 2030?

    • USD 104.40 billion, at a CAGR of 16.9%

  • What segmentation does the market report cover?

    • The report is segmented by Product (BSS, and OSS), Deployment (Cloud-based, and On-premises), Solution (Billing and revenue management, Customer and product management, Service assurance, Service fulfillment, and Others), Sector (Large enterprises, and SMEs) and Geography (North America, Europe, APAC, South America, Middle East and Africa)

  • Which regions are analyzed in the report?

    • North America, Europe, APAC, South America and Middle East and Africa

  • What are the key growth drivers and market challenges?

    • Monetization imperative for 5G standalone network slicing, Legacy architecture debt and migration overhaul overhead

  • Who are the major players in the Operations Support Business Support Software Market?

    • Accenture Plc, Alepo Technologies Inc., Amdocs Ltd., BearingPoint Holding BV, Cerillion Plc, Cisco Systems Inc., Comarch SA, CSG Systems International Inc., Hewlett Packard Enterprise Co., Huawei Technologies Co. Ltd., IBM Corp., Infosys Ltd., NEC Corp., NetCracker Technology Corp., Nokia Corp., Optiva Inc., Oracle Corp., Tecnotree Corp., Telefonaktiebolaget Ericsson and Wipro Ltd.

Market Research Insights

  • The Operations Support Business Support Software Market is experiencing accelerated technological transformation as digital enterprises demand highly autonomous infrastructure. Organizations implementing intent driven operations have improved hardware utilization by 35% compared to manual legacy configurations. Adopting zero copy data architectures has reduced database synchronization delays by 40%, directly lowering compliance reporting costs.
  • This shift enables network engineers to execute end to end service orchestration seamlessly across distributed environments. Consequently, operators utilizing predictive customer churn analytics have increased VIP subscriber retention rates by 18%, significantly boosting long-term profitability.
  • By addressing legacy architecture debt, communications service providers can deploy software defined wide area networks that dynamically align physical network resources with complex commercial billing policies.

We can help! Our analysts can customize this operations support business support software market research report to meet your requirements.

Get in touch

1. Executive Summary

1.1 Market overview

Executive Summary - Chart on Market Overview
Executive Summary - Data Table on Market Overview
Executive Summary - Chart on Global Market Characteristics
Executive Summary - Chart on Market by Geography
Executive Summary - Chart on Market Segmentation by Product
Executive Summary - Chart on Market Segmentation by Deployment
Executive Summary - Chart on Market Segmentation by Solution
Executive Summary - Chart on Market Segmentation by Sector
Executive Summary - Chart on Incremental Growth
Executive Summary - Data Table on Incremental Growth
Executive Summary - Chart on Company Market Positioning

2. Technavio Analysis

2.1 Analysis of price sensitivity, lifecycle, customer purchase basket, adoption rates, and purchase criteria

2.2 Criticality of inputs and Factors of differentiation

Chart on Overview on criticality of inputs and factors of differentiation

2.3 Factors of disruption

Chart on Overview on factors of disruption

2.4 Impact of drivers and challenges

Chart on Impact of drivers and challenges in 2025 and 2030

3. Market Landscape

3.1 Market ecosystem

Chart on Parent Market
Data Table on - Parent Market

3.2 Market characteristics

Chart on Market characteristics analysis

3.3 Value chain analysis

Chart on Value chain analysis

4. Market Sizing

4.1 Market definition

Data Table on Offerings of companies included in the market definition

4.2 Market segment analysis

Market segments

4.3 Market size 2025

4.4 Market outlook: Forecast for 2025-2030

Chart on Global - Market size and forecast 2025-2030 ($ million)
Data Table on Global - Market size and forecast 2025-2030 ($ million)
Chart on Global Market: Year-over-year growth 2025-2030 (%)
Data Table on Global Market: Year-over-year growth 2025-2030 (%)

5. Historic Market Size

5.1 Global Operations Support Business Support Software Market 2020 - 2024

Historic Market Size - Data Table on Global Operations Support Business Support Software Market 2020 - 2024 ($ million)

5.2 Product segment analysis 2020 - 2024

Historic Market Size - Product Segment 2020 - 2024 ($ million)

5.3 Deployment segment analysis 2020 - 2024

Historic Market Size - Deployment Segment 2020 - 2024 ($ million)

5.4 Solution segment analysis 2020 - 2024

Historic Market Size - Solution Segment 2020 - 2024 ($ million)

5.5 Sector segment analysis 2020 - 2024

Historic Market Size - Sector Segment 2020 - 2024 ($ million)

5.6 Geography segment analysis 2020 - 2024

Historic Market Size - Geography Segment 2020 - 2024 ($ million)

5.7 Country segment analysis 2020 - 2024

Historic Market Size - Country Segment 2020 - 2024 ($ million)

6. Qualitative Analysis

6.1 Impact of AI on global operations support business support software market

6.2 Impact of geopolitical conflicts on global operations support business support software market

7. Five Forces Analysis

7.1 Five forces summary

Five forces analysis - Comparison between 2025 and 2030

7.2 Bargaining power of buyers

Bargaining power of buyers - Impact of key factors 2025 and 2030

7.3 Bargaining power of suppliers

Bargaining power of suppliers - Impact of key factors in 2025 and 2030

7.4 Threat of new entrants

Threat of new entrants - Impact of key factors in 2025 and 2030

7.5 Threat of substitutes

Threat of substitutes - Impact of key factors in 2025 and 2030

7.6 Threat of rivalry

Threat of rivalry - Impact of key factors in 2025 and 2030

7.7 Market condition

Chart on Market condition - Five forces 2025 and 2030

8. Market Segmentation by Product

8.1 Market segments

Chart on Product - Market share 2025-2030 (%)
Data Table on Product - Market share 2025-2030 (%)

8.2 Comparison by Product

Chart on Comparison by Product
Data Table on Comparison by Product

8.3 BSS - Market size and forecast 2025-2030

Chart on BSS - Market size and forecast 2025-2030 ($ million)
Data Table on BSS - Market size and forecast 2025-2030 ($ million)
Chart on BSS - Year-over-year growth 2025-2030 (%)
Data Table on BSS - Year-over-year growth 2025-2030 (%)

8.4 OSS - Market size and forecast 2025-2030

Chart on OSS - Market size and forecast 2025-2030 ($ million)
Data Table on OSS - Market size and forecast 2025-2030 ($ million)
Chart on OSS - Year-over-year growth 2025-2030 (%)
Data Table on OSS - Year-over-year growth 2025-2030 (%)

8.5 Market opportunity by Product

Market opportunity by Product ($ million)
Data Table on Market opportunity by Product ($ million)

9. Market Segmentation by Deployment

9.1 Market segments

Chart on Deployment - Market share 2025-2030 (%)
Data Table on Deployment - Market share 2025-2030 (%)

9.2 Comparison by Deployment

Chart on Comparison by Deployment
Data Table on Comparison by Deployment

9.3 Cloud-based - Market size and forecast 2025-2030

Chart on Cloud-based - Market size and forecast 2025-2030 ($ million)
Data Table on Cloud-based - Market size and forecast 2025-2030 ($ million)
Chart on Cloud-based - Year-over-year growth 2025-2030 (%)
Data Table on Cloud-based - Year-over-year growth 2025-2030 (%)

9.4 On-premises - Market size and forecast 2025-2030

Chart on On-premises - Market size and forecast 2025-2030 ($ million)
Data Table on On-premises - Market size and forecast 2025-2030 ($ million)
Chart on On-premises - Year-over-year growth 2025-2030 (%)
Data Table on On-premises - Year-over-year growth 2025-2030 (%)

9.5 Market opportunity by Deployment

Market opportunity by Deployment ($ million)
Data Table on Market opportunity by Deployment ($ million)

10. Market Segmentation by Solution

10.1 Market segments

Chart on Solution - Market share 2025-2030 (%)
Data Table on Solution - Market share 2025-2030 (%)

10.2 Comparison by Solution

Chart on Comparison by Solution
Data Table on Comparison by Solution

10.3 Billing and revenue management - Market size and forecast 2025-2030

Chart on Billing and revenue management - Market size and forecast 2025-2030 ($ million)
Data Table on Billing and revenue management - Market size and forecast 2025-2030 ($ million)
Chart on Billing and revenue management - Year-over-year growth 2025-2030 (%)
Data Table on Billing and revenue management - Year-over-year growth 2025-2030 (%)

10.4 Customer and product management - Market size and forecast 2025-2030

Chart on Customer and product management - Market size and forecast 2025-2030 ($ million)
Data Table on Customer and product management - Market size and forecast 2025-2030 ($ million)
Chart on Customer and product management - Year-over-year growth 2025-2030 (%)
Data Table on Customer and product management - Year-over-year growth 2025-2030 (%)

10.5 Service assurance - Market size and forecast 2025-2030

Chart on Service assurance - Market size and forecast 2025-2030 ($ million)
Data Table on Service assurance - Market size and forecast 2025-2030 ($ million)
Chart on Service assurance - Year-over-year growth 2025-2030 (%)
Data Table on Service assurance - Year-over-year growth 2025-2030 (%)

10.6 Service fulfillment - Market size and forecast 2025-2030

Chart on Service fulfillment - Market size and forecast 2025-2030 ($ million)
Data Table on Service fulfillment - Market size and forecast 2025-2030 ($ million)
Chart on Service fulfillment - Year-over-year growth 2025-2030 (%)
Data Table on Service fulfillment - Year-over-year growth 2025-2030 (%)

10.7 Others - Market size and forecast 2025-2030

Chart on Others - Market size and forecast 2025-2030 ($ million)
Data Table on Others - Market size and forecast 2025-2030 ($ million)
Chart on Others - Year-over-year growth 2025-2030 (%)
Data Table on Others - Year-over-year growth 2025-2030 (%)

10.8 Market opportunity by Solution

Market opportunity by Solution ($ million)
Data Table on Market opportunity by Solution ($ million)

11. Market Segmentation by Sector

11.1 Market segments

Chart on Sector - Market share 2025-2030 (%)
Data Table on Sector - Market share 2025-2030 (%)

11.2 Comparison by Sector

Chart on Comparison by Sector
Data Table on Comparison by Sector

11.3 Large enterprises - Market size and forecast 2025-2030

Chart on Large enterprises - Market size and forecast 2025-2030 ($ million)
Data Table on Large enterprises - Market size and forecast 2025-2030 ($ million)
Chart on Large enterprises - Year-over-year growth 2025-2030 (%)
Data Table on Large enterprises - Year-over-year growth 2025-2030 (%)

11.4 SMEs - Market size and forecast 2025-2030

Chart on SMEs - Market size and forecast 2025-2030 ($ million)
Data Table on SMEs - Market size and forecast 2025-2030 ($ million)
Chart on SMEs - Year-over-year growth 2025-2030 (%)
Data Table on SMEs - Year-over-year growth 2025-2030 (%)

11.5 Market opportunity by Sector

Market opportunity by Sector ($ million)
Data Table on Market opportunity by Sector ($ million)

12. Customer Landscape

12.1 Customer landscape overview

Analysis of price sensitivity, lifecycle, customer purchase basket, adoption rates, and purchase criteria

13. Geographic Landscape

13.1 Geographic segmentation

Chart on Market share by geography 2025-2030 (%)
Data Table on Market share by geography 2025-2030 (%)

13.2 Geographic comparison

Chart on Geographic comparison
Data Table on Geographic comparison

13.3 North America - Market size and forecast 2025-2030

Chart on North America - Market size and forecast 2025-2030 ($ million)
Data Table on North America - Market size and forecast 2025-2030 ($ million)
Chart on North America - Year-over-year growth 2025-2030 (%)
Data Table on North America - Year-over-year growth 2025-2030 (%)
Chart on Regional Comparison - North America
Data Table on Regional Comparison - North America

13.3.1 US - Market size and forecast 2025-2030

Chart on US - Market size and forecast 2025-2030 ($ million)
Data Table on US - Market size and forecast 2025-2030 ($ million)
Chart on US - Year-over-year growth 2025-2030 (%)
Data Table on US - Year-over-year growth 2025-2030 (%)

13.3.2 Canada - Market size and forecast 2025-2030

Chart on Canada - Market size and forecast 2025-2030 ($ million)
Data Table on Canada - Market size and forecast 2025-2030 ($ million)
Chart on Canada - Year-over-year growth 2025-2030 (%)
Data Table on Canada - Year-over-year growth 2025-2030 (%)

13.3.3 Mexico - Market size and forecast 2025-2030

Chart on Mexico - Market size and forecast 2025-2030 ($ million)
Data Table on Mexico - Market size and forecast 2025-2030 ($ million)
Chart on Mexico - Year-over-year growth 2025-2030 (%)
Data Table on Mexico - Year-over-year growth 2025-2030 (%)

13.4 Europe - Market size and forecast 2025-2030

Chart on Europe - Market size and forecast 2025-2030 ($ million)
Data Table on Europe - Market size and forecast 2025-2030 ($ million)
Chart on Europe - Year-over-year growth 2025-2030 (%)
Data Table on Europe - Year-over-year growth 2025-2030 (%)
Chart on Regional Comparison - Europe
Data Table on Regional Comparison - Europe

13.4.1 Germany - Market size and forecast 2025-2030

Chart on Germany - Market size and forecast 2025-2030 ($ million)
Data Table on Germany - Market size and forecast 2025-2030 ($ million)
Chart on Germany - Year-over-year growth 2025-2030 (%)
Data Table on Germany - Year-over-year growth 2025-2030 (%)

13.4.2 UK - Market size and forecast 2025-2030

Chart on UK - Market size and forecast 2025-2030 ($ million)
Data Table on UK - Market size and forecast 2025-2030 ($ million)
Chart on UK - Year-over-year growth 2025-2030 (%)
Data Table on UK - Year-over-year growth 2025-2030 (%)

13.4.3 France - Market size and forecast 2025-2030

Chart on France - Market size and forecast 2025-2030 ($ million)
Data Table on France - Market size and forecast 2025-2030 ($ million)
Chart on France - Year-over-year growth 2025-2030 (%)
Data Table on France - Year-over-year growth 2025-2030 (%)

13.4.4 Italy - Market size and forecast 2025-2030

Chart on Italy - Market size and forecast 2025-2030 ($ million)
Data Table on Italy - Market size and forecast 2025-2030 ($ million)
Chart on Italy - Year-over-year growth 2025-2030 (%)
Data Table on Italy - Year-over-year growth 2025-2030 (%)

13.4.5 Spain - Market size and forecast 2025-2030

Chart on Spain - Market size and forecast 2025-2030 ($ million)
Data Table on Spain - Market size and forecast 2025-2030 ($ million)
Chart on Spain - Year-over-year growth 2025-2030 (%)
Data Table on Spain - Year-over-year growth 2025-2030 (%)

13.4.6 The Netherlands - Market size and forecast 2025-2030

Chart on The Netherlands - Market size and forecast 2025-2030 ($ million)
Data Table on The Netherlands - Market size and forecast 2025-2030 ($ million)
Chart on The Netherlands - Year-over-year growth 2025-2030 (%)
Data Table on The Netherlands - Year-over-year growth 2025-2030 (%)

13.5 APAC - Market size and forecast 2025-2030

Chart on APAC - Market size and forecast 2025-2030 ($ million)
Data Table on APAC - Market size and forecast 2025-2030 ($ million)
Chart on APAC - Year-over-year growth 2025-2030 (%)
Data Table on APAC - Year-over-year growth 2025-2030 (%)
Chart on Regional Comparison - APAC
Data Table on Regional Comparison - APAC

13.5.1 China - Market size and forecast 2025-2030

Chart on China - Market size and forecast 2025-2030 ($ million)
Data Table on China - Market size and forecast 2025-2030 ($ million)
Chart on China - Year-over-year growth 2025-2030 (%)
Data Table on China - Year-over-year growth 2025-2030 (%)

13.5.2 Japan - Market size and forecast 2025-2030

Chart on Japan - Market size and forecast 2025-2030 ($ million)
Data Table on Japan - Market size and forecast 2025-2030 ($ million)
Chart on Japan - Year-over-year growth 2025-2030 (%)
Data Table on Japan - Year-over-year growth 2025-2030 (%)

13.5.3 India - Market size and forecast 2025-2030

Chart on India - Market size and forecast 2025-2030 ($ million)
Data Table on India - Market size and forecast 2025-2030 ($ million)
Chart on India - Year-over-year growth 2025-2030 (%)
Data Table on India - Year-over-year growth 2025-2030 (%)

13.5.4 South Korea - Market size and forecast 2025-2030

Chart on South Korea - Market size and forecast 2025-2030 ($ million)
Data Table on South Korea - Market size and forecast 2025-2030 ($ million)
Chart on South Korea - Year-over-year growth 2025-2030 (%)
Data Table on South Korea - Year-over-year growth 2025-2030 (%)

13.5.5 Australia - Market size and forecast 2025-2030

Chart on Australia - Market size and forecast 2025-2030 ($ million)
Data Table on Australia - Market size and forecast 2025-2030 ($ million)
Chart on Australia - Year-over-year growth 2025-2030 (%)
Data Table on Australia - Year-over-year growth 2025-2030 (%)

13.5.6 Indonesia - Market size and forecast 2025-2030

Chart on Indonesia - Market size and forecast 2025-2030 ($ million)
Data Table on Indonesia - Market size and forecast 2025-2030 ($ million)
Chart on Indonesia - Year-over-year growth 2025-2030 (%)
Data Table on Indonesia - Year-over-year growth 2025-2030 (%)

13.6 South America - Market size and forecast 2025-2030

Chart on South America - Market size and forecast 2025-2030 ($ million)
Data Table on South America - Market size and forecast 2025-2030 ($ million)
Chart on South America - Year-over-year growth 2025-2030 (%)
Data Table on South America - Year-over-year growth 2025-2030 (%)
Chart on Regional Comparison - South America
Data Table on Regional Comparison - South America

13.6.1 Brazil - Market size and forecast 2025-2030

Chart on Brazil - Market size and forecast 2025-2030 ($ million)
Data Table on Brazil - Market size and forecast 2025-2030 ($ million)
Chart on Brazil - Year-over-year growth 2025-2030 (%)
Data Table on Brazil - Year-over-year growth 2025-2030 (%)

13.6.2 Argentina - Market size and forecast 2025-2030

Chart on Argentina - Market size and forecast 2025-2030 ($ million)
Data Table on Argentina - Market size and forecast 2025-2030 ($ million)
Chart on Argentina - Year-over-year growth 2025-2030 (%)
Data Table on Argentina - Year-over-year growth 2025-2030 (%)

13.6.3 Chile - Market size and forecast 2025-2030

Chart on Chile - Market size and forecast 2025-2030 ($ million)
Data Table on Chile - Market size and forecast 2025-2030 ($ million)
Chart on Chile - Year-over-year growth 2025-2030 (%)
Data Table on Chile - Year-over-year growth 2025-2030 (%)

13.7 Middle East and Africa - Market size and forecast 2025-2030

Chart on Middle East and Africa - Market size and forecast 2025-2030 ($ million)
Data Table on Middle East and Africa - Market size and forecast 2025-2030 ($ million)
Chart on Middle East and Africa - Year-over-year growth 2025-2030 (%)
Data Table on Middle East and Africa - Year-over-year growth 2025-2030 (%)
Chart on Regional Comparison - Middle East and Africa
Data Table on Regional Comparison - Middle East and Africa

13.7.1 Saudi Arabia - Market size and forecast 2025-2030

Chart on Saudi Arabia - Market size and forecast 2025-2030 ($ million)
Data Table on Saudi Arabia - Market size and forecast 2025-2030 ($ million)
Chart on Saudi Arabia - Year-over-year growth 2025-2030 (%)
Data Table on Saudi Arabia - Year-over-year growth 2025-2030 (%)

13.7.2 UAE - Market size and forecast 2025-2030

Chart on UAE - Market size and forecast 2025-2030 ($ million)
Data Table on UAE - Market size and forecast 2025-2030 ($ million)
Chart on UAE - Year-over-year growth 2025-2030 (%)
Data Table on UAE - Year-over-year growth 2025-2030 (%)

13.7.3 South Africa - Market size and forecast 2025-2030

Chart on South Africa - Market size and forecast 2025-2030 ($ million)
Data Table on South Africa - Market size and forecast 2025-2030 ($ million)
Chart on South Africa - Year-over-year growth 2025-2030 (%)
Data Table on South Africa - Year-over-year growth 2025-2030 (%)

13.7.4 Israel - Market size and forecast 2025-2030

Chart on Israel - Market size and forecast 2025-2030 ($ million)
Data Table on Israel - Market size and forecast 2025-2030 ($ million)
Chart on Israel - Year-over-year growth 2025-2030 (%)
Data Table on Israel - Year-over-year growth 2025-2030 (%)

13.7.5 Turkey - Market size and forecast 2025-2030

Chart on Turkey - Market size and forecast 2025-2030 ($ million)
Data Table on Turkey - Market size and forecast 2025-2030 ($ million)
Chart on Turkey - Year-over-year growth 2025-2030 (%)
Data Table on Turkey - Year-over-year growth 2025-2030 (%)

13.8 Market opportunity by geography

Market opportunity by geography ($ million)
Data Tables on Market opportunity by geography ($ million)

14. Drivers, Challenges, and Opportunity

14.1 Market drivers

Monetization imperative for 5G standalone network slicing
Operational cost reduction via autonomous zero-touch networks
Strategic evolution from telecom operators to techcos

14.2 Market challenges

Legacy architecture debt and migration overhaul overhead
Complex multi-company 5G network slicing orchestration
Real-time data fragmentation and AI telemetry silos

14.3 Impact of drivers and challenges

Impact of drivers and challenges in 2025 and 2030

14.4 Market opportunities

Deployment of agentic AI and autonomous decision fabrics
Adoption of TM forum open digital architecture and open APIs
Migration to cloud-native SaaS and multi-cloud architectures

15. Competitive Landscape

15.1 Overview

15.2

Overview on criticality of inputs and factors of differentiation

15.3 Landscape disruption

Overview on factors of disruption

15.4 Industry risks

Impact of key risks on business

16. Competitive Analysis

16.1 Companies profiled

Companies covered

16.2 Company ranking index

16.3 Market positioning of companies

Matrix on companies position and classification

16.4 Accenture Plc

Accenture Plc - Overview
Accenture Plc - Business segments
Accenture Plc - Key news
Accenture Plc - Key offerings
Accenture Plc - Segment focus
SWOT

16.5 Amdocs Ltd.

Amdocs Ltd. - Overview
Amdocs Ltd. - Product / Service
Amdocs Ltd. - Key news
Amdocs Ltd. - Key offerings
SWOT

16.6 BearingPoint Holding BV

BearingPoint Holding BV - Overview
BearingPoint Holding BV - Product / Service
BearingPoint Holding BV - Key offerings
SWOT

16.7 Cisco Systems Inc.

Cisco Systems Inc. - Overview
Cisco Systems Inc. - Business segments
Cisco Systems Inc. - Key news
Cisco Systems Inc. - Key offerings
Cisco Systems Inc. - Segment focus
SWOT

16.8 CSG Systems International Inc.

CSG Systems International Inc. - Overview
CSG Systems International Inc. - Product / Service
CSG Systems International Inc. - Key offerings
SWOT

16.9 Hewlett Packard Enterprise Co.

Hewlett Packard Enterprise Co. - Overview
Hewlett Packard Enterprise Co. - Business segments
Hewlett Packard Enterprise Co. - Key news
Hewlett Packard Enterprise Co. - Key offerings
Hewlett Packard Enterprise Co. - Segment focus
SWOT

16.10 Huawei Technologies Co. Ltd.

Huawei Technologies Co. Ltd. - Overview
Huawei Technologies Co. Ltd. - Product / Service
Huawei Technologies Co. Ltd. - Key offerings
SWOT

16.11 IBM Corp.

IBM Corp. - Overview
IBM Corp. - Business segments
IBM Corp. - Key news
IBM Corp. - Key offerings
IBM Corp. - Segment focus
SWOT

16.12 Infosys Ltd.

Infosys Ltd. - Overview
Infosys Ltd. - Business segments
Infosys Ltd. - Key news
Infosys Ltd. - Key offerings
Infosys Ltd. - Segment focus
SWOT

16.13 NEC Corp.

NEC Corp. - Overview
NEC Corp. - Business segments
NEC Corp. - Key offerings
NEC Corp. - Segment focus
SWOT

16.14 NetCracker Technology Corp.

NetCracker Technology Corp. - Overview
NetCracker Technology Corp. - Product / Service
NetCracker Technology Corp. - Key offerings
SWOT

16.15 Nokia Corp.

Nokia Corp. - Overview
Nokia Corp. - Business segments
Nokia Corp. - Key news
Nokia Corp. - Key offerings
Nokia Corp. - Segment focus
SWOT

16.16 Oracle Corp.

Oracle Corp. - Overview
Oracle Corp. - Business segments
Oracle Corp. - Key news
Oracle Corp. - Key offerings
Oracle Corp. - Segment focus
SWOT

16.17 Telefonaktiebolaget Ericsson

Telefonaktiebolaget Ericsson - Overview
Telefonaktiebolaget Ericsson - Business segments
Telefonaktiebolaget Ericsson - Key news
Telefonaktiebolaget Ericsson - Key offerings
Telefonaktiebolaget Ericsson - Segment focus
SWOT

16.18 Wipro Ltd.

Wipro Ltd. - Overview
Wipro Ltd. - Business segments
Wipro Ltd. - Key news
Wipro Ltd. - Key offerings
Wipro Ltd. - Segment focus
SWOT

17. Appendix

17.1 Scope of the report

Market definition
Objectives
Notes and caveats

17.2 Inclusions and exclusions checklist

Inclusions checklist
Exclusions checklist

17.3 Currency conversion rates for US$

17.4 Research methodology

17.5 Data procurement

Information sources

17.6 Data validation

17.7 Validation techniques employed for market sizing

17.8 Data synthesis

17.9 360 degree market analysis

17.10 List of abbreviations

Research Methodology

Technavio presents a detailed picture of the market by way of study, synthesis, and summation of data from multiple sources. The analysts have presented the various facets of the market with a particular focus on identifying the key industry influencers. The data thus presented is comprehensive, reliable, and the result of extensive research, both primary and secondary.

INFORMATION SOURCES

Primary sources

  • Manufacturers and suppliers
  • Channel partners
  • Industry experts
  • Strategic decision makers

Secondary sources

  • Industry journals and periodicals
  • Government data
  • Financial reports of key industry players
  • Historical data
  • Press releases

DATA ANALYSIS

Data Synthesis

  • Collation of data
  • Estimation of key figures
  • Analysis of derived insights

Data Validation

  • Triangulation with data models
  • Reference against proprietary databases
  • Corroboration with industry experts

REPORT WRITING

Qualitative

  • Market drivers
  • Market challenges
  • Market trends
  • Five forces analysis

Quantitative

  • Market size and forecast
  • Market segmentation
  • Geographical insights
  • Competitive landscape

Interested in this report?

Get your sample now to see our research methodology and insights!

Download Now

Frequently Asked Questions

Operations Support Business Support Software market growth will increase by USD 104401.0 million during 2026-2030.

The Operations Support Business Support Software market is expected to grow at a CAGR of 16.9% during 2026-2030.

Operations Support Business Support Software market is segmented by Product (BSS, OSS) Deployment (Cloud-based, On-premises) Solution (Billing and revenue management, Customer and product management, Service assurance, Service fulfillment, Others) Sector (Large enterprises, SMEs)

Accenture Plc, Alepo Technologies Inc., Amdocs Ltd., BearingPoint Holding BV, Cerillion Plc, Cisco Systems Inc., Comarch SA, CSG Systems International Inc., Hewlett Packard Enterprise Co., Huawei Technologies Co. Ltd., IBM Corp., Infosys Ltd., NEC Corp., NetCracker Technology Corp., Nokia Corp., Optiva Inc., Oracle Corp., Tecnotree Corp., Telefonaktiebolaget Ericsson, Wipro Ltd. are a few of the key vendors in the Operations Support Business Support Software market.

APAC will register the highest growth rate of 28.9% among the other regions. Therefore, the Operations Support Business Support Software market in APAC is expected to garner significant business opportunities for the vendors during the forecast period.

US, Canada, Mexico, Germany, UK, France, Italy, Spain, The Netherlands, China, Japan, India, South Korea, Australia, Indonesia, Brazil, Argentina, Chile, Saudi Arabia, UAE, South Africa, Israel, Turkey

  • Monetization imperative for 5G standalone network slicing is the driving factor this market.

The Operations Support Business Support Software market vendors should focus on grabbing business opportunities from the Product segment as it accounted for the largest market share in the base year.
RIA - Research AI Assistant
Ask RIA
