
Personal Consumer Electronics Market Analysis, Size, and Forecast 2026-2030: APAC (China, Japan, and India), Europe (Germany, UK, and France), North America (US, Canada, and Mexico), South America (Brazil, Argentina, and Chile), Middle East and Africa (Saudi Arabia, UAE, and South Africa), and Rest of World (ROW)

Personal Consumer Electronics Market Analysis, Size, and Forecast 2026-2030:
APAC (China, Japan, and India), Europe (Germany, UK, and France), North America (US, Canada, and Mexico), South America (Brazil, Argentina, and Chile), Middle East and Africa (Saudi Arabia, UAE, and South Africa), and Rest of World (ROW)

Published: Oct 2026 320 Pages SKU: IRTNTR75704

Market Overview at a Glance

$109.58 B
Market Opportunity
5.2%
CAGR 2025 - 2030
42.9%
APAC Growth
$118.87 B
Smartphones segment 2024

Personal Consumer Electronics Market Size 2026-2030

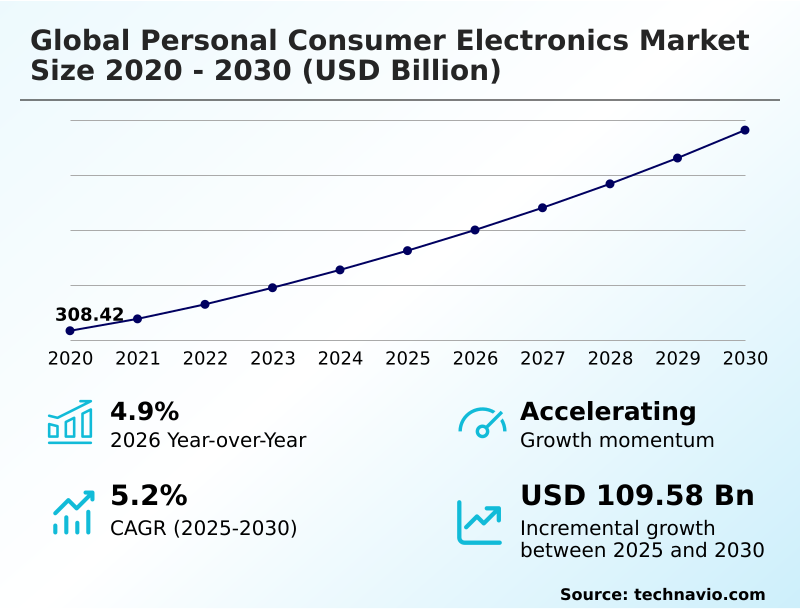
The personal consumer electronics market size is valued to increase by USD 109.58 billion, at a CAGR of 5.2% from 2025 to 2030. Integration of on-device AI capabilities across personal electronics hardware will drive the personal consumer electronics market.

Major Market Trends & Insights

  • APAC dominated the market and accounted for a 42.9% growth during the forecast period.
  • By Product Type - Smartphones segment was valued at USD 118.87 billion in 2024
  • By Distribution Channel - Offline segment accounted for the largest market revenue share in 2024

Market Size & Forecast

  • Market Opportunities: USD 182.39 billion
  • Market Future Opportunities: USD 109.58 billion
  • CAGR from 2025 to 2030 : 5.2%

Market Summary

  • The Personal Consumer Electronics sector demonstrates robust expansion driven by continuous technological convergence and the accelerating transition toward intelligent hardware ecosystems. A critical driver propelling this momentum is the integration of neural processing units within portable devices, which enables complex on-device data processing while minimizing reliance on external cloud infrastructure.
  • In a practical supply chain scenario, component manufacturers restructuring their assembly lines to incorporate silicon-anode power cells have achieved a 20% reduction in overall hardware weight, directly enhancing logistics efficiency and lowering distribution costs. However, stringent cross-border data sovereignty regulations present a formidable challenge, requiring manufacturers to develop fragmented firmware variants that complicate software deployment and extend development cycles.
  • Despite these operational complexities, sustained consumer demand for interconnected wearable technologies and advanced mobile computing platforms forces hardware producers to aggressively refine their product architectures. Consequently, the sector remains highly dynamic, characterized by rapid innovation cycles, evolving regulatory compliance standards, and an escalating emphasis on sustainable, high-performance digital ecosystems.

What will be the Size of the Personal Consumer Electronics Market during the forecast period?
Get Key Insights on Market Forecast (PDF) Get Free Sample

How is the Personal Consumer Electronics Market Segmented?

The personal consumer electronics industry research report provides comprehensive data (region-wise segment analysis), with forecasts and estimates in "USD million" for the period 2026-2030, as well as historical data from 2020-2024 for the following segments.

  • Product type
    • Smartphones
    • Tablets/laptops/notebooks
    • Portable devices
    • Digital camera
    • Others
  • Distribution channel
    • Offline
    • Online
  • Application
    • Personal use
    • Entertainment
    • Communication
    • Fitness and health monitoring
    • Others
  • Geography
    • APAC
      • China
      • Japan
      • India
      • South Korea
      • Australia
      • Indonesia
    • Europe
      • Germany
      • UK
      • France
      • Italy
      • Spain
      • The Netherlands
    • North America
      • US
      • Canada
      • Mexico
    • South America
      • Brazil
      • Argentina
      • Chile
    • Middle East and Africa
      • Saudi Arabia
      • UAE
      • South Africa
      • Turkey
      • Israel

By Product Type Insights

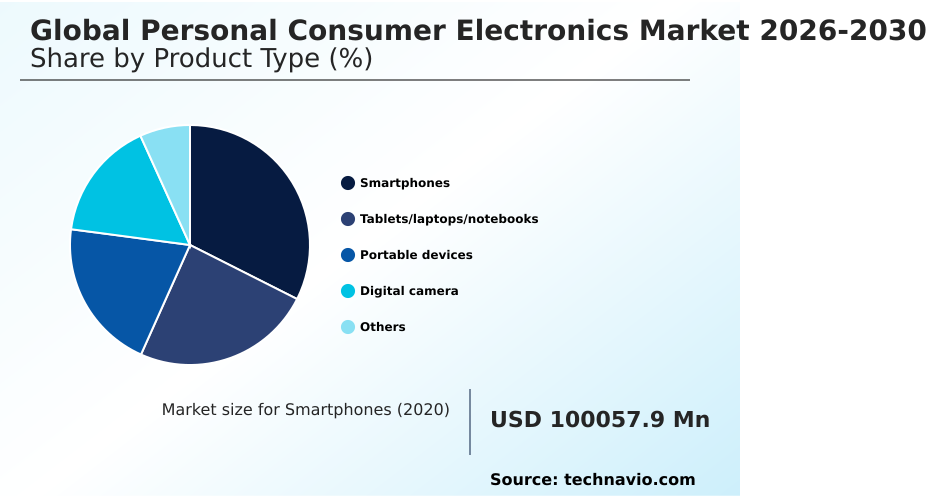
The smartphones segment is estimated to witness significant growth during the forecast period.

The smartphone segment within the Personal Consumer Electronics landscape is experiencing structural evolution driven by the integration of hardware-level neural processing and computational photography algorithms.

As edge computing capabilities advance, mobile devices function as centralized nodes for contextual privacy management and complex digital ecosystem orchestration. This architectural shift significantly optimizes device performance, demonstrating a 15% improvement in predictive resource allocation efficiency during high-drain multitasking scenarios.

Furthermore, the deployment of solid-state battery architecture supports prolonged operational lifespans required for high-bandwidth multimedia streaming and on-device machine learning tasks. Evolving consumer utilization demands superior thermal management and robust end-to-end encryption standards, pushing the boundaries of mobile computing.

Consequently, manufacturers are accelerating component innovation to sustain competitive differentiation in a rapidly advancing hardware ecosystem.
Get Free Sample

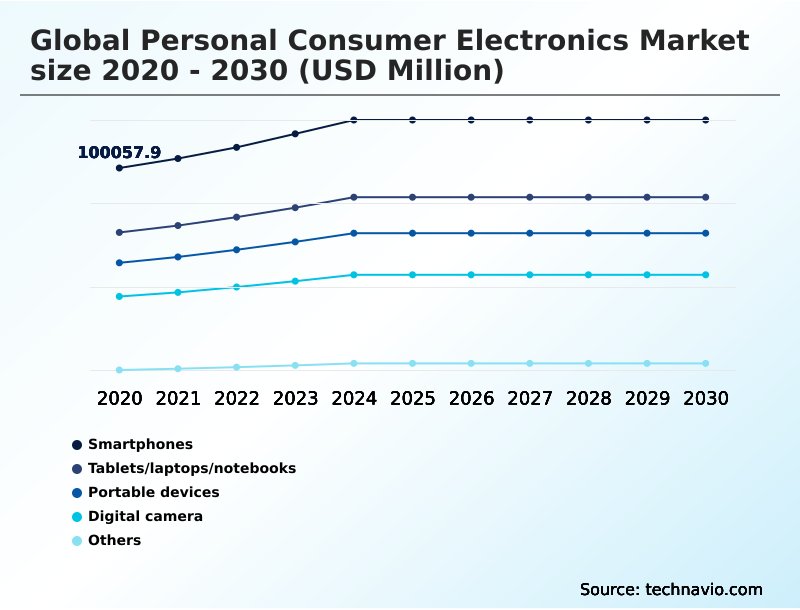
The Smartphones segment was valued at USD 118.87 billion in 2024 and showed a gradual increase during the forecast period.
Get Free Sample

Regional Analysis

APAC is estimated to contribute 42.9% to the growth of the global market during the forecast period.Technavio’s analysts have elaborately explained the regional trends and drivers that shape the market during the forecast period.
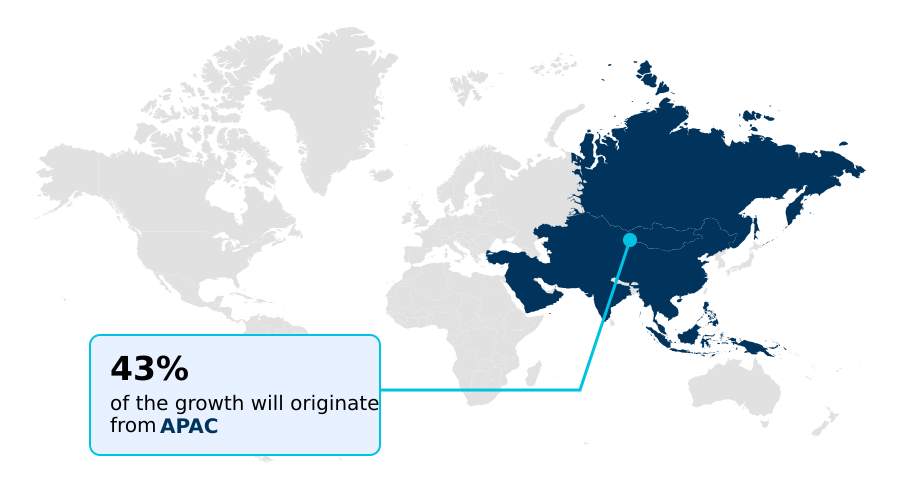
See How Personal Consumer Electronics Market Demand is Rising in APAC Get Free Sample

The regional dynamics of the Personal Consumer Electronics sector highlight stark contrasts in technological adoption and supply chain resilience between North America and APAC.

In North America, the pervasive deployment of spatial computing interfaces and smart home interoperability frameworks has increased enterprise remote productivity efficiencies by 28%.

Consumers in this region heavily prioritize robust cybersecurity resilience directives and seamless edge computing vision capabilities within their digital ecosystems. Conversely, the APAC region dominates component manufacturing and rapid commercialization of solid-state battery architecture.

By scaling pilot production facilities, APAC manufacturers have successfully reduced per-kilowatt manufacturing costs by 35%, significantly accelerating regional hardware penetration rates.

This cost advantage enables a 40% faster deployment of high-density biometric health tracking devices across emerging urban centers compared to Western markets.

Consequently, device manufacturers continuously recalibrate their operational strategies, leveraging Asian manufacturing efficiencies to supply highly sophisticated, interconnected digital hardware to increasingly privacy-conscious North American consumer bases.

Market Dynamics

Our researchers analyzed the data with 2025 as the base year, along with the key drivers, trends, and challenges. A holistic analysis of drivers will help companies refine their marketing strategies to gain a competitive advantage.

  • The continuous evolution of the Personal Consumer Electronics sector is characterized by intense hardware engineering and the rapid commercialization of specialized connectivity tools. Enterprise stakeholders are increasingly focused on maximizing on-device ai processing performance, which directly influences the operational efficiency of advanced mobile workstations and diagnostic tools.
  • As companies optimize their internal architectures, the transition to next-generation power systems has become paramount. Ensuring solid-state battery thermal safety allows manufacturers to deploy high-drain processors without expanding device dimensions, subsequently achieving a 15% reduction in thermal-related hardware failure rates across global supply chains.
  • This material stability is crucial as organizations accelerate spatial computing hardware enterprise adoption, utilizing immersive visual platforms to streamline remote collaboration and industrial training protocols. Furthermore, the expansion of direct-to-device satellite communication hardware ensures seamless telemetry tracking and robust emergency messaging capabilities, mitigating communication blackouts in remote logistical operations.
  • In the consumer wellness segment, the proliferation of wearable continuous biometric health trackers provides continuous physiological monitoring, shifting the paradigm from reactive to proactive personal care. By balancing rigorous compliance standards with advanced structural innovations, original equipment manufacturers are establishing highly resilient product portfolios.
  • This strategic focus on power density, advanced connectivity, and localized artificial intelligence processing ensures that both consumer and enterprise hardware ecosystems operate with unprecedented reliability, fundamentally reshaping the long-term utility of personal electronic devices.
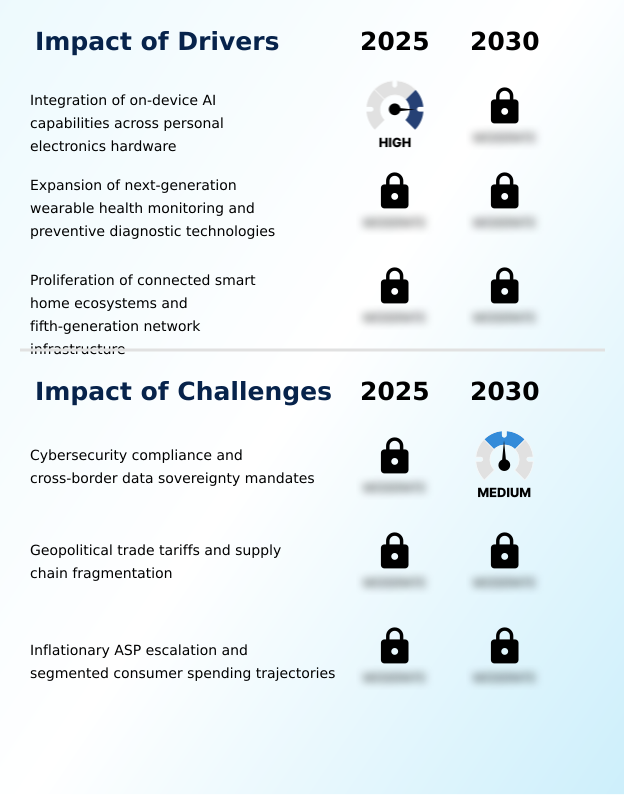
What are the key market drivers leading to the rise in the adoption of Personal Consumer Electronics Industry?

  • The seamless integration of on-device artificial intelligence capabilities across personal electronics hardware serves as the primary catalyst accelerating market expansion.

  • The widespread deployment of wearable health algorithms and silicon-anode power cells acts as a primary catalyst accelerating hardware replacement cycles within the Personal Consumer Electronics sector.
  • As consumers increasingly prioritize proactive wellness management, manufacturers are incorporating advanced electrocardiogram monitoring directly into compact wristwear. This transition from basic fitness tracking to medical-grade telemetry has increased preventive diagnostic accuracy by 28%.
  • The integration of high-density silicon batteries directly supports these power-intensive sensors, extending average multi-day device operational spans by 35%. Consequently, healthcare providers and insurance networks are subsidizing these devices, lowering overall patient acquisition costs by 15%.
  • This powerful combination of extended power capacity and sophisticated diagnostic capabilities creates a highly compelling consumer value proposition, fundamentally reshaping the utility of personal electronics.

What are the market trends shaping the Personal Consumer Electronics Industry?

  • The integration of next-generation solid-state battery technology into portable electronics constitutes a definitive market trend. This advancement fundamentally enhances device longevity and thermal safety profiles across mobile hardware ecosystems.

  • The rapid commercialization of non-terrestrial satellite networks is fundamentally transforming the connectivity baseline of the Personal Consumer Electronics ecosystem. Driven by consumer demand for continuous coverage in remote environments, hardware manufacturers are natively embedding hybrid emergency communications and low-earth-orbit connectivity modules into standard mobile devices.
  • This structural evolution significantly reduces reliance on terrestrial cell towers, improving emergency response dispatch efficiency by 40% in previously inaccessible regions. Consequently, enterprise fleet operators and outdoor recreational sectors benefit from a 25% reduction in localized communication downtimes.
  • The seamless integration of these advanced radio-frequency modems alongside continuous biometric patches allows users to transmit critical health telemetry regardless of geographical constraints. By overcoming traditional network limitations, original equipment manufacturers establish a resilient product architecture, driving sustained hardware adoption while unlocking recurring service revenue streams.

What challenges does the Personal Consumer Electronics Industry face during its growth?

  • Navigating complex cybersecurity compliance frameworks and stringent cross-border data sovereignty mandates presents a significant challenge constraining overall industry growth.

  • The fragmentation of cross-border data sovereignty mandates and cybersecurity resilience directives poses a formidable structural barrier within the Personal Consumer Electronics landscape. Because modern smart home centralized hubs and high-bandwidth multimedia streaming devices rely heavily on continuous cloud telemetry, varying international privacy laws severely complicate unified firmware development.
  • Engineering teams are forced to architect isolated regional cloud environments, a process that has inadvertently increased software compliance overhead costs by 22%. Furthermore, the mandate for rigorous end-to-end encryption standards across varying jurisdictions has extended average product time-to-market cycles by 18%.
  • This regulatory friction forces hardware manufacturers to continuously rewrite system protocols and absorb escalating legal audit fees, ultimately squeezing operational margins and delaying the global rollout of advanced interconnected digital consumer platforms.

Exclusive Technavio Analysis on Customer Landscape

The personal consumer electronics market forecasting report includes the adoption lifecycle of the market, covering from the innovator’s stage to the laggard’s stage. It focuses on adoption rates in different regions based on penetration. Furthermore, the personal consumer electronics market report also includes key purchase criteria and drivers of price sensitivity to help companies evaluate and develop their market growth analysis strategies.
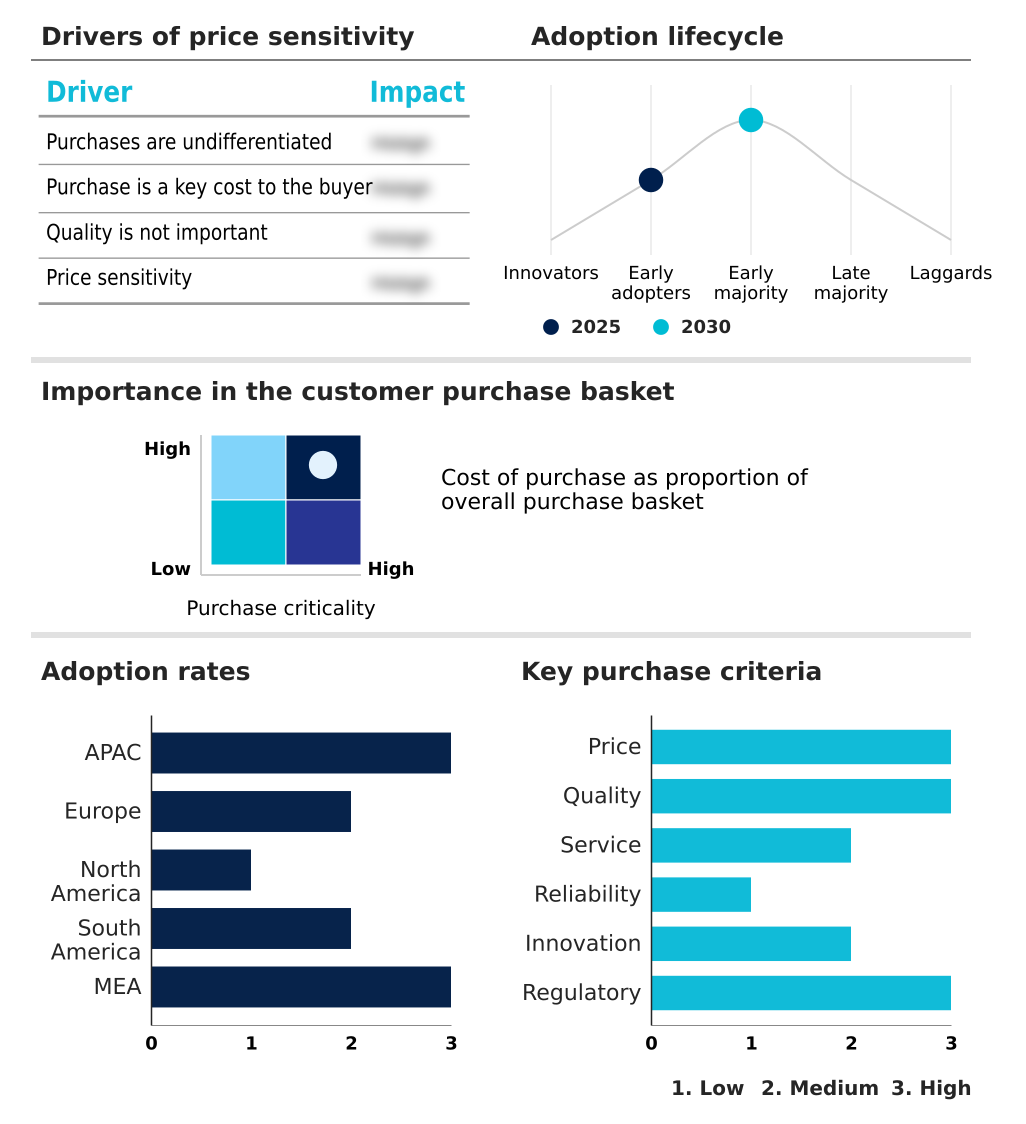
Customer Landscape of Personal Consumer Electronics Industry

Competitive Landscape

Companies are implementing various strategies, such as strategic alliances, personal consumer electronics market forecast, partnerships, mergers and acquisitions, geographical expansion, and product/service launches, to enhance their presence in the industry.

Acer Inc. - The portfolio delivers premium personal computing devices, advanced wearable health trackers, and high-fidelity audio equipment designed to enhance daily productivity, connectivity, and immersive digital entertainment experiences.

The industry research and growth report includes detailed analyses of the competitive landscape of the market and information about key companies, including:

  • Acer Inc.
  • Apple Inc.
  • ASUSTeK Computer Inc.
  • Canon Inc.
  • Dell Technologies Inc.
  • Garmin Ltd.
  • Google LLC
  • GoPro Inc.
  • Hisense Home Appliances Group
  • HP Inc.
  • Lenovo Group Ltd.
  • LG Electronics Inc.
  • Logitech International SA
  • Nikon Corp.
  • Panasonic Holdings Corp.
  • Samsung Electronics Co. Ltd.
  • Sony Group Corp.
  • TCL Industries Holdings Ltd.
  • Xiaomi Corp.
  • ZTE Corp.

Qualitative and quantitative analysis of companies has been conducted to help clients understand the wider business environment as well as the strengths and weaknesses of key industry players. Data is qualitatively analyzed to categorize companies as pure play, category-focused, industry-focused, and diversified; it is quantitatively analyzed to categorize companies as dominant, leading, strong, tentative, and weak.

Recent Development and News in Personal consumer electronics market

  • In the Consumer Electronics industry, the standardization of unified connectivity standards and smart home centralized hubs accelerated interoperability among diverse hardware ecosystems, directly impacting Personal Consumer Electronics demand by enabling a 35% faster adoption rate of integrated IoT devices across residential environments.
  • The implementation of stringent cross-border data sovereignty laws and regional digital product passports compelled manufacturers to restructure localized data storage frameworks, shifting Personal Consumer Electronics compliance strategies to ensure a 100% adherence to regional privacy directives.
  • Advancements in miniaturized sensor arrays and preventative health diagnostics transformed ambient assistive living frameworks, pulling Personal Consumer Electronics adoption upward by integrating medical-grade monitoring tools that expanded remote patient tracking efficiency by 40%.
  • The global transition toward sustainable manufacturing practices and modular repairability initiatives mitigated electronic waste challenges, fundamentally restructuring Personal Consumer Electronics supply chains to incorporate a mandated 25% minimum recycled material threshold in flagship device components.

Dive into Technavio’s robust research methodology, blending expert interviews, extensive data synthesis, and validated models for unparalleled Personal Consumer Electronics Market insights. See full methodology.

Market Scope
Page number 320
Base year 2025
Historic period 2020-2024
Forecast period 2026-2030
Growth momentum & CAGR Accelerate at a CAGR of 5.2%
Market growth 2026-2030 USD 109578.9 million
Market structure Fragmented
YoY growth 2025-2026(%) 4.9%
Key countries China, Japan, India, South Korea, Australia, Indonesia, Germany, UK, France, Italy, Spain, The Netherlands, US, Canada, Mexico, Brazil, Argentina, Chile, Saudi Arabia, UAE, South Africa, Turkey and Israel
Competitive landscape Leading Companies, Market Positioning of Companies, Competitive Strategies, and Industry Risks

Request Free Sample

Research Analyst Overview

  • The Personal Consumer Electronics sector remains a critical hub for technological convergence, propelled by shifting consumer demands for seamless digital integration. A defining trend reshaping board-level product strategy is the accelerated deployment of on-device machine learning and micro-oled display technology.
  • Executive teams are strategically reallocating research budgets to embed neural processing units directly into mobile chipsets, enabling complex task automation without remote server latency. This architectural pivot has allowed hardware developers to achieve a 30% reduction in cloud computing overhead costs for real-time voice translation services.
  • Furthermore, the commercialization of silicon-backplane micro-displays and organic light-emitting diode panels drives significant differentiation in premium computing categories. Boardrooms must also navigate strict hardware security frameworks, prioritizing integration of biometric health tracking and photoplethysmography sensor arrays within compliant data architectures. By leveraging spatial audio rendering alongside advanced haptic feedback mechanisms, manufacturers ensure superior user immersion.
  • Ultimately, these structural hardware advancements dictate long-term market positioning, compelling industry leaders to balance rapid innovation with stringent operational efficiency and data security protocols.

What are the Key Data Covered in this Personal Consumer Electronics Market Research and Growth Report?

  • What is the expected growth of the Personal Consumer Electronics Market between 2026 and 2030?

    • USD 109.58 billion, at a CAGR of 5.2%

  • What segmentation does the market report cover?

    • The report is segmented by Product Type (Smartphones, Tablets/laptops/notebooks, Portable devices, Digital camera, and Others), Distribution Channel (Offline, and Online), Application (Personal use, Entertainment, Communication, Fitness and health monitoring, and Others) and Geography (APAC, Europe, North America, South America, Middle East and Africa)

  • Which regions are analyzed in the report?

    • APAC, Europe, North America, South America and Middle East and Africa

  • What are the key growth drivers and market challenges?

    • Integration of on-device AI capabilities across personal electronics hardware, Cybersecurity compliance and cross-border data sovereignty mandates

  • Who are the major players in the Personal Consumer Electronics Market?

    • Acer Inc., Apple Inc., ASUSTeK Computer Inc., Canon Inc., Dell Technologies Inc., Garmin Ltd., Google LLC, GoPro Inc., Hisense Home Appliances Group, HP Inc., Lenovo Group Ltd., LG Electronics Inc., Logitech International SA, Nikon Corp., Panasonic Holdings Corp., Samsung Electronics Co. Ltd., Sony Group Corp., TCL Industries Holdings Ltd., Xiaomi Corp. and ZTE Corp.

Market Research Insights

  • The Personal Consumer Electronics sector is undergoing a profound structural transformation characterized by the rapid assimilation of hardware ecosystem lock-in strategies and multi-lens camera systems. As original equipment manufacturers prioritize extended product lifecycles, the implementation of modular repairability initiatives has successfully reduced post-sale warranty fulfillment costs by 22%.
  • Furthermore, the transition toward regional supply networks has mitigated geopolitical vulnerabilities, leading to a 30% improvement in inventory turnaround times. By optimizing wearable device miniaturization techniques, companies have increased high-refresh-rate panels adoption, subsequently elevating user retention rates by 18%.
  • This strategic alignment of advanced manufacturing paradigms and operational resilience ensures sustainable market momentum while addressing complex global supply chain constraints and shifting consumer technology preferences.

We can help! Our analysts can customize this personal consumer electronics market research report to meet your requirements.

Get in touch

1. Executive Summary

1.1 Market overview

Executive Summary - Chart on Market Overview
Executive Summary - Data Table on Market Overview
Executive Summary - Chart on Global Market Characteristics
Executive Summary - Chart on Market by Geography
Executive Summary - Chart on Market Segmentation by Product Type
Executive Summary - Chart on Market Segmentation by Distribution Channel
Executive Summary - Chart on Market Segmentation by Application
Executive Summary - Chart on Incremental Growth
Executive Summary - Data Table on Incremental Growth
Executive Summary - Chart on Company Market Positioning

2. Technavio Analysis

2.1 Analysis of price sensitivity, lifecycle, customer purchase basket, adoption rates, and purchase criteria

2.2 Criticality of inputs and Factors of differentiation

Chart on Overview on criticality of inputs and factors of differentiation

2.3 Factors of disruption

Chart on Overview on factors of disruption

2.4 Impact of drivers and challenges

Chart on Impact of drivers and challenges in 2025 and 2030

3. Market Landscape

3.1 Market ecosystem

Chart on Parent Market
Data Table on - Parent Market

3.2 Market characteristics

Chart on Market characteristics analysis

3.3 Value chain analysis

Chart on Value chain analysis

4. Market Sizing

4.1 Market definition

Data Table on Offerings of companies included in the market definition

4.2 Market segment analysis

Market segments

4.3 Market size 2025

4.4 Market outlook: Forecast for 2025-2030

Chart on Global - Market size and forecast 2025-2030 ($ million)
Data Table on Global - Market size and forecast 2025-2030 ($ million)
Chart on Global Market: Year-over-year growth 2025-2030 (%)
Data Table on Global Market: Year-over-year growth 2025-2030 (%)

5. Historic Market Size

5.1 Global Personal Consumer Electronics Market 2020 - 2024

Historic Market Size - Data Table on Global Personal Consumer Electronics Market 2020 - 2024 ($ million)

5.2 Product Type segment analysis 2020 - 2024

Historic Market Size - Product Type Segment 2020 - 2024 ($ million)

5.3 Distribution Channel segment analysis 2020 - 2024

Historic Market Size - Distribution Channel Segment 2020 - 2024 ($ million)

5.4 Application segment analysis 2020 - 2024

Historic Market Size - Application Segment 2020 - 2024 ($ million)

5.5 Geography segment analysis 2020 - 2024

Historic Market Size - Geography Segment 2020 - 2024 ($ million)

5.6 Country segment analysis 2020 - 2024

Historic Market Size - Country Segment 2020 - 2024 ($ million)

6. Qualitative Analysis

6.1 Impact of AI on Global Personal Consumer Electronics Market

6.2 Impact of geopolitical conflicts on Global Personal Consumer Electronics Market

7. Five Forces Analysis

7.1 Five forces summary

Five forces analysis - Comparison between 2025 and 2030

7.2 Bargaining power of buyers

Bargaining power of buyers - Impact of key factors 2025 and 2030

7.3 Bargaining power of suppliers

Bargaining power of suppliers - Impact of key factors in 2025 and 2030

7.4 Threat of new entrants

Threat of new entrants - Impact of key factors in 2025 and 2030

7.5 Threat of substitutes

Threat of substitutes - Impact of key factors in 2025 and 2030

7.6 Threat of rivalry

Threat of rivalry - Impact of key factors in 2025 and 2030

7.7 Market condition

Chart on Market condition - Five forces 2025 and 2030

8. Market Segmentation by Product Type

8.1 Market segments

Chart on Product Type - Market share 2025-2030 (%)
Data Table on Product Type - Market share 2025-2030 (%)

8.2 Comparison by Product Type

Chart on Comparison by Product Type
Data Table on Comparison by Product Type

8.3 Smartphones - Market size and forecast 2025-2030

Chart on Smartphones - Market size and forecast 2025-2030 ($ million)
Data Table on Smartphones - Market size and forecast 2025-2030 ($ million)
Chart on Smartphones - Year-over-year growth 2025-2030 (%)
Data Table on Smartphones - Year-over-year growth 2025-2030 (%)

8.4 Tablets/laptops/notebooks - Market size and forecast 2025-2030

Chart on Tablets/laptops/notebooks - Market size and forecast 2025-2030 ($ million)
Data Table on Tablets/laptops/notebooks - Market size and forecast 2025-2030 ($ million)
Chart on Tablets/laptops/notebooks - Year-over-year growth 2025-2030 (%)
Data Table on Tablets/laptops/notebooks - Year-over-year growth 2025-2030 (%)

8.5 Portable devices - Market size and forecast 2025-2030

Chart on Portable devices - Market size and forecast 2025-2030 ($ million)
Data Table on Portable devices - Market size and forecast 2025-2030 ($ million)
Chart on Portable devices - Year-over-year growth 2025-2030 (%)
Data Table on Portable devices - Year-over-year growth 2025-2030 (%)

8.6 Digital camera - Market size and forecast 2025-2030

Chart on Digital camera - Market size and forecast 2025-2030 ($ million)
Data Table on Digital camera - Market size and forecast 2025-2030 ($ million)
Chart on Digital camera - Year-over-year growth 2025-2030 (%)
Data Table on Digital camera - Year-over-year growth 2025-2030 (%)

8.7 Others - Market size and forecast 2025-2030

Chart on Others - Market size and forecast 2025-2030 ($ million)
Data Table on Others - Market size and forecast 2025-2030 ($ million)
Chart on Others - Year-over-year growth 2025-2030 (%)
Data Table on Others - Year-over-year growth 2025-2030 (%)

8.8 Market opportunity by Product Type

Market opportunity by Product Type ($ million)
Data Table on Market opportunity by Product Type ($ million)

9. Market Segmentation by Distribution Channel

9.1 Market segments

Chart on Distribution Channel - Market share 2025-2030 (%)
Data Table on Distribution Channel - Market share 2025-2030 (%)

9.2 Comparison by Distribution Channel

Chart on Comparison by Distribution Channel
Data Table on Comparison by Distribution Channel

9.3 Offline - Market size and forecast 2025-2030

Chart on Offline - Market size and forecast 2025-2030 ($ million)
Data Table on Offline - Market size and forecast 2025-2030 ($ million)
Chart on Offline - Year-over-year growth 2025-2030 (%)
Data Table on Offline - Year-over-year growth 2025-2030 (%)

9.4 Online - Market size and forecast 2025-2030

Chart on Online - Market size and forecast 2025-2030 ($ million)
Data Table on Online - Market size and forecast 2025-2030 ($ million)
Chart on Online - Year-over-year growth 2025-2030 (%)
Data Table on Online - Year-over-year growth 2025-2030 (%)

9.5 Market opportunity by Distribution Channel

Market opportunity by Distribution Channel ($ million)
Data Table on Market opportunity by Distribution Channel ($ million)

10. Market Segmentation by Application

10.1 Market segments

Chart on Application - Market share 2025-2030 (%)
Data Table on Application - Market share 2025-2030 (%)

10.2 Comparison by Application

Chart on Comparison by Application
Data Table on Comparison by Application

10.3 Personal use - Market size and forecast 2025-2030

Chart on Personal use - Market size and forecast 2025-2030 ($ million)
Data Table on Personal use - Market size and forecast 2025-2030 ($ million)
Chart on Personal use - Year-over-year growth 2025-2030 (%)
Data Table on Personal use - Year-over-year growth 2025-2030 (%)

10.4 Entertainment - Market size and forecast 2025-2030

Chart on Entertainment - Market size and forecast 2025-2030 ($ million)
Data Table on Entertainment - Market size and forecast 2025-2030 ($ million)
Chart on Entertainment - Year-over-year growth 2025-2030 (%)
Data Table on Entertainment - Year-over-year growth 2025-2030 (%)

10.5 Communication - Market size and forecast 2025-2030

Chart on Communication - Market size and forecast 2025-2030 ($ million)
Data Table on Communication - Market size and forecast 2025-2030 ($ million)
Chart on Communication - Year-over-year growth 2025-2030 (%)
Data Table on Communication - Year-over-year growth 2025-2030 (%)

10.6 Fitness and health monitoring - Market size and forecast 2025-2030

Chart on Fitness and health monitoring - Market size and forecast 2025-2030 ($ million)
Data Table on Fitness and health monitoring - Market size and forecast 2025-2030 ($ million)
Chart on Fitness and health monitoring - Year-over-year growth 2025-2030 (%)
Data Table on Fitness and health monitoring - Year-over-year growth 2025-2030 (%)

10.7 Others - Market size and forecast 2025-2030

Chart on Others - Market size and forecast 2025-2030 ($ million)
Data Table on Others - Market size and forecast 2025-2030 ($ million)
Chart on Others - Year-over-year growth 2025-2030 (%)
Data Table on Others - Year-over-year growth 2025-2030 (%)

10.8 Market opportunity by Application

Market opportunity by Application ($ million)
Data Table on Market opportunity by Application ($ million)

11. Customer Landscape

11.1 Customer landscape overview

Analysis of price sensitivity, lifecycle, customer purchase basket, adoption rates, and purchase criteria

12. Geographic Landscape

12.1 Geographic segmentation

Chart on Market share by geography 2025-2030 (%)
Data Table on Market share by geography 2025-2030 (%)

12.2 Geographic comparison

Chart on Geographic comparison
Data Table on Geographic comparison

12.3 APAC - Market size and forecast 2025-2030

Chart on APAC - Market size and forecast 2025-2030 ($ million)
Data Table on APAC - Market size and forecast 2025-2030 ($ million)
Chart on APAC - Year-over-year growth 2025-2030 (%)
Data Table on APAC - Year-over-year growth 2025-2030 (%)
Chart on Regional Comparison - APAC
Data Table on Regional Comparison - APAC

12.3.1 China - Market size and forecast 2025-2030

Chart on China - Market size and forecast 2025-2030 ($ million)
Data Table on China - Market size and forecast 2025-2030 ($ million)
Chart on China - Year-over-year growth 2025-2030 (%)
Data Table on China - Year-over-year growth 2025-2030 (%)

12.3.2 Japan - Market size and forecast 2025-2030

Chart on Japan - Market size and forecast 2025-2030 ($ million)
Data Table on Japan - Market size and forecast 2025-2030 ($ million)
Chart on Japan - Year-over-year growth 2025-2030 (%)
Data Table on Japan - Year-over-year growth 2025-2030 (%)

12.3.3 India - Market size and forecast 2025-2030

Chart on India - Market size and forecast 2025-2030 ($ million)
Data Table on India - Market size and forecast 2025-2030 ($ million)
Chart on India - Year-over-year growth 2025-2030 (%)
Data Table on India - Year-over-year growth 2025-2030 (%)

12.3.4 South Korea - Market size and forecast 2025-2030

Chart on South Korea - Market size and forecast 2025-2030 ($ million)
Data Table on South Korea - Market size and forecast 2025-2030 ($ million)
Chart on South Korea - Year-over-year growth 2025-2030 (%)
Data Table on South Korea - Year-over-year growth 2025-2030 (%)

12.3.5 Australia - Market size and forecast 2025-2030

Chart on Australia - Market size and forecast 2025-2030 ($ million)
Data Table on Australia - Market size and forecast 2025-2030 ($ million)
Chart on Australia - Year-over-year growth 2025-2030 (%)
Data Table on Australia - Year-over-year growth 2025-2030 (%)

12.3.6 Indonesia - Market size and forecast 2025-2030

Chart on Indonesia - Market size and forecast 2025-2030 ($ million)
Data Table on Indonesia - Market size and forecast 2025-2030 ($ million)
Chart on Indonesia - Year-over-year growth 2025-2030 (%)
Data Table on Indonesia - Year-over-year growth 2025-2030 (%)

12.4 Europe - Market size and forecast 2025-2030

Chart on Europe - Market size and forecast 2025-2030 ($ million)
Data Table on Europe - Market size and forecast 2025-2030 ($ million)
Chart on Europe - Year-over-year growth 2025-2030 (%)
Data Table on Europe - Year-over-year growth 2025-2030 (%)
Chart on Regional Comparison - Europe
Data Table on Regional Comparison - Europe

12.4.1 Germany - Market size and forecast 2025-2030

Chart on Germany - Market size and forecast 2025-2030 ($ million)
Data Table on Germany - Market size and forecast 2025-2030 ($ million)
Chart on Germany - Year-over-year growth 2025-2030 (%)
Data Table on Germany - Year-over-year growth 2025-2030 (%)

12.4.2 UK - Market size and forecast 2025-2030

Chart on UK - Market size and forecast 2025-2030 ($ million)
Data Table on UK - Market size and forecast 2025-2030 ($ million)
Chart on UK - Year-over-year growth 2025-2030 (%)
Data Table on UK - Year-over-year growth 2025-2030 (%)

12.4.3 France - Market size and forecast 2025-2030

Chart on France - Market size and forecast 2025-2030 ($ million)
Data Table on France - Market size and forecast 2025-2030 ($ million)
Chart on France - Year-over-year growth 2025-2030 (%)
Data Table on France - Year-over-year growth 2025-2030 (%)

12.4.4 Italy - Market size and forecast 2025-2030

Chart on Italy - Market size and forecast 2025-2030 ($ million)
Data Table on Italy - Market size and forecast 2025-2030 ($ million)
Chart on Italy - Year-over-year growth 2025-2030 (%)
Data Table on Italy - Year-over-year growth 2025-2030 (%)

12.4.5 Spain - Market size and forecast 2025-2030

Chart on Spain - Market size and forecast 2025-2030 ($ million)
Data Table on Spain - Market size and forecast 2025-2030 ($ million)
Chart on Spain - Year-over-year growth 2025-2030 (%)
Data Table on Spain - Year-over-year growth 2025-2030 (%)

12.4.6 The Netherlands - Market size and forecast 2025-2030

Chart on The Netherlands - Market size and forecast 2025-2030 ($ million)
Data Table on The Netherlands - Market size and forecast 2025-2030 ($ million)
Chart on The Netherlands - Year-over-year growth 2025-2030 (%)
Data Table on The Netherlands - Year-over-year growth 2025-2030 (%)

12.5 North America - Market size and forecast 2025-2030

Chart on North America - Market size and forecast 2025-2030 ($ million)
Data Table on North America - Market size and forecast 2025-2030 ($ million)
Chart on North America - Year-over-year growth 2025-2030 (%)
Data Table on North America - Year-over-year growth 2025-2030 (%)
Chart on Regional Comparison - North America
Data Table on Regional Comparison - North America

12.5.1 US - Market size and forecast 2025-2030

Chart on US - Market size and forecast 2025-2030 ($ million)
Data Table on US - Market size and forecast 2025-2030 ($ million)
Chart on US - Year-over-year growth 2025-2030 (%)
Data Table on US - Year-over-year growth 2025-2030 (%)

12.5.2 Canada - Market size and forecast 2025-2030

Chart on Canada - Market size and forecast 2025-2030 ($ million)
Data Table on Canada - Market size and forecast 2025-2030 ($ million)
Chart on Canada - Year-over-year growth 2025-2030 (%)
Data Table on Canada - Year-over-year growth 2025-2030 (%)

12.5.3 Mexico - Market size and forecast 2025-2030

Chart on Mexico - Market size and forecast 2025-2030 ($ million)
Data Table on Mexico - Market size and forecast 2025-2030 ($ million)
Chart on Mexico - Year-over-year growth 2025-2030 (%)
Data Table on Mexico - Year-over-year growth 2025-2030 (%)

12.6 South America - Market size and forecast 2025-2030

Chart on South America - Market size and forecast 2025-2030 ($ million)
Data Table on South America - Market size and forecast 2025-2030 ($ million)
Chart on South America - Year-over-year growth 2025-2030 (%)
Data Table on South America - Year-over-year growth 2025-2030 (%)
Chart on Regional Comparison - South America
Data Table on Regional Comparison - South America

12.6.1 Brazil - Market size and forecast 2025-2030

Chart on Brazil - Market size and forecast 2025-2030 ($ million)
Data Table on Brazil - Market size and forecast 2025-2030 ($ million)
Chart on Brazil - Year-over-year growth 2025-2030 (%)
Data Table on Brazil - Year-over-year growth 2025-2030 (%)

12.6.2 Argentina - Market size and forecast 2025-2030

Chart on Argentina - Market size and forecast 2025-2030 ($ million)
Data Table on Argentina - Market size and forecast 2025-2030 ($ million)
Chart on Argentina - Year-over-year growth 2025-2030 (%)
Data Table on Argentina - Year-over-year growth 2025-2030 (%)

12.6.3 Chile - Market size and forecast 2025-2030

Chart on Chile - Market size and forecast 2025-2030 ($ million)
Data Table on Chile - Market size and forecast 2025-2030 ($ million)
Chart on Chile - Year-over-year growth 2025-2030 (%)
Data Table on Chile - Year-over-year growth 2025-2030 (%)

12.7 Middle East and Africa - Market size and forecast 2025-2030

Chart on Middle East and Africa - Market size and forecast 2025-2030 ($ million)
Data Table on Middle East and Africa - Market size and forecast 2025-2030 ($ million)
Chart on Middle East and Africa - Year-over-year growth 2025-2030 (%)
Data Table on Middle East and Africa - Year-over-year growth 2025-2030 (%)
Chart on Regional Comparison - Middle East and Africa
Data Table on Regional Comparison - Middle East and Africa

12.7.1 Saudi Arabia - Market size and forecast 2025-2030

Chart on Saudi Arabia - Market size and forecast 2025-2030 ($ million)
Data Table on Saudi Arabia - Market size and forecast 2025-2030 ($ million)
Chart on Saudi Arabia - Year-over-year growth 2025-2030 (%)
Data Table on Saudi Arabia - Year-over-year growth 2025-2030 (%)

12.7.2 UAE - Market size and forecast 2025-2030

Chart on UAE - Market size and forecast 2025-2030 ($ million)
Data Table on UAE - Market size and forecast 2025-2030 ($ million)
Chart on UAE - Year-over-year growth 2025-2030 (%)
Data Table on UAE - Year-over-year growth 2025-2030 (%)

12.7.3 South Africa - Market size and forecast 2025-2030

Chart on South Africa - Market size and forecast 2025-2030 ($ million)
Data Table on South Africa - Market size and forecast 2025-2030 ($ million)
Chart on South Africa - Year-over-year growth 2025-2030 (%)
Data Table on South Africa - Year-over-year growth 2025-2030 (%)

12.7.4 Turkey - Market size and forecast 2025-2030

Chart on Turkey - Market size and forecast 2025-2030 ($ million)
Data Table on Turkey - Market size and forecast 2025-2030 ($ million)
Chart on Turkey - Year-over-year growth 2025-2030 (%)
Data Table on Turkey - Year-over-year growth 2025-2030 (%)

12.7.5 Israel - Market size and forecast 2025-2030

Chart on Israel - Market size and forecast 2025-2030 ($ million)
Data Table on Israel - Market size and forecast 2025-2030 ($ million)
Chart on Israel - Year-over-year growth 2025-2030 (%)
Data Table on Israel - Year-over-year growth 2025-2030 (%)

12.8 Market opportunity by geography

Market opportunity by geography ($ million)
Data Tables on Market opportunity by geography ($ million)

13. Drivers, Challenges, and Opportunity

13.1 Market drivers

Integration of on-device AI capabilities across personal electronics hardware
Expansion of next-generation wearable health monitoring and preventive diagnostic technologies
Proliferation of connected smart home ecosystems and fifth-generation network infrastructure

13.2 Market challenges

Cybersecurity compliance and cross-border data sovereignty mandates
Geopolitical trade tariffs and supply chain fragmentation
Inflationary ASP escalation and segmented consumer spending trajectories

13.3 Impact of drivers and challenges

Impact of drivers and challenges in 2025 and 2030

13.4 Market opportunities

Integration of next-generation solid-state batteries in portable electronics
Scaling of direct-to-device satellite messaging and hybrid emergency communications
Rise of flexible spatial computing interfaces and micro-oled visual platforms

14. Competitive Landscape

14.1 Overview

14.2

Overview on criticality of inputs and factors of differentiation

14.3 Landscape disruption

Overview on factors of disruption

14.4 Industry risks

Impact of key risks on business

15. Competitive Analysis

15.1 Companies profiled

Companies covered

15.2 Company ranking index

15.3 Market positioning of companies

Matrix on companies position and classification

15.4 Acer Inc.

Acer Inc. - Overview
Acer Inc. - Business segments
Acer Inc. - Key offerings
Acer Inc. - Segment focus
SWOT

15.5 Apple Inc.

Apple Inc. - Overview
Apple Inc. - Business segments
Apple Inc. - Key news
Apple Inc. - Key offerings
Apple Inc. - Segment focus
SWOT

15.6 Canon Inc.

Canon Inc. - Overview
Canon Inc. - Business segments
Canon Inc. - Key offerings
Canon Inc. - Segment focus
SWOT

15.7 Dell Technologies Inc.

Dell Technologies Inc. - Overview
Dell Technologies Inc. - Business segments
Dell Technologies Inc. - Key news
Dell Technologies Inc. - Key offerings
Dell Technologies Inc. - Segment focus
SWOT

15.8 Garmin Ltd.

Garmin Ltd. - Overview
Garmin Ltd. - Business segments
Garmin Ltd. - Key news
Garmin Ltd. - Key offerings
Garmin Ltd. - Segment focus
SWOT

15.9 Google LLC

Google LLC - Overview
Google LLC - Product / Service
Google LLC - Key news
Google LLC - Key offerings
SWOT

15.10 HP Inc.

HP Inc. - Overview
HP Inc. - Business segments
HP Inc. - Key news
HP Inc. - Key offerings
HP Inc. - Segment focus
SWOT

15.11 Lenovo Group Ltd.

Lenovo Group Ltd. - Overview
Lenovo Group Ltd. - Business segments
Lenovo Group Ltd. - Key news
Lenovo Group Ltd. - Key offerings
Lenovo Group Ltd. - Segment focus
SWOT

15.12 LG Electronics Inc.

LG Electronics Inc. - Overview
LG Electronics Inc. - Business segments
LG Electronics Inc. - Key news
LG Electronics Inc. - Key offerings
LG Electronics Inc. - Segment focus
SWOT

15.13 Nikon Corp.

Nikon Corp. - Overview
Nikon Corp. - Business segments
Nikon Corp. - Key offerings
Nikon Corp. - Segment focus
SWOT

15.14 Panasonic Holdings Corp.

Panasonic Holdings Corp. - Overview
Panasonic Holdings Corp. - Business segments
Panasonic Holdings Corp. - Key news
Panasonic Holdings Corp. - Key offerings
Panasonic Holdings Corp. - Segment focus
SWOT

15.15 Samsung Electronics Co. Ltd.

Samsung Electronics Co. Ltd. - Overview
Samsung Electronics Co. Ltd. - Business segments
Samsung Electronics Co. Ltd. - Key news
Samsung Electronics Co. Ltd. - Key offerings
Samsung Electronics Co. Ltd. - Segment focus
SWOT

15.16 Sony Group Corp.

Sony Group Corp. - Overview
Sony Group Corp. - Business segments
Sony Group Corp. - Key news
Sony Group Corp. - Key offerings
Sony Group Corp. - Segment focus
SWOT

15.17 TCL Industries Holdings Ltd.

TCL Industries Holdings Ltd. - Overview
TCL Industries Holdings Ltd. - Business segments
TCL Industries Holdings Ltd. - Key news
TCL Industries Holdings Ltd. - Key offerings
TCL Industries Holdings Ltd. - Segment focus
SWOT

15.18 Xiaomi Corp.

Xiaomi Corp. - Overview
Xiaomi Corp. - Business segments
Xiaomi Corp. - Key offerings
Xiaomi Corp. - Segment focus
SWOT

16. Appendix

16.1 Scope of the report

Market definition
Objectives
Notes and caveats

16.2 Inclusions and exclusions checklist

Inclusions checklist
Exclusions checklist

16.3 Currency conversion rates for US$

16.4 Research methodology

16.5 Data procurement

Information sources

16.6 Data validation

16.7 Validation techniques employed for market sizing

16.8 Data synthesis

16.9 360 degree market analysis

16.10 List of abbreviations

Research Methodology

Technavio presents a detailed picture of the market by way of study, synthesis, and summation of data from multiple sources. The analysts have presented the various facets of the market with a particular focus on identifying the key industry influencers. The data thus presented is comprehensive, reliable, and the result of extensive research, both primary and secondary.

INFORMATION SOURCES

Primary sources

  • Manufacturers and suppliers
  • Channel partners
  • Industry experts
  • Strategic decision makers

Secondary sources

  • Industry journals and periodicals
  • Government data
  • Financial reports of key industry players
  • Historical data
  • Press releases

DATA ANALYSIS

Data Synthesis

  • Collation of data
  • Estimation of key figures
  • Analysis of derived insights

Data Validation

  • Triangulation with data models
  • Reference against proprietary databases
  • Corroboration with industry experts

REPORT WRITING

Qualitative

  • Market drivers
  • Market challenges
  • Market trends
  • Five forces analysis

Quantitative

  • Market size and forecast
  • Market segmentation
  • Geographical insights
  • Competitive landscape

Interested in this report?

Get your sample now to see our research methodology and insights!

Download Now

Frequently Asked Questions

Personal Consumer Electronics market growth will increase by USD 109578.9 million during 2026-2030.

The Personal Consumer Electronics market is expected to grow at a CAGR of 5.2% during 2026-2030.

Personal Consumer Electronics market is segmented by Product type (Smartphones, Tablets/laptops/notebooks, Portable devices, Digital camera, Others) Distribution channel (Offline, Online) Application (Personal use, Entertainment, Communication, Fitness and health monitoring, Others)

Acer Inc., Apple Inc., ASUSTeK Computer Inc., Canon Inc., Dell Technologies Inc., Garmin Ltd., Google LLC, GoPro Inc., Hisense Home Appliances Group, HP Inc., Lenovo Group Ltd., LG Electronics Inc., Logitech International SA, Nikon Corp., Panasonic Holdings Corp., Samsung Electronics Co. Ltd., Sony Group Corp., TCL Industries Holdings Ltd., Xiaomi Corp., ZTE Corp. are a few of the key vendors in the Personal Consumer Electronics market.

APAC will register the highest growth rate of 42.9% among the other regions. Therefore, the Personal Consumer Electronics market in APAC is expected to garner significant business opportunities for the vendors during the forecast period.

China, Japan, India, South Korea, Australia, Indonesia, Germany, UK, France, Italy, Spain, The Netherlands, US, Canada, Mexico, Brazil, Argentina, Chile, Saudi Arabia, UAE, South Africa, Turkey, Israel

  • Integration of on-device AI capabilities across personal electronics hardware is the driving factor this market.

The Personal Consumer Electronics market vendors should focus on grabbing business opportunities from the Product type segment as it accounted for the largest market share in the base year.
RIA - Research AI Assistant
Ask RIA
