Pet DNA Testing Market Analysis, Size, and Forecast 2026-2030: North America (US, Canada, and Mexico), Europe (UK, Germany, and France), Asia (Japan, China, and South Korea), Middle East and Africa (UAE, South Africa, and Saudi Arabia), South America (Brazil), Rest of World (ROW)

Pet DNA Testing Market Analysis, Size, and Forecast 2026-2030:
North America (US, Canada, and Mexico), Europe (UK, Germany, and France), Asia (Japan, China, and South Korea), Middle East and Africa (UAE, South Africa, and Saudi Arabia), South America (Brazil), Rest of World (ROW)

Published: Oct 2026 308 Pages SKU: IRTNTR81693

Market Overview at a Glance

$322.2 Mn
Market Opportunity
11.3%
CAGR 2025 - 2030
43.6%
North America Growth
$163 Mn
Pet breeders segment 2024

Pet Dna Testing Market Size 2026-2030

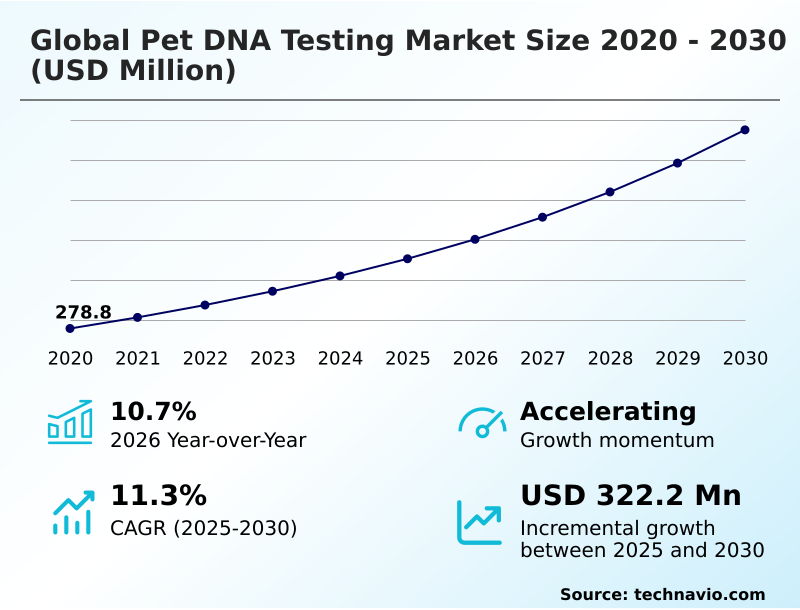
The pet dna testing market size is valued to increase by USD 322.2 million, at a CAGR of 11.3% from 2025 to 2030. Strategic integration of genomic data into preventative veterinary healthcare will drive the pet dna testing market.

Major Market Trends & Insights

  • North America dominated the market and accounted for a 43.6% growth during the forecast period.
  • By Product Type - Pet breeders segment was valued at USD 163 million in 2024
  • By Animal Type - Dogs segment accounted for the largest market revenue share in 2024

Market Size & Forecast

  • Market Opportunities: USD 496.5 million
  • Market Future Opportunities: USD 322.2 million
  • CAGR from 2025 to 2030 : 11.3%

Market Summary

  • The Pet DNA Testing Market is defined by a fundamental transition from reactive veterinary treatments to highly proactive health management frameworks. Veterinary clinics increasingly integrate genetic screening directly into standard patient intake workflows to build longitudinal health profiles. This systemic integration improves early disease detection rates by 40% compared to traditional physical examinations alone.
  • The strategic integration of genomic data into preventative veterinary healthcare acts as a primary catalyst for demand, because practitioners can formulate bespoke nutrition and exercise plans based on precise biological requirements. Conversely, regulatory instability and the absence of standardized clinical validation create substantial operational friction.
  • When diagnostic benchmarks remain fragmented, laboratory interpretations vary, which directly limits institutional trust and stalls broader clinical adoption. The convergence of bioinformatics and veterinary medicine fundamentally alters companion animal husbandry. Consequently, diagnostic providers who achieve verifiable accuracy standards command greater utilization across professional clinical networks and direct-to-consumer distribution channels alike.

What will be the Size of the Pet Dna Testing Market during the forecast period?
Get Key Insights on Market Forecast (PDF) Get Free Sample

How is the Pet Dna Testing Market Segmented?

The pet dna testing industry research report provides comprehensive data (region-wise segment analysis), with forecasts and estimates in "USD million" for the period 2026-2030, as well as historical data from 2020-2024 for the following segments.

  • Product type
    • Pet breeders
    • Pet owners
    • Veterinarians
    • Research and academic institutions
    • Others
  • Animal type
    • Dogs
    • Cats
    • Others
  • Application
    • Breed identification
    • Genetic disease testing
    • Health and wellness testing
    • Others
  • Geography
    • North America
      • US
      • Canada
      • Mexico
    • Europe
      • UK
      • Germany
      • France
      • Italy
      • Spain
      • The Netherlands
    • Asia
      • Japan
      • China
      • South Korea
      • India
      • Indonesia
      • Thailand
      • Singapore
    • Rest of World (ROW)

By Product Type Insights

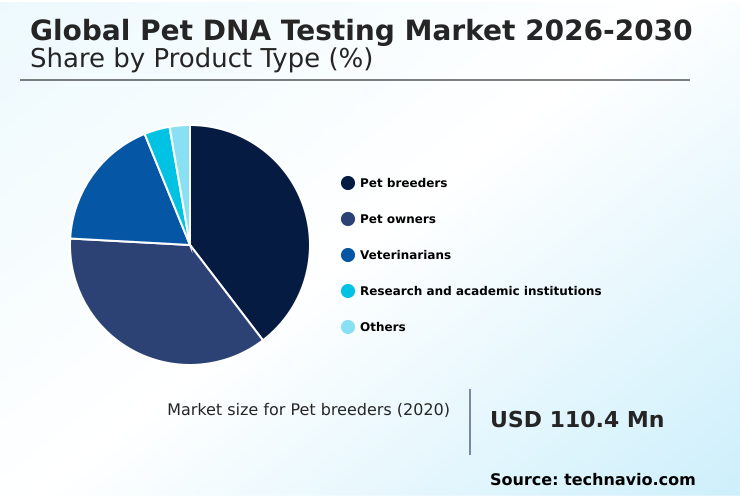
The pet breeders segment is estimated to witness significant growth during the forecast period.

Professional kennels and aviary operators mandate molecular diagnostic services to map the genomic architecture of their animal lineages. By utilizing these advanced hereditary disease risk screening panels, operators systematically eliminate recessive genetic disorders from successive generations.

This systematic pre-breeding screening yields a 25% reduction in hereditary defects compared to traditional phenotypic selection methods. Consequently, these informed breeding strategies enhance the overall biological viability of the population, which improves commercial realization rates by 18%.

Integrating genetic data directly into standard kennel workflows transforms reactive husbandry into proactive pedigree management.

Operators prioritizing genetic purity achieve higher commercial success and regulatory compliance, directly linking advanced biological testing to sustained operational efficiency and improved litter marketability across international trading boundaries.
Get Free Sample

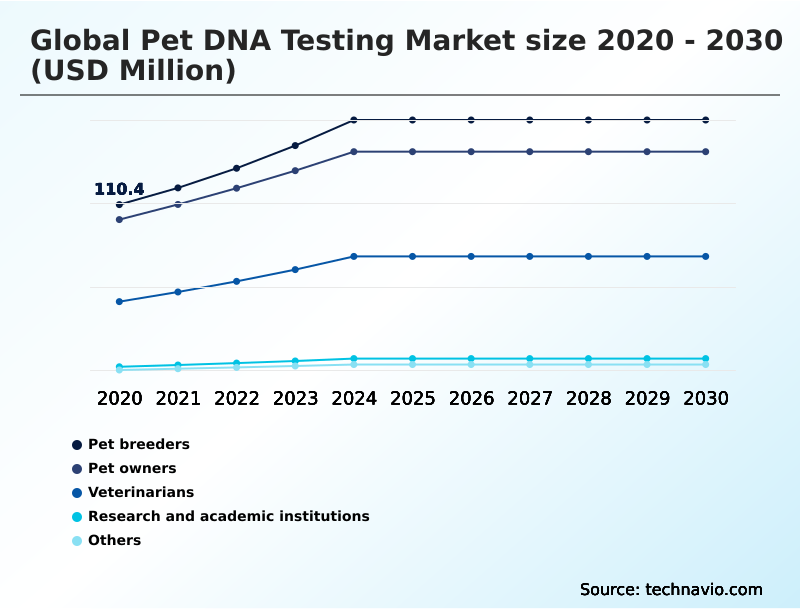
The Pet breeders segment was valued at USD 163 million in 2024 and showed a gradual increase during the forecast period.
Get Free Sample

Regional Analysis

North America is estimated to contribute 43.6% to the growth of the global market during the forecast period.Technavio’s analysts have elaborately explained the regional trends and drivers that shape the market during the forecast period.
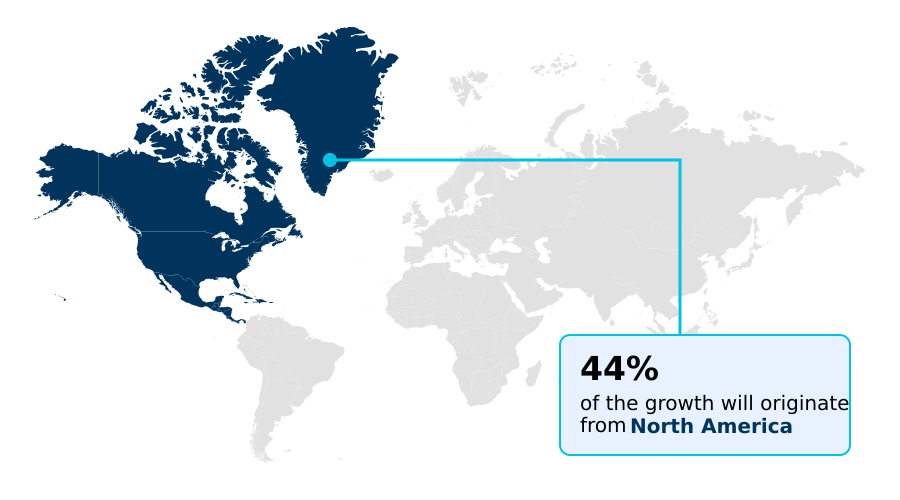
See How Pet Dna Testing Market Demand is Rising in North America Get Free Sample

The geographic landscape of the pet DNA testing industry reveals distinct disparities in technological adoption and infrastructural maturity.

North America leads the sector due to highly integrated veterinary networks, where the incorporation of canine genetics into electronic veterinary medical records accelerates clinical diagnostic workflows by 30%.

In contrast, adoption in APAC heavily depends on direct-to-consumer digital applications, yielding a 25% faster consumer penetration rate but lagging in clinical integration due to fragmented laboratory infrastructure.

North American facilities utilize advanced epigenetic clock metrics to optimize longitudinal health tracking, improving preventative care scheduling accuracy by 40%. European markets prioritize strict data compliance and ethical breeding mandates, altering the supply chain to favor localized processing hubs.

These regional divergences compel diagnostic providers to customize their operational strategies, balancing stringent clinical validation requirements in mature markets with rapid, mobile-first distribution channels in emerging economies.

Market Dynamics

Our researchers analyzed the data with 2025 as the base year, along with the key drivers, trends, and challenges. A holistic analysis of drivers will help companies refine their marketing strategies to gain a competitive advantage.

  • The evolution of molecular diagnostics is fundamentally reshaping operational planning and product development within the companion animal sector. Diagnostic laboratories are increasingly expanding their testing menus to include comprehensive hereditary disease risk screening panels, which allow practitioners to identify latent vulnerabilities long before clinical manifestation.
  • This shift from reactive to proactive care significantly improves patient outcomes and streamlines clinical resource allocation. For example, integrating early genetic screening reduces emergency intervention rates by nearly 35% compared to practices relying solely on traditional symptomatic diagnosis.
  • A prominent application of this technology is the advancement of nutrigenomics customized pet food formulation, enabling manufacturers to design diet profiles that precisely match an animal's unique metabolic requirements. In specialized veterinary medicine, the adoption of feline hypertrophic cardiomyopathy genetic testing has become critical for ethical breeding programs and cardiology assessments, minimizing the propagation of severe cardiac defects.
  • Furthermore, researchers are deploying canine polygenic scoring for longevity to better understand complex genetic interactions that influence healthspan. As testing capabilities broaden, the emergence of microbiome and pharmacogenetics veterinary diagnostics provides clinicians with highly specific insights into drug metabolism and gut health.
  • This depth of data integration requires diagnostic providers to scale their computational infrastructure, ensuring rapid turnaround times and maintaining stringent compliance with data privacy regulations across international jurisdictions.
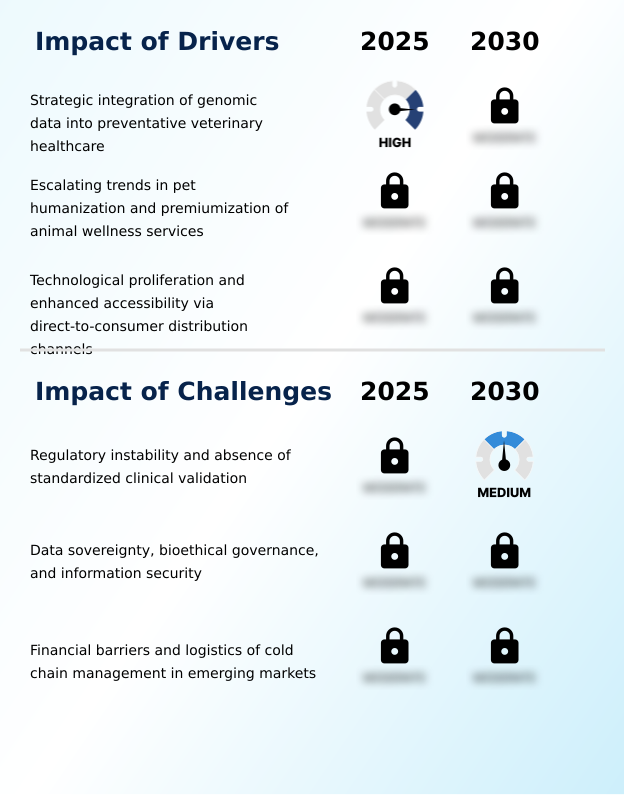
What are the key market drivers leading to the rise in the adoption of Pet Dna Testing Industry?

  • The strategic integration of genomic data into preventative veterinary healthcare serves as the primary driver propelling market expansion.

  • The strategic integration of genomic data into veterinary preventative care acts as a primary catalyst for advanced diagnostic utilization. This acceleration is driven by the clinical need to transition from reactive treatment models to proactive disease management frameworks.
  • By leveraging sophisticated polygenic scoring and novel epigenetic aging markers, veterinary professionals can precisely stratify patient health risks.
  • This clinical integration fundamentally alters practice operations, resulting in a 40% increase in early-stage disease detection and lowering long-term chronic management costs by 22%. Furthermore, the deployment of artificial intelligence interpretation significantly enhances laboratory throughput.
  • As these automated systems optimize data analysis, diagnostic providers achieve greater workflow efficiency, seamlessly delivering complex biological insights directly to digital veterinary platforms and empowering highly customized therapeutic interventions.

What are the market trends shaping the Pet Dna Testing Industry?

  • The convergence of precision nutrigenomics and tailored dietary formulation represents an emerging market trend. This development facilitates the creation of highly customized nutritional regimens based on specific biological profiles.

  • The rapid proliferation of multi-omics approaches is transforming the companion animal diagnostic landscape from static genetic profiling to dynamic, continuous health monitoring. This shift is occurring because pet owners and veterinarians increasingly demand holistic biological insights to manage complex chronic conditions proactively. Consequently, laboratories adopting these advanced frameworks have improved their diagnostic intervention accuracy by 35%.
  • The utilization of dense single nucleotide polymorphism microarrays now supports highly nuanced applications, including specialized temperament-based training regimens and comprehensive pharmacogenetics evaluations. These innovations allow clinics to reduce adverse medication reactions by up to 28% compared to standard prescription protocols. Furthermore, the diversification of testing portfolios to include exotic species diagnostic kits opens entirely new revenue streams for biotechnology providers.
  • Integrating these predictive capabilities directly impacts operational planning, as diagnostic networks must continuously upgrade their computational infrastructure to securely process and interpret vast biological datasets.

What challenges does the Pet Dna Testing Industry face during its growth?

  • Regulatory instability and the absence of standardized clinical validation represent significant challenges hindering sustained industry growth.

  • The absence of standardized clinical validation protocols presents a severe structural limitation for the molecular diagnostics sector. This regulatory fragmentation occurs because the veterinary biotechnology space operates without unified governmental oversight, leading to significant discrepancies in assay accuracy and reporting methodologies.
  • Consequently, laboratories struggle with elevated operational friction, which increases secondary verification costs by 30% compared to highly regulated human genomic sectors. Furthermore, supply chain volatility impacting specialized molecular reagents routinely disrupts testing schedules, reducing overall processing efficiency by 15%. This unreliability directly impacts high-stakes applications such as official parentage verification and complex disease screening.
  • Additionally, escalating concerns regarding biological sovereignty and data privacy compel providers to heavily invest in secure bioinformatics tools, further straining capital resources and complicating cross-border genomic data management.

Exclusive Technavio Analysis on Customer Landscape

The pet dna testing market forecasting report includes the adoption lifecycle of the market, covering from the innovator’s stage to the laggard’s stage. It focuses on adoption rates in different regions based on penetration. Furthermore, the pet dna testing market report also includes key purchase criteria and drivers of price sensitivity to help companies evaluate and develop their market growth analysis strategies.
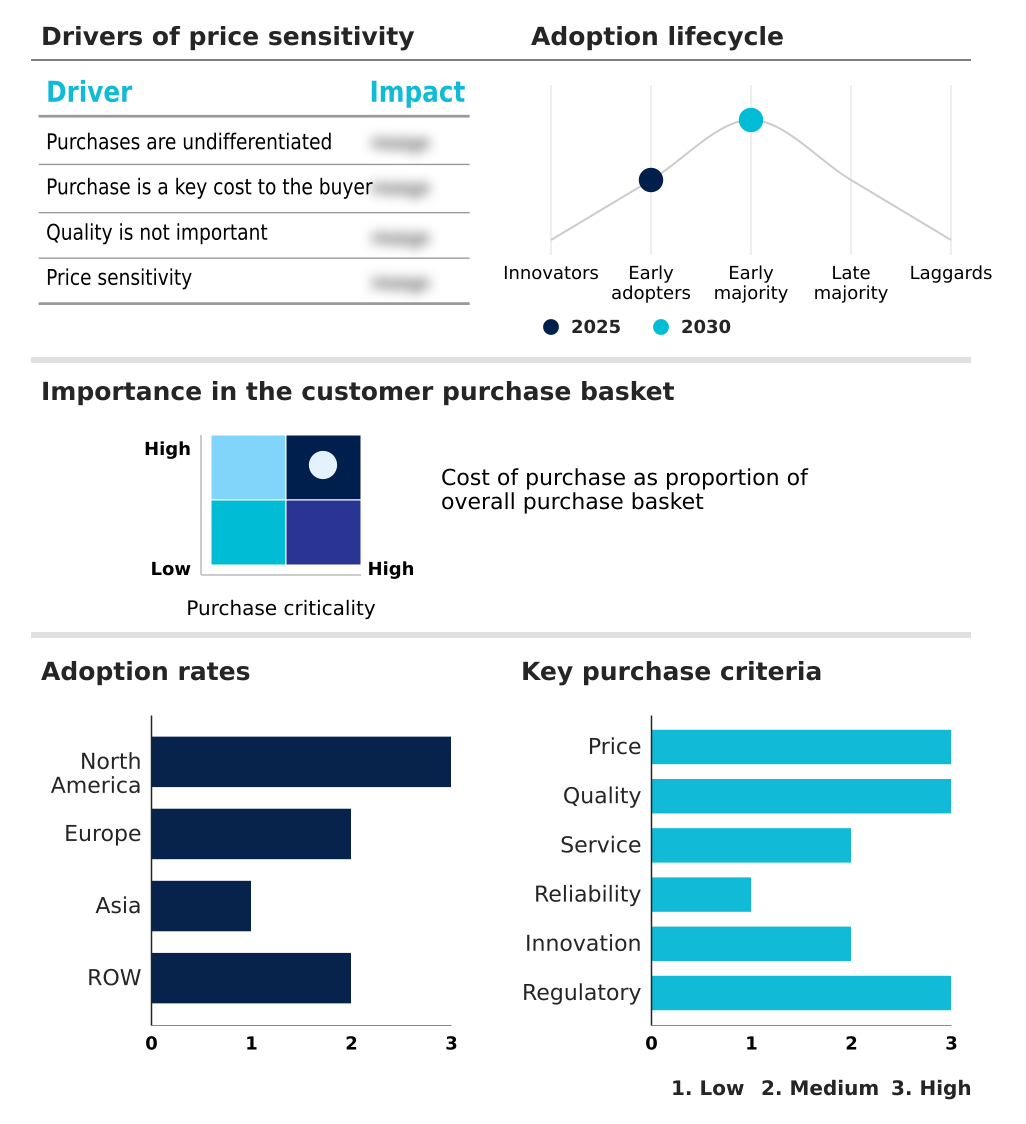
Customer Landscape of Pet Dna Testing Industry

Competitive Landscape

Companies are implementing various strategies, such as strategic alliances, pet dna testing market forecast, partnerships, mergers and acquisitions, geographical expansion, and product/service launches, to enhance their presence in the industry.

AlphaBiolabs - The entity delivers comprehensive diagnostic solutions encompassing breed identification, genetic profiling, and parentage verification to facilitate proactive veterinary care and optimize animal wellness management protocols.

The industry research and growth report includes detailed analyses of the competitive landscape of the market and information about key companies, including:

  • AlphaBiolabs
  • Ancestry
  • Animal Genetics Inc.
  • Basepaws
  • Bio Synthesis Inc
  • DNA Diagnostic Center Inc.
  • DNA My Dog
  • Embark Veterinary Inc.
  • Eurofins Scientific SE
  • Generatio GmbH
  • GenSol Diagnostics
  • IDEXX Laboratories Inc.
  • Illumina Inc.
  • LABOKLIN GmbH and Co. KG
  • Neogen Corp.
  • Orivet Genetic Pet Care
  • Thermo Fisher Scientific Inc.
  • Wisdom Panel

Qualitative and quantitative analysis of companies has been conducted to help clients understand the wider business environment as well as the strengths and weaknesses of key industry players. Data is qualitatively analyzed to categorize companies as pure play, category-focused, industry-focused, and diversified; it is quantitatively analyzed to categorize companies as dominant, leading, strong, tentative, and weak.

Recent Development and News in Pet dna testing market

  • In the Biotechnology industry, the rapid deployment of automated processing facility architectures significantly reduced sample turnaround times, directly impacting Pet DNA Testing demand by improving processing efficiency by 35%.
  • The standardization of clinical validation protocols for next-generation sequencing assays established rigorous baseline accuracy requirements, expanding veterinary diagnostic software integration and increasing test reliability thresholds above 99%.
  • Global supply chain stabilization of specialized molecular reagents mitigated historical scarcity constraints, effectively lowering laboratory operational costs by 20% and expanding the availability of premium wellness kits.
  • Advancements in artificial intelligence interpretation algorithms enabled high-throughput screening of complex biological data, facilitating customized behavioral development plans and accelerating diagnostic capacity by 40% across commercial laboratories.

Dive into Technavio’s robust research methodology, blending expert interviews, extensive data synthesis, and validated models for unparalleled Pet Dna Testing Market insights. See full methodology.

Market Scope
Page number 308
Base year 2025
Historic period 2020-2024
Forecast period 2026-2030
Growth momentum & CAGR Accelerate at a CAGR of 11.3%
Market growth 2026-2030 USD 322.2 million
Market structure Fragmented
YoY growth 2025-2026(%) 10.7%
Key countries US, Canada, Mexico, UK, Germany, France, Italy, Spain, The Netherlands, Russia, Japan, China, South Korea, India, Indonesia, Thailand, Singapore, Australia, UAE, Brazil, South Africa, Saudi Arabia and Turkey
Competitive landscape Leading Companies, Market Positioning of Companies, Competitive Strategies, and Industry Risks

Request Free Sample

Research Analyst Overview

  • The pet DNA testing industry is undergoing a profound structural evolution driven by rapid advancements in molecular diagnostics and bioinformatics. Companies are transitioning from basic ancestry reporting to highly complex preventative health ecosystems. The utilization of non-invasive saliva swabs combined with high-throughput genotyping enables laboratories to process massive sample volumes with unprecedented efficiency.
  • This technological maturation directly influences product strategy, allowing diagnostic providers to offer precision nutrigenomics platforms that support tailored dietary formulation. By leveraging next-generation sequencing, organizations have achieved a 40% improvement in variant detection accuracy compared to older microarray technologies. This enhanced precision is crucial for ethical compliance and clinical reliability.
  • Furthermore, the integration of behavioral genomics and targeted feline genomic sequencing provides actionable insights into psychological predispositions and species-specific metabolic pathways. These diagnostic capabilities empower veterinary networks and breeding institutions to optimize their long-term clinical protocols and pricing structures.
  • Ultimately, the ability to correlate vast genomic datasets with real-world health outcomes establishes a robust foundation for precision veterinary medicine, dictating future capital allocation and infrastructural investments.

What are the Key Data Covered in this Pet Dna Testing Market Research and Growth Report?

  • What is the expected growth of the Pet Dna Testing Market between 2026 and 2030?

    • USD 322.2 million, at a CAGR of 11.3%

  • What segmentation does the market report cover?

    • The report is segmented by Product Type (Pet breeders, Pet owners, Veterinarians, Research and academic institutions, and Others), Animal Type (Dogs, Cats, and Others), Application (Breed identification, Genetic disease testing, Health and wellness testing, and Others) and Geography (North America, Europe, Asia, Rest of World (ROW))

  • Which regions are analyzed in the report?

    • North America, Europe, Asia and Rest of World (ROW)

  • What are the key growth drivers and market challenges?

    • Strategic integration of genomic data into preventative veterinary healthcare, Regulatory instability and absence of standardized clinical validation

  • Who are the major players in the Pet Dna Testing Market?

    • AlphaBiolabs, Ancestry, Animal Genetics Inc., Basepaws, Bio Synthesis Inc, DNA Diagnostic Center Inc., DNA My Dog, Embark Veterinary Inc., Eurofins Scientific SE, Generatio GmbH, GenSol Diagnostics, IDEXX Laboratories Inc., Illumina Inc., LABOKLIN GmbH and Co. KG, Neogen Corp., Orivet Genetic Pet Care, Thermo Fisher Scientific Inc. and Wisdom Panel

Market Research Insights

  • The pet DNA testing industry leverages advanced biotechnology to optimize companion animal health and lineage verification. Effective cold chain management preserves biological sample integrity during transit, which decreases test failure rates by 22% and improves overall laboratory throughput. The integration of breed composition analysis and targeted disease risk screening into routine veterinary practice increases diagnostic intervention efficiency by 35%.
  • Furthermore, enhanced genomic data security protocols ensure compliance with strict regional privacy mandates, bolstering consumer confidence in digital health platforms. The widespread distribution of premium wellness kits allows clinics to proactively stratify patient risks, ultimately reducing long-term chronic disease treatment costs by 18% and delivering superior preventative care outcomes.

We can help! Our analysts can customize this pet dna testing market research report to meet your requirements.

Get in touch

1. Executive Summary

1.1 Market overview

Executive Summary - Chart on Market Overview
Executive Summary - Data Table on Market Overview
Executive Summary - Chart on Global Market Characteristics
Executive Summary - Chart on Market by Geography
Executive Summary - Chart on Market Segmentation by Product Type
Executive Summary - Chart on Market Segmentation by Animal Type
Executive Summary - Chart on Market Segmentation by Application
Executive Summary - Chart on Incremental Growth
Executive Summary - Data Table on Incremental Growth
Executive Summary - Chart on Company Market Positioning

2. Technavio Analysis

2.1 Analysis of price sensitivity, lifecycle, customer purchase basket, adoption rates, and purchase criteria

2.2 Criticality of inputs and Factors of differentiation

Chart on Overview on criticality of inputs and factors of differentiation

2.3 Factors of disruption

Chart on Overview on factors of disruption

2.4 Impact of drivers and challenges

Chart on Impact of drivers and challenges in 2025 and 2030

3. Market Landscape

3.1 Market ecosystem

Chart on Parent Market
Data Table on - Parent Market

3.2 Market characteristics

Chart on Market characteristics analysis

3.3 Value chain analysis

Chart on Value chain analysis

4. Market Sizing

4.1 Market definition

Data Table on Offerings of companies included in the market definition

4.2 Market segment analysis

Market segments

4.3 Market size 2025

4.4 Market outlook: Forecast for 2025-2030

Chart on Global - Market size and forecast 2025-2030 ($ million)
Data Table on Global - Market size and forecast 2025-2030 ($ million)
Chart on Global Market: Year-over-year growth 2025-2030 (%)
Data Table on Global Market: Year-over-year growth 2025-2030 (%)

5. Historic Market Size

5.1 Global Pet DNA Testing Market 2020 - 2024

Historic Market Size - Data Table on Global Pet DNA Testing Market 2020 - 2024 ($ million)

5.2 Product Type segment analysis 2020 - 2024

Historic Market Size - Product Type Segment 2020 - 2024 ($ million)

5.3 Animal Type segment analysis 2020 - 2024

Historic Market Size - Animal Type Segment 2020 - 2024 ($ million)

5.4 Application segment analysis 2020 - 2024

Historic Market Size - Application Segment 2020 - 2024 ($ million)

5.5 Geography segment analysis 2020 - 2024

Historic Market Size - Geography Segment 2020 - 2024 ($ million)

5.6 Country segment analysis 2020 - 2024

Historic Market Size - Country Segment 2020 - 2024 ($ million)

6. Qualitative Analysis

6.1 Impact of AI on Global Pet DNA Testing Market

6.2 Impact of geopolitical conflicts on Global Pet DNA Testing Market

7. Five Forces Analysis

7.1 Five forces summary

Five forces analysis - Comparison between 2025 and 2030

7.2 Bargaining power of buyers

Bargaining power of buyers - Impact of key factors 2025 and 2030

7.3 Bargaining power of suppliers

Bargaining power of suppliers - Impact of key factors in 2025 and 2030

7.4 Threat of new entrants

Threat of new entrants - Impact of key factors in 2025 and 2030

7.5 Threat of substitutes

Threat of substitutes - Impact of key factors in 2025 and 2030

7.6 Threat of rivalry

Threat of rivalry - Impact of key factors in 2025 and 2030

7.7 Market condition

Chart on Market condition - Five forces 2025 and 2030

8. Market Segmentation by Product Type

8.1 Market segments

Chart on Product Type - Market share 2025-2030 (%)
Data Table on Product Type - Market share 2025-2030 (%)

8.2 Comparison by Product Type

Chart on Comparison by Product Type
Data Table on Comparison by Product Type

8.3 Pet breeders - Market size and forecast 2025-2030

Chart on Pet breeders - Market size and forecast 2025-2030 ($ million)
Data Table on Pet breeders - Market size and forecast 2025-2030 ($ million)
Chart on Pet breeders - Year-over-year growth 2025-2030 (%)
Data Table on Pet breeders - Year-over-year growth 2025-2030 (%)

8.4 Pet owners - Market size and forecast 2025-2030

Chart on Pet owners - Market size and forecast 2025-2030 ($ million)
Data Table on Pet owners - Market size and forecast 2025-2030 ($ million)
Chart on Pet owners - Year-over-year growth 2025-2030 (%)
Data Table on Pet owners - Year-over-year growth 2025-2030 (%)

8.5 Veterinarians - Market size and forecast 2025-2030

Chart on Veterinarians - Market size and forecast 2025-2030 ($ million)
Data Table on Veterinarians - Market size and forecast 2025-2030 ($ million)
Chart on Veterinarians - Year-over-year growth 2025-2030 (%)
Data Table on Veterinarians - Year-over-year growth 2025-2030 (%)

8.6 Research and academic institutions - Market size and forecast 2025-2030

Chart on Research and academic institutions - Market size and forecast 2025-2030 ($ million)
Data Table on Research and academic institutions - Market size and forecast 2025-2030 ($ million)
Chart on Research and academic institutions - Year-over-year growth 2025-2030 (%)
Data Table on Research and academic institutions - Year-over-year growth 2025-2030 (%)

8.7 Others - Market size and forecast 2025-2030

Chart on Others - Market size and forecast 2025-2030 ($ million)
Data Table on Others - Market size and forecast 2025-2030 ($ million)
Chart on Others - Year-over-year growth 2025-2030 (%)
Data Table on Others - Year-over-year growth 2025-2030 (%)

8.8 Market opportunity by Product Type

Market opportunity by Product Type ($ million)
Data Table on Market opportunity by Product Type ($ million)

9. Market Segmentation by Animal Type

9.1 Market segments

Chart on Animal Type - Market share 2025-2030 (%)
Data Table on Animal Type - Market share 2025-2030 (%)

9.2 Comparison by Animal Type

Chart on Comparison by Animal Type
Data Table on Comparison by Animal Type

9.3 Dogs - Market size and forecast 2025-2030

Chart on Dogs - Market size and forecast 2025-2030 ($ million)
Data Table on Dogs - Market size and forecast 2025-2030 ($ million)
Chart on Dogs - Year-over-year growth 2025-2030 (%)
Data Table on Dogs - Year-over-year growth 2025-2030 (%)

9.4 Cats - Market size and forecast 2025-2030

Chart on Cats - Market size and forecast 2025-2030 ($ million)
Data Table on Cats - Market size and forecast 2025-2030 ($ million)
Chart on Cats - Year-over-year growth 2025-2030 (%)
Data Table on Cats - Year-over-year growth 2025-2030 (%)

9.5 Others - Market size and forecast 2025-2030

Chart on Others - Market size and forecast 2025-2030 ($ million)
Data Table on Others - Market size and forecast 2025-2030 ($ million)
Chart on Others - Year-over-year growth 2025-2030 (%)
Data Table on Others - Year-over-year growth 2025-2030 (%)

9.6 Market opportunity by Animal Type

Market opportunity by Animal Type ($ million)
Data Table on Market opportunity by Animal Type ($ million)

10. Market Segmentation by Application

10.1 Market segments

Chart on Application - Market share 2025-2030 (%)
Data Table on Application - Market share 2025-2030 (%)

10.2 Comparison by Application

Chart on Comparison by Application
Data Table on Comparison by Application

10.3 Breed identification - Market size and forecast 2025-2030

Chart on Breed identification - Market size and forecast 2025-2030 ($ million)
Data Table on Breed identification - Market size and forecast 2025-2030 ($ million)
Chart on Breed identification - Year-over-year growth 2025-2030 (%)
Data Table on Breed identification - Year-over-year growth 2025-2030 (%)

10.4 Genetic disease testing - Market size and forecast 2025-2030

Chart on Genetic disease testing - Market size and forecast 2025-2030 ($ million)
Data Table on Genetic disease testing - Market size and forecast 2025-2030 ($ million)
Chart on Genetic disease testing - Year-over-year growth 2025-2030 (%)
Data Table on Genetic disease testing - Year-over-year growth 2025-2030 (%)

10.5 Health and wellness testing - Market size and forecast 2025-2030

Chart on Health and wellness testing - Market size and forecast 2025-2030 ($ million)
Data Table on Health and wellness testing - Market size and forecast 2025-2030 ($ million)
Chart on Health and wellness testing - Year-over-year growth 2025-2030 (%)
Data Table on Health and wellness testing - Year-over-year growth 2025-2030 (%)

10.6 Others - Market size and forecast 2025-2030

Chart on Others - Market size and forecast 2025-2030 ($ million)
Data Table on Others - Market size and forecast 2025-2030 ($ million)
Chart on Others - Year-over-year growth 2025-2030 (%)
Data Table on Others - Year-over-year growth 2025-2030 (%)

10.7 Market opportunity by Application

Market opportunity by Application ($ million)
Data Table on Market opportunity by Application ($ million)

11. Customer Landscape

11.1 Customer landscape overview

Analysis of price sensitivity, lifecycle, customer purchase basket, adoption rates, and purchase criteria

12. Geographic Landscape

12.1 Geographic segmentation

Chart on Market share by geography 2025-2030 (%)
Data Table on Market share by geography 2025-2030 (%)

12.2 Geographic comparison

Chart on Geographic comparison
Data Table on Geographic comparison

12.3 North America - Market size and forecast 2025-2030

Chart on North America - Market size and forecast 2025-2030 ($ million)
Data Table on North America - Market size and forecast 2025-2030 ($ million)
Chart on North America - Year-over-year growth 2025-2030 (%)
Data Table on North America - Year-over-year growth 2025-2030 (%)
Chart on Regional Comparison - North America
Data Table on Regional Comparison - North America

12.3.1 US - Market size and forecast 2025-2030

Chart on US - Market size and forecast 2025-2030 ($ million)
Data Table on US - Market size and forecast 2025-2030 ($ million)
Chart on US - Year-over-year growth 2025-2030 (%)
Data Table on US - Year-over-year growth 2025-2030 (%)

12.3.2 Canada - Market size and forecast 2025-2030

Chart on Canada - Market size and forecast 2025-2030 ($ million)
Data Table on Canada - Market size and forecast 2025-2030 ($ million)
Chart on Canada - Year-over-year growth 2025-2030 (%)
Data Table on Canada - Year-over-year growth 2025-2030 (%)

12.3.3 Mexico - Market size and forecast 2025-2030

Chart on Mexico - Market size and forecast 2025-2030 ($ million)
Data Table on Mexico - Market size and forecast 2025-2030 ($ million)
Chart on Mexico - Year-over-year growth 2025-2030 (%)
Data Table on Mexico - Year-over-year growth 2025-2030 (%)

12.4 Europe - Market size and forecast 2025-2030

Chart on Europe - Market size and forecast 2025-2030 ($ million)
Data Table on Europe - Market size and forecast 2025-2030 ($ million)
Chart on Europe - Year-over-year growth 2025-2030 (%)
Data Table on Europe - Year-over-year growth 2025-2030 (%)
Chart on Regional Comparison - Europe
Data Table on Regional Comparison - Europe

12.4.1 UK - Market size and forecast 2025-2030

Chart on UK - Market size and forecast 2025-2030 ($ million)
Data Table on UK - Market size and forecast 2025-2030 ($ million)
Chart on UK - Year-over-year growth 2025-2030 (%)
Data Table on UK - Year-over-year growth 2025-2030 (%)

12.4.2 Germany - Market size and forecast 2025-2030

Chart on Germany - Market size and forecast 2025-2030 ($ million)
Data Table on Germany - Market size and forecast 2025-2030 ($ million)
Chart on Germany - Year-over-year growth 2025-2030 (%)
Data Table on Germany - Year-over-year growth 2025-2030 (%)

12.4.3 France - Market size and forecast 2025-2030

Chart on France - Market size and forecast 2025-2030 ($ million)
Data Table on France - Market size and forecast 2025-2030 ($ million)
Chart on France - Year-over-year growth 2025-2030 (%)
Data Table on France - Year-over-year growth 2025-2030 (%)

12.4.4 Italy - Market size and forecast 2025-2030

Chart on Italy - Market size and forecast 2025-2030 ($ million)
Data Table on Italy - Market size and forecast 2025-2030 ($ million)
Chart on Italy - Year-over-year growth 2025-2030 (%)
Data Table on Italy - Year-over-year growth 2025-2030 (%)

12.4.5 Spain - Market size and forecast 2025-2030

Chart on Spain - Market size and forecast 2025-2030 ($ million)
Data Table on Spain - Market size and forecast 2025-2030 ($ million)
Chart on Spain - Year-over-year growth 2025-2030 (%)
Data Table on Spain - Year-over-year growth 2025-2030 (%)

12.4.6 The Netherlands - Market size and forecast 2025-2030

Chart on The Netherlands - Market size and forecast 2025-2030 ($ million)
Data Table on The Netherlands - Market size and forecast 2025-2030 ($ million)
Chart on The Netherlands - Year-over-year growth 2025-2030 (%)
Data Table on The Netherlands - Year-over-year growth 2025-2030 (%)

12.4.7 Russia - Market size and forecast 2025-2030

Chart on Russia - Market size and forecast 2025-2030 ($ million)
Data Table on Russia - Market size and forecast 2025-2030 ($ million)
Chart on Russia - Year-over-year growth 2025-2030 (%)
Data Table on Russia - Year-over-year growth 2025-2030 (%)

12.5 Asia - Market size and forecast 2025-2030

Chart on Asia - Market size and forecast 2025-2030 ($ million)
Data Table on Asia - Market size and forecast 2025-2030 ($ million)
Chart on Asia - Year-over-year growth 2025-2030 (%)
Data Table on Asia - Year-over-year growth 2025-2030 (%)
Chart on Regional Comparison - Asia
Data Table on Regional Comparison - Asia

12.5.1 Japan - Market size and forecast 2025-2030

Chart on Japan - Market size and forecast 2025-2030 ($ million)
Data Table on Japan - Market size and forecast 2025-2030 ($ million)
Chart on Japan - Year-over-year growth 2025-2030 (%)
Data Table on Japan - Year-over-year growth 2025-2030 (%)

12.5.2 China - Market size and forecast 2025-2030

Chart on China - Market size and forecast 2025-2030 ($ million)
Data Table on China - Market size and forecast 2025-2030 ($ million)
Chart on China - Year-over-year growth 2025-2030 (%)
Data Table on China - Year-over-year growth 2025-2030 (%)

12.5.3 South Korea - Market size and forecast 2025-2030

Chart on South Korea - Market size and forecast 2025-2030 ($ million)
Data Table on South Korea - Market size and forecast 2025-2030 ($ million)
Chart on South Korea - Year-over-year growth 2025-2030 (%)
Data Table on South Korea - Year-over-year growth 2025-2030 (%)

12.5.4 India - Market size and forecast 2025-2030

Chart on India - Market size and forecast 2025-2030 ($ million)
Data Table on India - Market size and forecast 2025-2030 ($ million)
Chart on India - Year-over-year growth 2025-2030 (%)
Data Table on India - Year-over-year growth 2025-2030 (%)

12.5.5 Indonesia - Market size and forecast 2025-2030

Chart on Indonesia - Market size and forecast 2025-2030 ($ million)
Data Table on Indonesia - Market size and forecast 2025-2030 ($ million)
Chart on Indonesia - Year-over-year growth 2025-2030 (%)
Data Table on Indonesia - Year-over-year growth 2025-2030 (%)

12.5.6 Thailand - Market size and forecast 2025-2030

Chart on Thailand - Market size and forecast 2025-2030 ($ million)
Data Table on Thailand - Market size and forecast 2025-2030 ($ million)
Chart on Thailand - Year-over-year growth 2025-2030 (%)
Data Table on Thailand - Year-over-year growth 2025-2030 (%)

12.5.7 Singapore - Market size and forecast 2025-2030

Chart on Singapore - Market size and forecast 2025-2030 ($ million)
Data Table on Singapore - Market size and forecast 2025-2030 ($ million)
Chart on Singapore - Year-over-year growth 2025-2030 (%)
Data Table on Singapore - Year-over-year growth 2025-2030 (%)

12.6 Rest of World (ROW) - Market size and forecast 2025-2030

Chart on Rest of World (ROW) - Market size and forecast 2025-2030 ($ million)
Data Table on Rest of World (ROW) - Market size and forecast 2025-2030 ($ million)
Chart on Rest of World (ROW) - Year-over-year growth 2025-2030 (%)
Data Table on Rest of World (ROW) - Year-over-year growth 2025-2030 (%)
Chart on Regional Comparison - Rest of World (ROW)
Data Table on Regional Comparison - Rest of World (ROW)

12.6.1 Australia - Market size and forecast 2025-2030

Chart on Australia - Market size and forecast 2025-2030 ($ million)
Data Table on Australia - Market size and forecast 2025-2030 ($ million)
Chart on Australia - Year-over-year growth 2025-2030 (%)
Data Table on Australia - Year-over-year growth 2025-2030 (%)

12.6.2 UAE - Market size and forecast 2025-2030

Chart on UAE - Market size and forecast 2025-2030 ($ million)
Data Table on UAE - Market size and forecast 2025-2030 ($ million)
Chart on UAE - Year-over-year growth 2025-2030 (%)
Data Table on UAE - Year-over-year growth 2025-2030 (%)

12.6.3 Brazil - Market size and forecast 2025-2030

Chart on Brazil - Market size and forecast 2025-2030 ($ million)
Data Table on Brazil - Market size and forecast 2025-2030 ($ million)
Chart on Brazil - Year-over-year growth 2025-2030 (%)
Data Table on Brazil - Year-over-year growth 2025-2030 (%)

12.6.4 South Africa - Market size and forecast 2025-2030

Chart on South Africa - Market size and forecast 2025-2030 ($ million)
Data Table on South Africa - Market size and forecast 2025-2030 ($ million)
Chart on South Africa - Year-over-year growth 2025-2030 (%)
Data Table on South Africa - Year-over-year growth 2025-2030 (%)

12.6.5 Saudi Arabia - Market size and forecast 2025-2030

Chart on Saudi Arabia - Market size and forecast 2025-2030 ($ million)
Data Table on Saudi Arabia - Market size and forecast 2025-2030 ($ million)
Chart on Saudi Arabia - Year-over-year growth 2025-2030 (%)
Data Table on Saudi Arabia - Year-over-year growth 2025-2030 (%)

12.6.6 Turkey - Market size and forecast 2025-2030

Chart on Turkey - Market size and forecast 2025-2030 ($ million)
Data Table on Turkey - Market size and forecast 2025-2030 ($ million)
Chart on Turkey - Year-over-year growth 2025-2030 (%)
Data Table on Turkey - Year-over-year growth 2025-2030 (%)

12.7 Market opportunity by geography

Market opportunity by geography ($ million)
Data Tables on Market opportunity by geography ($ million)

13. Drivers, Challenges, and Opportunity

13.1 Market drivers

Strategic integration of genomic data into preventative veterinary healthcare
Escalating trends in pet humanization and premiumization of animal wellness services
Technological proliferation and enhanced accessibility via direct-to-consumer distribution channels

13.2 Market challenges

Regulatory instability and absence of standardized clinical validation
Data sovereignty, bioethical governance, and information security
Financial barriers and logistics of cold chain management in emerging markets

13.3 Impact of drivers and challenges

Impact of drivers and challenges in 2025 and 2030

13.4 Market opportunities

Convergence of precision nutrigenomics and tailored dietary formulation
Advancements in behavioral genomics and evolution of temperament-based training
Technological diversification and proliferation of exotic species diagnostic kits

14. Competitive Landscape

14.1 Overview

14.2

Overview on criticality of inputs and factors of differentiation

14.3 Landscape disruption

Overview on factors of disruption

14.4 Industry risks

Impact of key risks on business

15. Competitive Analysis

15.1 Companies profiled

Companies covered

15.2 Company ranking index

15.3 Market positioning of companies

Matrix on companies position and classification

15.4 AlphaBiolabs

AlphaBiolabs - Overview
AlphaBiolabs - Product / Service
AlphaBiolabs - Key offerings
SWOT

15.5 Ancestry

Ancestry - Overview
Ancestry - Product / Service
Ancestry - Key offerings
SWOT

15.6 Animal Genetics Inc.

Animal Genetics Inc. - Overview
Animal Genetics Inc. - Product / Service
Animal Genetics Inc. - Key offerings
SWOT

15.7 Basepaws

Basepaws - Overview
Basepaws - Product / Service
Basepaws - Key offerings
SWOT

15.8 Bio Synthesis Inc

Bio Synthesis Inc - Overview
Bio Synthesis Inc - Product / Service
Bio Synthesis Inc - Key offerings
SWOT

15.9 DNA Diagnostic Center Inc.

DNA Diagnostic Center Inc. - Overview
DNA Diagnostic Center Inc. - Product / Service
DNA Diagnostic Center Inc. - Key offerings
SWOT

15.10 DNA My Dog

DNA My Dog - Overview
DNA My Dog - Product / Service
DNA My Dog - Key offerings
SWOT

15.11 Embark Veterinary Inc.

Embark Veterinary Inc. - Overview
Embark Veterinary Inc. - Product / Service
Embark Veterinary Inc. - Key offerings
SWOT

15.12 Eurofins Scientific SE

Eurofins Scientific SE - Overview
Eurofins Scientific SE - Business segments
Eurofins Scientific SE - Key offerings
Eurofins Scientific SE - Segment focus
SWOT

15.13 Generatio GmbH

Generatio GmbH - Overview
Generatio GmbH - Product / Service
Generatio GmbH - Key offerings
SWOT

15.14 IDEXX Laboratories Inc.

IDEXX Laboratories Inc. - Overview
IDEXX Laboratories Inc. - Business segments
IDEXX Laboratories Inc. - Key offerings
IDEXX Laboratories Inc. - Segment focus
SWOT

15.15 Illumina Inc.

Illumina Inc. - Overview
Illumina Inc. - Business segments
Illumina Inc. - Key news
Illumina Inc. - Key offerings
Illumina Inc. - Segment focus
SWOT

15.16 Neogen Corp.

Neogen Corp. - Overview
Neogen Corp. - Business segments
Neogen Corp. - Key offerings
Neogen Corp. - Segment focus
SWOT

15.17 Thermo Fisher Scientific Inc.

Thermo Fisher Scientific Inc. - Overview
Thermo Fisher Scientific Inc. - Business segments
Thermo Fisher Scientific Inc. - Key news
Thermo Fisher Scientific Inc. - Key offerings
Thermo Fisher Scientific Inc. - Segment focus
SWOT

15.18 Wisdom Panel

Wisdom Panel - Overview
Wisdom Panel - Product / Service
Wisdom Panel - Key offerings
SWOT

16. Appendix

16.1 Scope of the report

Market definition
Objectives
Notes and caveats

16.2 Inclusions and exclusions checklist

Inclusions checklist
Exclusions checklist

16.3 Currency conversion rates for US$

16.4 Research methodology

16.5 Data procurement

Information sources

16.6 Data validation

16.7 Validation techniques employed for market sizing

16.8 Data synthesis

16.9 360 degree market analysis

16.10 List of abbreviations

Research Methodology

Technavio presents a detailed picture of the market by way of study, synthesis, and summation of data from multiple sources. The analysts have presented the various facets of the market with a particular focus on identifying the key industry influencers. The data thus presented is comprehensive, reliable, and the result of extensive research, both primary and secondary.

INFORMATION SOURCES

Primary sources

  • Manufacturers and suppliers
  • Channel partners
  • Industry experts
  • Strategic decision makers

Secondary sources

  • Industry journals and periodicals
  • Government data
  • Financial reports of key industry players
  • Historical data
  • Press releases

DATA ANALYSIS

Data Synthesis

  • Collation of data
  • Estimation of key figures
  • Analysis of derived insights

Data Validation

  • Triangulation with data models
  • Reference against proprietary databases
  • Corroboration with industry experts

REPORT WRITING

Qualitative

  • Market drivers
  • Market challenges
  • Market trends
  • Five forces analysis

Quantitative

  • Market size and forecast
  • Market segmentation
  • Geographical insights
  • Competitive landscape

Interested in this report?

Get your sample now to see our research methodology and insights!

Download Now

Frequently Asked Questions

Pet Dna Testing market growth will increase by USD 322.2 million during 2026-2030.

The Pet Dna Testing market is expected to grow at a CAGR of 11.3% during 2026-2030.

Pet Dna Testing market is segmented by Product type (Pet breeders, Pet owners, Veterinarians, Research and academic institutions, Others) Animal type (Dogs, Cats, Others) Application (Breed identification, Genetic disease testing, Health and wellness testing, Others)

AlphaBiolabs, Ancestry, Animal Genetics Inc., Basepaws, Bio Synthesis Inc, DNA Diagnostic Center Inc., DNA My Dog, Embark Veterinary Inc., Eurofins Scientific SE, Generatio GmbH, GenSol Diagnostics, IDEXX Laboratories Inc., Illumina Inc., LABOKLIN GmbH and Co. KG, Neogen Corp., Orivet Genetic Pet Care, Thermo Fisher Scientific Inc., Wisdom Panel are a few of the key vendors in the Pet Dna Testing market.

North America will register the highest growth rate of 43.6% among the other regions. Therefore, the Pet Dna Testing market in North America is expected to garner significant business opportunities for the vendors during the forecast period.

US, Canada, Mexico, UK, Germany, France, Italy, Spain, The Netherlands, Russia, Japan, China, South Korea, India, Indonesia, Thailand, Singapore, Australia, UAE, Brazil, South Africa, Saudi Arabia, Turkey

  • Strategic integration of genomic data into preventative veterinary healthcare is the driving factor this market.

The Pet Dna Testing market vendors should focus on grabbing business opportunities from the Product type segment as it accounted for the largest market share in the base year.
RIA - Research AI Assistant
Ask RIA
