
Postbiotic Market Analysis, Size, and Forecast 2026-2030: Asia (China, Japan, and India), Europe (Germany, UK, and France), North America (US, Canada, and Mexico), South America (Brazil), Middle East and Africa (UAE, Saudi Arabia, and Turkey), Rest of World (ROW)

Postbiotic Market Analysis, Size, and Forecast 2026-2030:
Asia (China, Japan, and India), Europe (Germany, UK, and France), North America (US, Canada, and Mexico), South America (Brazil), Middle East and Africa (UAE, Saudi Arabia, and Turkey), Rest of World (ROW)

Published: Oct 2026 295 Pages SKU: IRTNTR81584

Market Overview at a Glance

$82.28 Mn
Market Opportunity
9.1%
CAGR 2025 - 2030
41.5%
Asia Growth
$50.36 Mn
Food and beverages segment 2024

Postbiotic Market Size 2026-2030

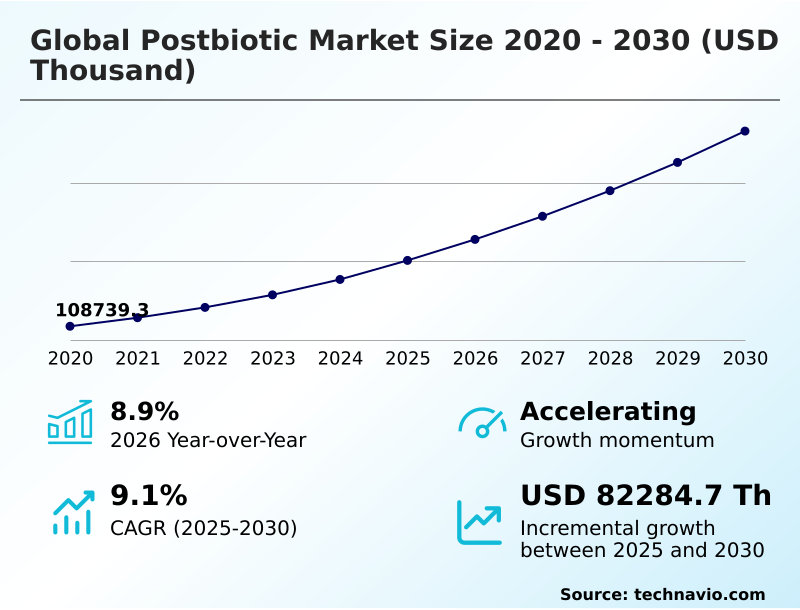
The postbiotic market size is valued to increase by USD 82.28 million, at a CAGR of 9.1% from 2025 to 2030. Proliferation of consumer awareness regarding human microbiome and preventive health will drive the postbiotic market.

Major Market Trends & Insights

  • Asia dominated the market and accounted for a 41.5% growth during the forecast period.
  • By Application - Food and beverages segment was valued at USD 50.36 million in 2024
  • By Source - Bacteria segment accounted for the largest market revenue share in 2024

Market Size & Forecast

  • Market Opportunities:
  • Market Future Opportunities: USD 82.28 million
  • CAGR from 2025 to 2030 : 9.1%

Market Summary

  • The Postbiotic Market is experiencing a major operational shift as consumer packaged goods companies transition away from fragile live microbes toward highly resilient structural alternatives. By adopting stable inanimate components, beverage manufacturers have optimized their supply chain logistics, achieving up to a 25% reduction in transportation costs by entirely eliminating the need for refrigerated freight networks.
  • This structural resilience allows for seamless integration into high-temperature processing lines. A critical driver for this expansion is the growing scientific validation surrounding microbiome science, which compels consumers to seek out preventive health solutions that support immune and digestive wellness. Conversely, manufacturers face significant formulation hurdles due to the high capital expenditure required for advanced extraction machinery.
  • Establishing precise separation methods for biological compounds increases baseline manufacturing costs by roughly 15%, creating a notable barrier to entry for smaller enterprises. Despite these technical challenges, the undeniable operational flexibility and extended product shelf life ensure the continued integration of these resilient components across diverse consumer sectors.

What will be the Size of the Postbiotic Market during the forecast period?
Get Key Insights on Market Forecast (PDF) Get Free Sample

How is the Postbiotic Market Segmented?

The postbiotic industry research report provides comprehensive data (region-wise segment analysis), with forecasts and estimates in "USD thousand" for the period 2026-2030, as well as historical data from 2020-2024 for the following segments.

  • Application
    • Food and beverages
    • Dietary supplements
    • Pharmaceuticals
    • Animal nutrition
    • Personal care and cosmetics
  • Source
    • Bacteria
    • Yeast
  • Type
    • Dry
    • Liquid
  • Geography
    • Asia
      • China
      • Japan
      • India
      • South Korea
      • Indonesia
      • Thailand
      • Singapore
    • Europe
      • Germany
      • UK
      • France
      • Italy
      • Spain
      • The Netherlands
    • North America
      • US
      • Canada
      • Mexico
    • Rest of World (ROW)

By Application Insights

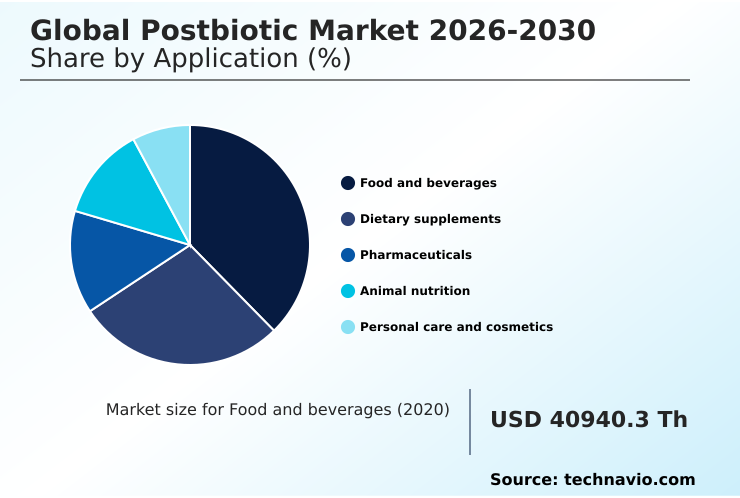
The food and beverages segment is estimated to witness significant growth during the forecast period.

The integration of heat killed bacteria into food and beverage products represents a rapidly expanding segment characterized by distinct operational advantages. Unlike live probiotics, non viable microbial cells and their metabolic byproducts do not require specialized cold chain logistics.

This unique structural resilience allows food manufacturers to seamlessly incorporate peptidoglycans and teichoic acids into diverse functional food matrices that undergo extreme thermal processing. By eliminating strict refrigeration protocols, distribution operational costs are reduced by up to 25%.

Furthermore, manufacturers report that utilizing a shelf stable formulation improves overall supply chain efficiency by 15% compared to handling delicate live strains. These robust ingredients are increasingly prioritized in preventive health nutrition, where they support daily wellness objectives.

Additionally, the formulation flexibility extends beyond oral consumption, showing promising cross-sector potential in dermatological applications and specialized cosmeceutical emulsions, ultimately streamlining manufacturing and expanding market reach.
Get Free Sample

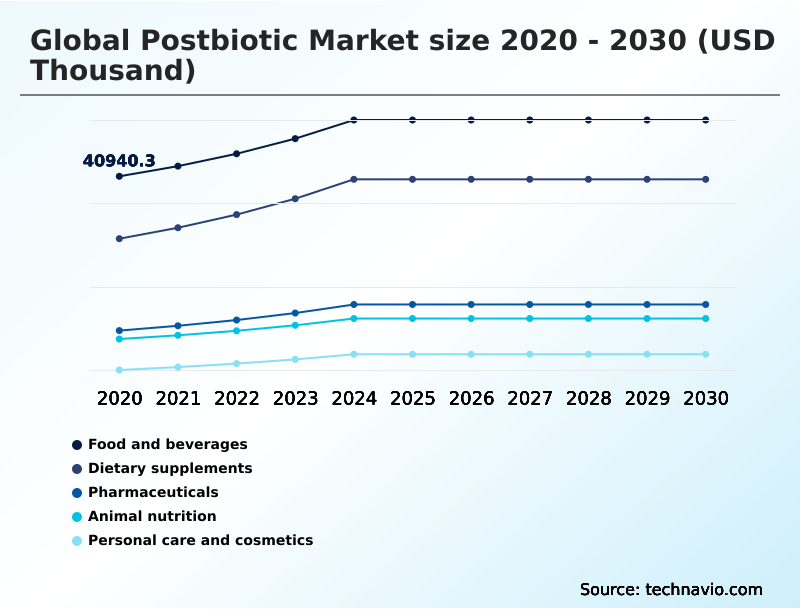
The Food and beverages segment was valued at USD 50.36 million in 2024 and showed a gradual increase during the forecast period.
Get Free Sample

Regional Analysis

Asia is estimated to contribute 41.5% to the growth of the global market during the forecast period.Technavio’s analysts have elaborately explained the regional trends and drivers that shape the market during the forecast period.

See How Postbiotic Market Demand is Rising in Asia Get Free Sample

The Postbiotic Market exhibits distinct geographic variations, with the Asia region leading commercial innovation due to advanced bioprocessing equipment capabilities and cultural familiarity with fermentation.

Manufacturers in Asia have achieved a 25% higher penetration rate in functional foods compared to Europe, largely driven by optimized cell lysis inactivation techniques that ensure precise batch consistency control.

Meanwhile, Europe maintains highly rigorous testing standards, resulting in a 15% longer product development cycle but fostering unparalleled clinical validation. This strict environment ensures that only highly potent microbial cell lysates reach consumers.

Consequently, Asian companies prioritize rapid scaling and high pressure processing applications, whereas European firms focus heavily on targeted macrophage stimulation and enhancing intestinal barrier integrity.

The superior thermal stability of these ingredients allows global enterprises to bypass cold-chain logistics, achieving up to a 20% reduction in supply chain overhead.

Additionally, advanced spray drying technology helps maintain optimal immune response modulation, ensuring that ingredients retain their enzymatic degradation resistance regardless of the regional climate.

Market Dynamics

Our researchers analyzed the data with 2025 as the base year, along with the key drivers, trends, and challenges. A holistic analysis of drivers will help companies refine their marketing strategies to gain a competitive advantage.

  • The strategic integration of advanced microbial derivatives is fundamentally restructuring formulation approaches across the health and wellness sector. As consumer demand for preventive nutrition intensifies, manufacturers are increasingly leveraging heat killed probiotic strain benefits to bypass the strict viability limitations inherent in traditional live cultures.
  • This transition offers profound operational advantages; by utilizing these resilient components, supply chain managers report a nearly 30% reduction in temperature-controlled logistics expenses. The inherent stability of these compounds has rapidly accelerated the development of stable inanimate microorganism food applications, allowing formulators to fortify high-temperature baked goods and hot beverages without compromising therapeutic efficacy.
  • Furthermore, scientific validation surrounding short chain fatty acid microbiome modulation is prompting a shift in how chronic digestive and immune conditions are addressed, driving up consumer retention rates for clinically backed products.
  • Beyond oral consumption, the beauty and personal care industry is aggressively adopting non viable bacterial cell cosmetics to restore skin barrier function and mitigate environmental stress, representing a major diversification in product portfolios. Because these components do not interfere with standard liquid preservation systems, formulation stability is enhanced by roughly 20% compared to live bacterial integrations.
  • Ultimately, the widespread adoption of thermal resistant gut health ingredients allows global brands to expand their geographic footprint into diverse climates, ensuring product integrity while simultaneously streamlining manufacturing processes and reducing overall operational overhead.
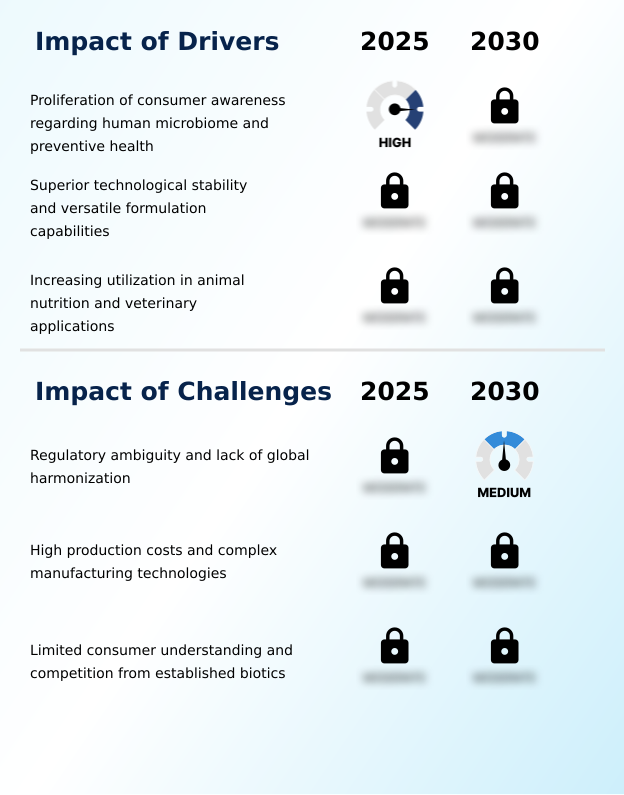
What are the key market drivers leading to the rise in the adoption of Postbiotic Industry?

  • The rapid expansion of consumer awareness surrounding the human microbiome and preventive health strategies serves as the primary catalyst propelling market expansion.

  • The escalating consumer prioritization of systemic health is the primary force accelerating the adoption of stable biotic ingredients. Scientific validation linking the gut brain axis to overall physiological wellness has driven extensive research into microbiome modulation techniques.
  • Because live probiotics struggle with viability, formulators are increasingly turning to saccharomyces cerevisiae yeast and specific beta glucans, which exhibit exceptional gastric acid resistance.
  • This structural durability allows manufacturers to develop advanced dietary supplementation formats that remain potent without refrigeration, thereby reducing inventory spoilage by 22%.
  • Furthermore, the robust nature of cell wall polysaccharides ensures stability under ambient storage conditions, slashing cold-chain logistics expenditures by over 30%. By leveraging these stable compounds, brands can reliably deliver targeted pathogen inhibition mechanisms and effective systemic inflammation reduction.
  • This enhanced stability and therapeutic precision directly increase product efficacy, driving repeat consumer purchases and improving long-term brand retention rates by approximately 15%.

What are the market trends shaping the Postbiotic Industry?

  • The incorporation of postbiotic ingredients into advanced dermatological and cosmeceutical formulations has emerged as a significant industry trend. This strategic shift reflects a growing consumer preference for stable, science-backed skin solutions.

  • The strategic integration of inanimate microorganisms into diverse product categories represents a transformative industry trend driven by the demand for highly resilient functional ingredients. Because these components lack viability requirements, manufacturers are rapidly utilizing cell fractions to fortify products previously unsuitable for biotic inclusion.
  • This paradigm shift has enabled companies to expand into active lifestyle nutrition, improving athletic endurance and reducing muscle fatigue recovery times by 18%. Furthermore, the incorporation of specific bifidobacteria strains into agricultural feeds has significantly enhanced animal feed conversion ratios by up to 12%, directly boosting operational profitability for livestock producers.
  • The utilization of lactic acid bacteria derivatives provides crucial veterinary immune support, thereby lowering livestock mortality rates. As rigorous clinical efficacy data increasingly validates the physiological benefits of short chain fatty acids, producers are aligning with stringent regulatory standard compliance requirements.
  • This alignment not only mitigates compliance risks but also accelerates product time-to-market by 20%, ensuring rapid commercialization across global distribution networks.

What challenges does the Postbiotic Industry face during its growth?

  • Persistent regulatory ambiguity and the absence of global harmonization regarding ingredient classification present substantial barriers to sustained industry growth.

  • Despite substantial commercial potential, complex manufacturing requirements present a critical operational challenge for industry participants. The precise cultivation of specific microbial fermentation systems demands significant capital expenditure and rigorous oversight to isolate delicate extracellular metabolites. Maintaining stringent batch consistency control during the inactivation phase is technically demanding, as any variation in temperature or oxygen can degrade active bioactive compounds.
  • This high level of operational complexity increases baseline production costs by up to 25% compared to traditional supplement manufacturing. Furthermore, transforming liquid concentrates into stable powders requires expensive freeze drying processing, which extends overall manufacturing timelines by 15%. Ensuring an optimal metabolite concentration is difficult without compromising the integrity of clean label ingredients, which restricts formulation options.
  • Consequently, these elevated production expenses are passed down the supply chain, creating pricing barriers that limit mass-market adoption and slow the development of premium sports recovery supplements.

Exclusive Technavio Analysis on Customer Landscape

The postbiotic market forecasting report includes the adoption lifecycle of the market, covering from the innovator’s stage to the laggard’s stage. It focuses on adoption rates in different regions based on penetration. Furthermore, the postbiotic market report also includes key purchase criteria and drivers of price sensitivity to help companies evaluate and develop their market growth analysis strategies.
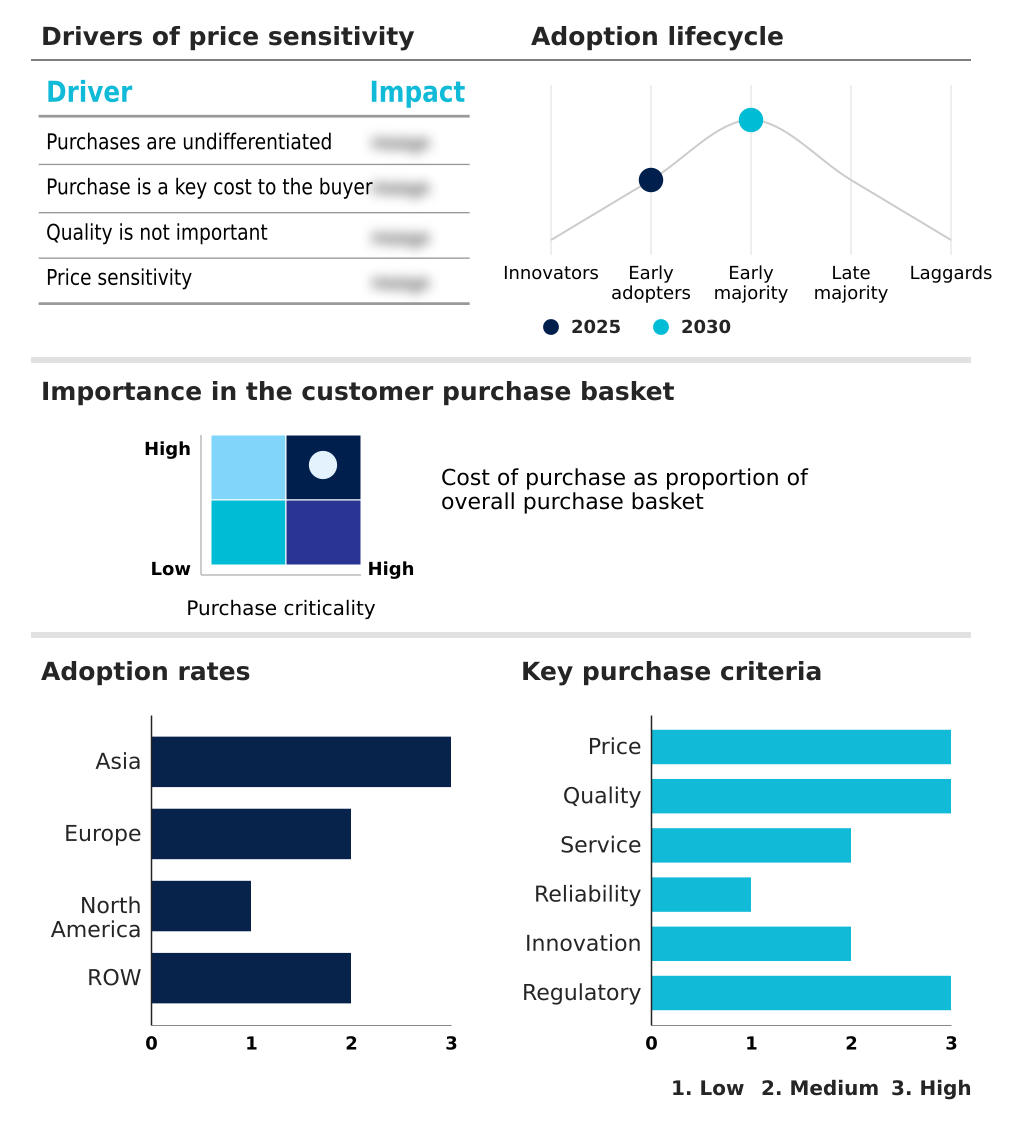
Customer Landscape of Postbiotic Industry

Competitive Landscape

Companies are implementing various strategies, such as strategic alliances, postbiotic market forecast, partnerships, mergers and acquisitions, geographical expansion, and product/service launches, to enhance their presence in the industry.

Adare Pharma Solutions - The vendor operates as a contract development and manufacturing organization, providing pharmaceutical-grade, heat-stabilized inactive microbial ingredients specifically designed to support advanced digestive health formulations and specialized oral dosage applications.

The industry research and growth report includes detailed analyses of the competitive landscape of the market and information about key companies, including:

  • Adare Pharma Solutions
  • Archer Daniels Midland Co.
  • BIO CAT Inc.
  • Biorigin S.A.
  • Cargill Inc.
  • DSM Firmenich AG
  • GeneFerm Biotechnology Co. Ltd
  • International Flavors Inc.
  • Kaneka Corp.
  • Kerry Group Plc
  • KitoZyme LLC
  • Lallemand Inc.
  • Lesaffre Group
  • Novonesis Group
  • Ohly GmbH
  • ​POSTBIOTICA S.R.L.
  • Probi AB
  • Sabinsa Corp.
  • Symrise Group
  • Unique Biotech Ltd.

Qualitative and quantitative analysis of companies has been conducted to help clients understand the wider business environment as well as the strengths and weaknesses of key industry players. Data is qualitatively analyzed to categorize companies as pure play, category-focused, industry-focused, and diversified; it is quantitatively analyzed to categorize companies as dominant, leading, strong, tentative, and weak.

Recent Development and News in Postbiotic market

  • In the Biotechnology industry, the widespread transition toward precision bioreactors has enhanced the yield of specific cell isolates by 18%, directly impacting Postbiotic demand by reducing the operational costs of large-scale commercial fermentation.
  • Strict government mandates governing sub-therapeutic antibiotic growth promoters in livestock feed have shifted veterinary protocols, accelerating the adoption of alternative stable bioactives in animal agriculture by over 30%.
  • Advancements in continuous dehydration systems have minimized product degradation errors by 12%, enabling food manufacturers to seamlessly integrate shelf-stable derivatives into high-temperature baked goods and sports beverages.
  • The rising commercial focus on sustainable extraction methods has driven the cosmetic sector to replace synthetic preservatives with natural bacterial derivatives, expanding the use of inanimate microbial components in premium skin creams by approximately 22%.

Dive into Technavio’s robust research methodology, blending expert interviews, extensive data synthesis, and validated models for unparalleled Postbiotic Market insights. See full methodology.

Market Scope
Page number 295
Base year 2025
Historic period 2020-2024
Forecast period 2026-2030
Growth momentum & CAGR Accelerate at a CAGR of 9.1%
Market growth 2026-2030 USD 82284.7 thousand
Market structure Fragmented
YoY growth 2025-2026(%) 8.9%
Key countries China, Japan, India, South Korea, Indonesia, Thailand, Singapore, Germany, UK, France, Italy, Spain, The Netherlands, Russia, US, Canada, Mexico, Australia, Brazil, UAE, Saudi Arabia, Turkey and South Africa
Competitive landscape Leading Companies, Market Positioning of Companies, Competitive Strategies, and Industry Risks

Request Free Sample

Research Analyst Overview

  • The Postbiotic Market is rapidly evolving from a niche sector into a foundational pillar of the functional ingredients industry. This structural shift is primarily driven by the superior stability of inactive biologicals, which circumvent the complex viability challenges associated with live probiotics.
  • Manufacturers prioritizing heat-inactivated microbes have realized substantial operational efficiencies, including a 20% decrease in overall product spoilage during international transit. This enhanced stability directly impacts boardroom-level budgeting decisions, allowing procurement teams to reallocate capital from expensive cold-chain logistics toward research and development.
  • The integration of resilient microorganisms into diverse product matrices enables companies to maintain rigorous quality control while scaling production safely. Furthermore, the scientific substantiation of microbial derivatives provides brands with compelling, evidence-based marketing narratives that resonate strongly with health-conscious consumers. By leveraging precise cellular extraction protocols, formulators can design highly targeted therapies for immune and digestive health.
  • Ultimately, this strategic pivot toward stable microbial biologicals ensures sustained operational profitability and stronger competitive positioning in an increasingly crowded wellness landscape.

What are the Key Data Covered in this Postbiotic Market Research and Growth Report?

  • What is the expected growth of the Postbiotic Market between 2026 and 2030?

    • USD 82.28 million, at a CAGR of 9.1%

  • What segmentation does the market report cover?

    • The report is segmented by Application (Food and beverages, Dietary supplements, Pharmaceuticals, Animal nutrition, and Personal care and cosmetics), Source (Bacteria, and Yeast), Type (Dry, and Liquid) and Geography (Asia, Europe, North America, Rest of World (ROW))

  • Which regions are analyzed in the report?

    • Asia, Europe, North America and Rest of World (ROW)

  • What are the key growth drivers and market challenges?

    • Proliferation of consumer awareness regarding human microbiome and preventive health, Regulatory ambiguity and lack of global harmonization

  • Who are the major players in the Postbiotic Market?

    • Adare Pharma Solutions, Archer Daniels Midland Co., BIO CAT Inc., Biorigin S.A., Cargill Inc., DSM Firmenich AG, GeneFerm Biotechnology Co. Ltd, International Flavors Inc., Kaneka Corp., Kerry Group Plc, KitoZyme LLC, Lallemand Inc., Lesaffre Group, Novonesis Group, Ohly GmbH, ​POSTBIOTICA S.R.L., Probi AB, Sabinsa Corp., Symrise Group and Unique Biotech Ltd.

Market Research Insights

  • The Postbiotic Market is undergoing a rapid structural transformation as manufacturers actively seek highly stable functional ingredients. By transitioning to temperature-resistant formulations, consumer health brands have reduced supply chain logistics costs by 20%, completely bypassing the expensive cold-chain networks required for live probiotics. This operational shift has effectively improved overall manufacturing throughput by 15%.
  • Formulators are increasingly incorporating these resilient components into diverse delivery formats and advanced functional food matrices. Supported by robust clinical research, these stable biologicals enable the precise targeting of digestive and immune health parameters without the viability concerns of traditional microbes, thereby increasing final product shelf life by up to 25% and significantly boosting long-term profitability.

We can help! Our analysts can customize this postbiotic market research report to meet your requirements.

Get in touch

1. Executive Summary

1.1 Market overview

Executive Summary - Chart on Market Overview
Executive Summary - Data Table on Market Overview
Executive Summary - Chart on Global Market Characteristics
Executive Summary - Chart on Market by Geography
Executive Summary - Chart on Market Segmentation by Application
Executive Summary - Chart on Market Segmentation by Source
Executive Summary - Chart on Market Segmentation by Type
Executive Summary - Chart on Incremental Growth
Executive Summary - Data Table on Incremental Growth
Executive Summary - Chart on Company Market Positioning

2. Technavio Analysis

2.1 Analysis of price sensitivity, lifecycle, customer purchase basket, adoption rates, and purchase criteria

2.2 Criticality of inputs and Factors of differentiation

Chart on Overview on criticality of inputs and factors of differentiation

2.3 Factors of disruption

Chart on Overview on factors of disruption

2.4 Impact of drivers and challenges

Chart on Impact of drivers and challenges in 2025 and 2030

3. Market Landscape

3.1 Market ecosystem

Chart on Parent Market
Data Table on - Parent Market

3.2 Market characteristics

Chart on Market characteristics analysis

3.3 Value chain analysis

Chart on Value chain analysis

4. Market Sizing

4.1 Market definition

Data Table on Offerings of companies included in the market definition

4.2 Market segment analysis

Market segments

4.3 Market size 2025

4.4 Market outlook: Forecast for 2025-2030

Chart on Global - Market size and forecast 2025-2030 ($ thousand)
Data Table on Global - Market size and forecast 2025-2030 ($ thousand)
Chart on Global Market: Year-over-year growth 2025-2030 (%)
Data Table on Global Market: Year-over-year growth 2025-2030 (%)

5. Historic Market Size

5.1 Global Postbiotic Market 2020 - 2024

Historic Market Size - Data Table on Global Postbiotic Market 2020 - 2024 ($ thousand)

5.2 Application segment analysis 2020 - 2024

Historic Market Size - Application Segment 2020 - 2024 ($ thousand)

5.3 Source segment analysis 2020 - 2024

Historic Market Size - Source Segment 2020 - 2024 ($ thousand)

5.4 Type segment analysis 2020 - 2024

Historic Market Size - Type Segment 2020 - 2024 ($ thousand)

5.5 Geography segment analysis 2020 - 2024

Historic Market Size - Geography Segment 2020 - 2024 ($ thousand)

5.6 Country segment analysis 2020 - 2024

Historic Market Size - Country Segment 2020 - 2024 ($ thousand)

6. Qualitative Analysis

6.1 Impact of AI on Global Postbiotic Market

6.2 Impact of Geopolitical Conflicts on Global Postbiotic Market

7. Five Forces Analysis

7.1 Five forces summary

Five forces analysis - Comparison between 2025 and 2030

7.2 Bargaining power of buyers

Bargaining power of buyers - Impact of key factors 2025 and 2030

7.3 Bargaining power of suppliers

Bargaining power of suppliers - Impact of key factors in 2025 and 2030

7.4 Threat of new entrants

Threat of new entrants - Impact of key factors in 2025 and 2030

7.5 Threat of substitutes

Threat of substitutes - Impact of key factors in 2025 and 2030

7.6 Threat of rivalry

Threat of rivalry - Impact of key factors in 2025 and 2030

7.7 Market condition

Chart on Market condition - Five forces 2025 and 2030

8. Market Segmentation by Application

8.1 Market segments

Chart on Application - Market share 2025-2030 (%)
Data Table on Application - Market share 2025-2030 (%)

8.2 Comparison by Application

Chart on Comparison by Application
Data Table on Comparison by Application

8.3 Food and beverages - Market size and forecast 2025-2030

Chart on Food and beverages - Market size and forecast 2025-2030 ($ thousand)
Data Table on Food and beverages - Market size and forecast 2025-2030 ($ thousand)
Chart on Food and beverages - Year-over-year growth 2025-2030 (%)
Data Table on Food and beverages - Year-over-year growth 2025-2030 (%)

8.4 Dietary supplements - Market size and forecast 2025-2030

Chart on Dietary supplements - Market size and forecast 2025-2030 ($ thousand)
Data Table on Dietary supplements - Market size and forecast 2025-2030 ($ thousand)
Chart on Dietary supplements - Year-over-year growth 2025-2030 (%)
Data Table on Dietary supplements - Year-over-year growth 2025-2030 (%)

8.5 Pharmaceuticals - Market size and forecast 2025-2030

Chart on Pharmaceuticals - Market size and forecast 2025-2030 ($ thousand)
Data Table on Pharmaceuticals - Market size and forecast 2025-2030 ($ thousand)
Chart on Pharmaceuticals - Year-over-year growth 2025-2030 (%)
Data Table on Pharmaceuticals - Year-over-year growth 2025-2030 (%)

8.6 Animal nutrition - Market size and forecast 2025-2030

Chart on Animal nutrition - Market size and forecast 2025-2030 ($ thousand)
Data Table on Animal nutrition - Market size and forecast 2025-2030 ($ thousand)
Chart on Animal nutrition - Year-over-year growth 2025-2030 (%)
Data Table on Animal nutrition - Year-over-year growth 2025-2030 (%)

8.7 Personal care and cosmetics - Market size and forecast 2025-2030

Chart on Personal care and cosmetics - Market size and forecast 2025-2030 ($ thousand)
Data Table on Personal care and cosmetics - Market size and forecast 2025-2030 ($ thousand)
Chart on Personal care and cosmetics - Year-over-year growth 2025-2030 (%)
Data Table on Personal care and cosmetics - Year-over-year growth 2025-2030 (%)

8.8 Market opportunity by Application

Market opportunity by Application ($ thousand)
Data Table on Market opportunity by Application ($ thousand)

9. Market Segmentation by Source

9.1 Market segments

Chart on Source - Market share 2025-2030 (%)
Data Table on Source - Market share 2025-2030 (%)

9.2 Comparison by Source

Chart on Comparison by Source
Data Table on Comparison by Source

9.3 Bacteria - Market size and forecast 2025-2030

Chart on Bacteria - Market size and forecast 2025-2030 ($ thousand)
Data Table on Bacteria - Market size and forecast 2025-2030 ($ thousand)
Chart on Bacteria - Year-over-year growth 2025-2030 (%)
Data Table on Bacteria - Year-over-year growth 2025-2030 (%)

9.4 Yeast - Market size and forecast 2025-2030

Chart on Yeast - Market size and forecast 2025-2030 ($ thousand)
Data Table on Yeast - Market size and forecast 2025-2030 ($ thousand)
Chart on Yeast - Year-over-year growth 2025-2030 (%)
Data Table on Yeast - Year-over-year growth 2025-2030 (%)

9.5 Market opportunity by Source

Market opportunity by Source ($ thousand)
Data Table on Market opportunity by Source ($ thousand)

10. Market Segmentation by Type

10.1 Market segments

Chart on Type - Market share 2025-2030 (%)
Data Table on Type - Market share 2025-2030 (%)

10.2 Comparison by Type

Chart on Comparison by Type
Data Table on Comparison by Type

10.3 Dry - Market size and forecast 2025-2030

Chart on Dry - Market size and forecast 2025-2030 ($ thousand)
Data Table on Dry - Market size and forecast 2025-2030 ($ thousand)
Chart on Dry - Year-over-year growth 2025-2030 (%)
Data Table on Dry - Year-over-year growth 2025-2030 (%)

10.4 Liquid - Market size and forecast 2025-2030

Chart on Liquid - Market size and forecast 2025-2030 ($ thousand)
Data Table on Liquid - Market size and forecast 2025-2030 ($ thousand)
Chart on Liquid - Year-over-year growth 2025-2030 (%)
Data Table on Liquid - Year-over-year growth 2025-2030 (%)

10.5 Market opportunity by Type

Market opportunity by Type ($ thousand)
Data Table on Market opportunity by Type ($ thousand)

11. Customer Landscape

11.1 Customer landscape overview

Analysis of price sensitivity, lifecycle, customer purchase basket, adoption rates, and purchase criteria

12. Geographic Landscape

12.1 Geographic segmentation

Chart on Market share by geography 2025-2030 (%)
Data Table on Market share by geography 2025-2030 (%)

12.2 Geographic comparison

Chart on Geographic comparison
Data Table on Geographic comparison

12.3 Asia - Market size and forecast 2025-2030

Chart on Asia - Market size and forecast 2025-2030 ($ thousand)
Data Table on Asia - Market size and forecast 2025-2030 ($ thousand)
Chart on Asia - Year-over-year growth 2025-2030 (%)
Data Table on Asia - Year-over-year growth 2025-2030 (%)
Chart on Regional Comparison - Asia
Data Table on Regional Comparison - Asia

12.3.1 China - Market size and forecast 2025-2030

Chart on China - Market size and forecast 2025-2030 ($ thousand)
Data Table on China - Market size and forecast 2025-2030 ($ thousand)
Chart on China - Year-over-year growth 2025-2030 (%)
Data Table on China - Year-over-year growth 2025-2030 (%)

12.3.2 Japan - Market size and forecast 2025-2030

Chart on Japan - Market size and forecast 2025-2030 ($ thousand)
Data Table on Japan - Market size and forecast 2025-2030 ($ thousand)
Chart on Japan - Year-over-year growth 2025-2030 (%)
Data Table on Japan - Year-over-year growth 2025-2030 (%)

12.3.3 India - Market size and forecast 2025-2030

Chart on India - Market size and forecast 2025-2030 ($ thousand)
Data Table on India - Market size and forecast 2025-2030 ($ thousand)
Chart on India - Year-over-year growth 2025-2030 (%)
Data Table on India - Year-over-year growth 2025-2030 (%)

12.3.4 South Korea - Market size and forecast 2025-2030

Chart on South Korea - Market size and forecast 2025-2030 ($ thousand)
Data Table on South Korea - Market size and forecast 2025-2030 ($ thousand)
Chart on South Korea - Year-over-year growth 2025-2030 (%)
Data Table on South Korea - Year-over-year growth 2025-2030 (%)

12.3.5 Indonesia - Market size and forecast 2025-2030

Chart on Indonesia - Market size and forecast 2025-2030 ($ thousand)
Data Table on Indonesia - Market size and forecast 2025-2030 ($ thousand)
Chart on Indonesia - Year-over-year growth 2025-2030 (%)
Data Table on Indonesia - Year-over-year growth 2025-2030 (%)

12.3.6 Thailand - Market size and forecast 2025-2030

Chart on Thailand - Market size and forecast 2025-2030 ($ thousand)
Data Table on Thailand - Market size and forecast 2025-2030 ($ thousand)
Chart on Thailand - Year-over-year growth 2025-2030 (%)
Data Table on Thailand - Year-over-year growth 2025-2030 (%)

12.3.7 Singapore - Market size and forecast 2025-2030

Chart on Singapore - Market size and forecast 2025-2030 ($ thousand)
Data Table on Singapore - Market size and forecast 2025-2030 ($ thousand)
Chart on Singapore - Year-over-year growth 2025-2030 (%)
Data Table on Singapore - Year-over-year growth 2025-2030 (%)

12.4 Europe - Market size and forecast 2025-2030

Chart on Europe - Market size and forecast 2025-2030 ($ thousand)
Data Table on Europe - Market size and forecast 2025-2030 ($ thousand)
Chart on Europe - Year-over-year growth 2025-2030 (%)
Data Table on Europe - Year-over-year growth 2025-2030 (%)
Chart on Regional Comparison - Europe
Data Table on Regional Comparison - Europe

12.4.1 Germany - Market size and forecast 2025-2030

Chart on Germany - Market size and forecast 2025-2030 ($ thousand)
Data Table on Germany - Market size and forecast 2025-2030 ($ thousand)
Chart on Germany - Year-over-year growth 2025-2030 (%)
Data Table on Germany - Year-over-year growth 2025-2030 (%)

12.4.2 UK - Market size and forecast 2025-2030

Chart on UK - Market size and forecast 2025-2030 ($ thousand)
Data Table on UK - Market size and forecast 2025-2030 ($ thousand)
Chart on UK - Year-over-year growth 2025-2030 (%)
Data Table on UK - Year-over-year growth 2025-2030 (%)

12.4.3 France - Market size and forecast 2025-2030

Chart on France - Market size and forecast 2025-2030 ($ thousand)
Data Table on France - Market size and forecast 2025-2030 ($ thousand)
Chart on France - Year-over-year growth 2025-2030 (%)
Data Table on France - Year-over-year growth 2025-2030 (%)

12.4.4 Italy - Market size and forecast 2025-2030

Chart on Italy - Market size and forecast 2025-2030 ($ thousand)
Data Table on Italy - Market size and forecast 2025-2030 ($ thousand)
Chart on Italy - Year-over-year growth 2025-2030 (%)
Data Table on Italy - Year-over-year growth 2025-2030 (%)

12.4.5 Spain - Market size and forecast 2025-2030

Chart on Spain - Market size and forecast 2025-2030 ($ thousand)
Data Table on Spain - Market size and forecast 2025-2030 ($ thousand)
Chart on Spain - Year-over-year growth 2025-2030 (%)
Data Table on Spain - Year-over-year growth 2025-2030 (%)

12.4.6 The Netherlands - Market size and forecast 2025-2030

Chart on The Netherlands - Market size and forecast 2025-2030 ($ thousand)
Data Table on The Netherlands - Market size and forecast 2025-2030 ($ thousand)
Chart on The Netherlands - Year-over-year growth 2025-2030 (%)
Data Table on The Netherlands - Year-over-year growth 2025-2030 (%)

12.4.7 Russia - Market size and forecast 2025-2030

Chart on Russia - Market size and forecast 2025-2030 ($ thousand)
Data Table on Russia - Market size and forecast 2025-2030 ($ thousand)
Chart on Russia - Year-over-year growth 2025-2030 (%)
Data Table on Russia - Year-over-year growth 2025-2030 (%)

12.5 North America - Market size and forecast 2025-2030

Chart on North America - Market size and forecast 2025-2030 ($ thousand)
Data Table on North America - Market size and forecast 2025-2030 ($ thousand)
Chart on North America - Year-over-year growth 2025-2030 (%)
Data Table on North America - Year-over-year growth 2025-2030 (%)
Chart on Regional Comparison - North America
Data Table on Regional Comparison - North America

12.5.1 US - Market size and forecast 2025-2030

Chart on US - Market size and forecast 2025-2030 ($ thousand)
Data Table on US - Market size and forecast 2025-2030 ($ thousand)
Chart on US - Year-over-year growth 2025-2030 (%)
Data Table on US - Year-over-year growth 2025-2030 (%)

12.5.2 Canada - Market size and forecast 2025-2030

Chart on Canada - Market size and forecast 2025-2030 ($ thousand)
Data Table on Canada - Market size and forecast 2025-2030 ($ thousand)
Chart on Canada - Year-over-year growth 2025-2030 (%)
Data Table on Canada - Year-over-year growth 2025-2030 (%)

12.5.3 Mexico - Market size and forecast 2025-2030

Chart on Mexico - Market size and forecast 2025-2030 ($ thousand)
Data Table on Mexico - Market size and forecast 2025-2030 ($ thousand)
Chart on Mexico - Year-over-year growth 2025-2030 (%)
Data Table on Mexico - Year-over-year growth 2025-2030 (%)

12.6 Rest of World (ROW) - Market size and forecast 2025-2030

Chart on Rest of World (ROW) - Market size and forecast 2025-2030 ($ thousand)
Data Table on Rest of World (ROW) - Market size and forecast 2025-2030 ($ thousand)
Chart on Rest of World (ROW) - Year-over-year growth 2025-2030 (%)
Data Table on Rest of World (ROW) - Year-over-year growth 2025-2030 (%)
Chart on Regional Comparison - Rest of World (ROW)
Data Table on Regional Comparison - Rest of World (ROW)

12.6.1 Australia - Market size and forecast 2025-2030

Chart on Australia - Market size and forecast 2025-2030 ($ thousand)
Data Table on Australia - Market size and forecast 2025-2030 ($ thousand)
Chart on Australia - Year-over-year growth 2025-2030 (%)
Data Table on Australia - Year-over-year growth 2025-2030 (%)

12.6.2 Brazil - Market size and forecast 2025-2030

Chart on Brazil - Market size and forecast 2025-2030 ($ thousand)
Data Table on Brazil - Market size and forecast 2025-2030 ($ thousand)
Chart on Brazil - Year-over-year growth 2025-2030 (%)
Data Table on Brazil - Year-over-year growth 2025-2030 (%)

12.6.3 UAE - Market size and forecast 2025-2030

Chart on UAE - Market size and forecast 2025-2030 ($ thousand)
Data Table on UAE - Market size and forecast 2025-2030 ($ thousand)
Chart on UAE - Year-over-year growth 2025-2030 (%)
Data Table on UAE - Year-over-year growth 2025-2030 (%)

12.6.4 Saudi Arabia - Market size and forecast 2025-2030

Chart on Saudi Arabia - Market size and forecast 2025-2030 ($ thousand)
Data Table on Saudi Arabia - Market size and forecast 2025-2030 ($ thousand)
Chart on Saudi Arabia - Year-over-year growth 2025-2030 (%)
Data Table on Saudi Arabia - Year-over-year growth 2025-2030 (%)

12.6.5 Turkey - Market size and forecast 2025-2030

Chart on Turkey - Market size and forecast 2025-2030 ($ thousand)
Data Table on Turkey - Market size and forecast 2025-2030 ($ thousand)
Chart on Turkey - Year-over-year growth 2025-2030 (%)
Data Table on Turkey - Year-over-year growth 2025-2030 (%)

12.6.6 South Africa - Market size and forecast 2025-2030

Chart on South Africa - Market size and forecast 2025-2030 ($ thousand)
Data Table on South Africa - Market size and forecast 2025-2030 ($ thousand)
Chart on South Africa - Year-over-year growth 2025-2030 (%)
Data Table on South Africa - Year-over-year growth 2025-2030 (%)

12.7 Market opportunity by geography

Market opportunity by geography ($ thousand)
Data Tables on Market opportunity by geography ($ thousand)

13. Drivers, Challenges, and Opportunity

13.1 Market drivers

Proliferation of consumer awareness regarding human microbiome and preventive health
Superior technological stability and versatile formulation capabilities
Increasing utilization in animal nutrition and veterinary applications

13.2 Market challenges

Regulatory ambiguity and lack of global harmonization
High production costs and complex manufacturing technologies
Limited consumer understanding and competition from established biotics

13.3 Impact of drivers and challenges

Impact of drivers and challenges in 2025 and 2030

13.4 Market opportunities

Integration of postbiotics in dermatological and cosmeceutical applications
Expansion of postbiotics into active lifestyle and sports nutrition formulations
Regulatory standardization and clinical validation enhancing commercial credibility

14. Competitive Landscape

14.1 Overview

14.2

Overview on criticality of inputs and factors of differentiation

14.3 Landscape disruption

Overview on factors of disruption

14.4 Industry risks

Impact of key risks on business

15. Competitive Analysis

15.1 Companies profiled

Companies covered

15.2 Company ranking index

15.3 Market positioning of companies

Matrix on companies position and classification

15.4 Adare Pharma Solutions

Adare Pharma Solutions - Overview
Adare Pharma Solutions - Product / Service
Adare Pharma Solutions - Key offerings
SWOT

15.5 Archer Daniels Midland Co.

Archer Daniels Midland Co. - Overview
Archer Daniels Midland Co. - Business segments
Archer Daniels Midland Co. - Key news
Archer Daniels Midland Co. - Key offerings
Archer Daniels Midland Co. - Segment focus
SWOT

15.6 Cargill Inc.

Cargill Inc. - Overview
Cargill Inc. - Product / Service
Cargill Inc. - Key news
Cargill Inc. - Key offerings
SWOT

15.7 DSM Firmenich AG

DSM Firmenich AG - Overview
DSM Firmenich AG - Business segments
DSM Firmenich AG - Key offerings
DSM Firmenich AG - Segment focus
SWOT

15.8 GeneFerm Biotechnology Co. Ltd

GeneFerm Biotechnology Co. Ltd - Overview
GeneFerm Biotechnology Co. Ltd - Product / Service
GeneFerm Biotechnology Co. Ltd - Key offerings
SWOT

15.9 International Flavors Inc.

International Flavors Inc. - Overview
International Flavors Inc. - Business segments
International Flavors Inc. - Key news
International Flavors Inc. - Key offerings
International Flavors Inc. - Segment focus
SWOT

15.10 Kaneka Corp.

Kaneka Corp. - Overview
Kaneka Corp. - Business segments
Kaneka Corp. - Key offerings
Kaneka Corp. - Segment focus
SWOT

15.11 Kerry Group Plc

Kerry Group Plc - Overview
Kerry Group Plc - Business segments
Kerry Group Plc - Key news
Kerry Group Plc - Key offerings
Kerry Group Plc - Segment focus
SWOT

15.12 KitoZyme LLC

KitoZyme LLC - Overview
KitoZyme LLC - Product / Service
KitoZyme LLC - Key offerings
SWOT

15.13 Lallemand Inc.

Lallemand Inc. - Overview
Lallemand Inc. - Product / Service
Lallemand Inc. - Key offerings
SWOT

15.14 Lesaffre Group

Lesaffre Group - Overview
Lesaffre Group - Product / Service
Lesaffre Group - Key offerings
SWOT

15.15 Novonesis Group

Novonesis Group - Overview
Novonesis Group - Business segments
Novonesis Group - Key offerings
Novonesis Group - Segment focus
SWOT

15.16 Ohly GmbH

Ohly GmbH - Overview
Ohly GmbH - Product / Service
Ohly GmbH - Key offerings
SWOT

15.17 Sabinsa Corp.

Sabinsa Corp. - Overview
Sabinsa Corp. - Product / Service
Sabinsa Corp. - Key offerings
SWOT

15.18 Symrise Group

Symrise Group - Overview
Symrise Group - Business segments
Symrise Group - Key news
Symrise Group - Key offerings
Symrise Group - Segment focus
SWOT

16. Appendix

16.1 Scope of the report

Market definition
Objectives
Notes and caveats

16.2 Inclusions and exclusions checklist

Inclusions checklist
Exclusions checklist

16.3 Currency conversion rates for US$

16.4 Research methodology

16.5 Data procurement

Information sources

16.6 Data validation

16.7 Validation techniques employed for market sizing

16.8 Data synthesis

16.9 360 degree market analysis

16.10 List of abbreviations

Research Methodology

Technavio presents a detailed picture of the market by way of study, synthesis, and summation of data from multiple sources. The analysts have presented the various facets of the market with a particular focus on identifying the key industry influencers. The data thus presented is comprehensive, reliable, and the result of extensive research, both primary and secondary.

INFORMATION SOURCES

Primary sources

  • Manufacturers and suppliers
  • Channel partners
  • Industry experts
  • Strategic decision makers

Secondary sources

  • Industry journals and periodicals
  • Government data
  • Financial reports of key industry players
  • Historical data
  • Press releases

DATA ANALYSIS

Data Synthesis

  • Collation of data
  • Estimation of key figures
  • Analysis of derived insights

Data Validation

  • Triangulation with data models
  • Reference against proprietary databases
  • Corroboration with industry experts

REPORT WRITING

Qualitative

  • Market drivers
  • Market challenges
  • Market trends
  • Five forces analysis

Quantitative

  • Market size and forecast
  • Market segmentation
  • Geographical insights
  • Competitive landscape

Interested in this report?

Get your sample now to see our research methodology and insights!

Download Now

Frequently Asked Questions

Postbiotic market growth will increase by USD 82284.7 thousand thousand during 2026-2030.

The Postbiotic market is expected to grow at a CAGR of 9.1% during 2026-2030.

Postbiotic market is segmented by Application (Food and beverages, Dietary supplements, Pharmaceuticals, Animal nutrition, Personal care and cosmetics) Source (Bacteria, Yeast) Type (Dry, Liquid)

Adare Pharma Solutions, Archer Daniels Midland Co., BIO CAT Inc., Biorigin S.A., Cargill Inc., DSM Firmenich AG, GeneFerm Biotechnology Co. Ltd, International Flavors Inc., Kaneka Corp., Kerry Group Plc, KitoZyme LLC, Lallemand Inc., Lesaffre Group, Novonesis Group, Ohly GmbH, ​POSTBIOTICA S.R.L., Probi AB, Sabinsa Corp., Symrise Group, Unique Biotech Ltd. are a few of the key vendors in the Postbiotic market.

Asia will register the highest growth rate of 41.5% among the other regions. Therefore, the Postbiotic market in Asia is expected to garner significant business opportunities for the vendors during the forecast period.

China, Japan, India, South Korea, Indonesia, Thailand, Singapore, Germany, UK, France, Italy, Spain, The Netherlands, Russia, US, Canada, Mexico, Australia, Brazil, UAE, Saudi Arabia, Turkey, South Africa

  • Proliferation of consumer awareness regarding human microbiome and preventive health is the driving factor this market.

The Postbiotic market vendors should focus on grabbing business opportunities from the Application segment as it accounted for the largest market share in the base year.
RIA - Research AI Assistant
Ask RIA
