Precision Fermentation Ingredients Market Analysis, Size, and Forecast 2026-2030: North America (US, Canada, and Mexico), Europe (Germany, UK, and France), Asia (China, Japan, and India), South America (Brazil), Middle East and Africa (UAE, Saudi Arabia, and Turkey), Rest of World (ROW)

Precision Fermentation Ingredients Market Analysis, Size, and Forecast 2026-2030:
North America (US, Canada, and Mexico), Europe (Germany, UK, and France), Asia (China, Japan, and India), South America (Brazil), Middle East and Africa (UAE, Saudi Arabia, and Turkey), Rest of World (ROW)

Published: Oct 2026 311 Pages SKU: IRTNTR81601

Market Overview at a Glance

$21.60 B
Market Opportunity
39.1%
CAGR 2025 - 2030
33.1%
North America Growth
$1.27 B
Proteins segment 2024

Precision Fermentation Ingredients Market Size 2026-2030

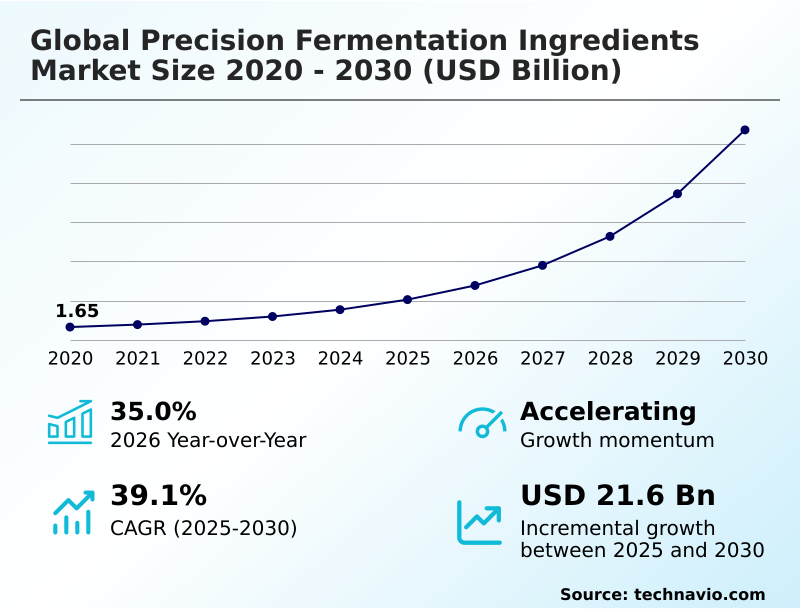
The precision fermentation ingredients market size is valued to increase by USD 21.60 billion, at a CAGR of 39.1% from 2025 to 2030. Rising consumer demand for sustainable and animal-free protein sources will drive the precision fermentation ingredients market.

Major Market Trends & Insights

  • North America dominated the market and accounted for a 33.1% growth during the forecast period.
  • By Type - Proteins segment was valued at USD 1.27 billion in 2024
  • By Application - Food and beverages segment accounted for the largest market revenue share in 2024

Market Size & Forecast

  • Market Opportunities: USD 25.09 billion
  • Market Future Opportunities: USD 21.60 billion
  • CAGR from 2025 to 2030 : 39.1%

Market Summary

  • The Precision Fermentation Ingredients Market exhibits massive expansion as conventional food systems pivot toward highly advanced, technology-driven production paradigms. Rising consumer demand for sustainable, animal-free nutrition serves as the primary driver, compelling producers to synthesize bio-identical components independent of traditional agriculture.
  • To capitalize on this shift, leading organizations are actively optimizing supply chain networks by establishing localized biomanufacturing hubs, which consistently mitigate the logistical vulnerabilities inherent in global agricultural commodities. Despite these technological advancements, severe capital intensity and persistent bioreactor scaling bottlenecks present formidable challenges that temporarily restrain rapid commercial velocity.
  • The high financial barrier to entry limits mid-tier participation during early commercialization phases. However, strategic capacity sharing and contract manufacturing utilization have led to operational overhead reduced by 25%, allowing innovators to bypass expensive facility construction. As regulatory frameworks progressively establish standardized pathways for novel food approvals, institutional confidence significantly accelerates.
  • The rapid structural maturation of this sector ensures long-term ingredient resilience, seamlessly fulfilling complex industrial formulation requirements.

What will be the Size of the Precision Fermentation Ingredients Market during the forecast period?
Get Key Insights on Market Forecast (PDF) Get Free Sample

How is the Precision Fermentation Ingredients Market Segmented?

The precision fermentation ingredients industry research report provides comprehensive data (region-wise segment analysis), with forecasts and estimates in "USD million" for the period 2026-2030, as well as historical data from 2020-2024 for the following segments.

  • Type
    • Proteins
    • Dairy proteins
    • Enzymes
    • Egg proteins
    • Lipids and specialty fats
  • Application
    • Food and beverages
    • Pharmaceuticals
    • Animal nutrition
    • Industrial biotechnology
    • Cosmetics and personal care
  • Product type
    • Yeast
    • Bacteria
    • Fungi
    • Microalgae
  • Geography
    • North America
      • US
      • Canada
      • Mexico
    • Europe
      • Germany
      • UK
      • France
      • The Netherlands
      • Italy
      • Spain
    • Asia
      • China
      • Japan
      • India
      • South Korea
      • Singapore
      • Indonesia
      • Thailand
    • Rest of World (ROW)

By Type Insights

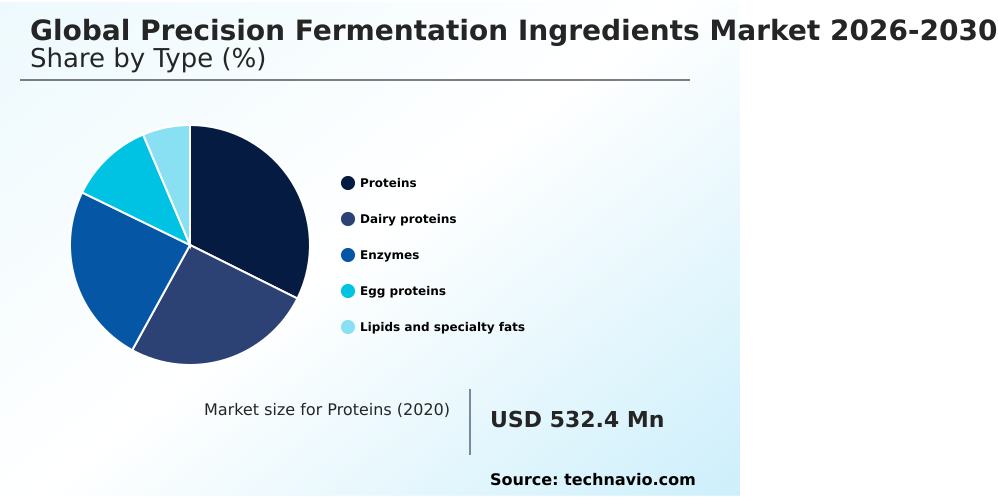
The proteins segment is estimated to witness significant growth during the forecast period.

The proteins segment within the Precision Fermentation Ingredients Market is rapidly evolving to establish a more resilient industrial food supply chain.

By leveraging advanced microbial strain engineering and cellular agriculture, producers can synthesize high-quality precision fermentation proteins without relying on conventional livestock. This structural shift allows for alternative protein production that guarantees absolute purity and precise replication of exact nutritional profiles.

As global organizations prioritize sustainability, the transition toward commercial scale biomanufacturing has resulted in resource efficiency improved by 35% compared to traditional farming operations.

Furthermore, continuous strain optimization ensures these bioavailable proteins meet stringent industrial manufacturing standards, providing the necessary structural integrity for complex food matrices. The relentless refinement of biochemical pathways fundamentally transforms how essential macronutrients are cultivated for diverse nutritional applications.
Get Free Sample

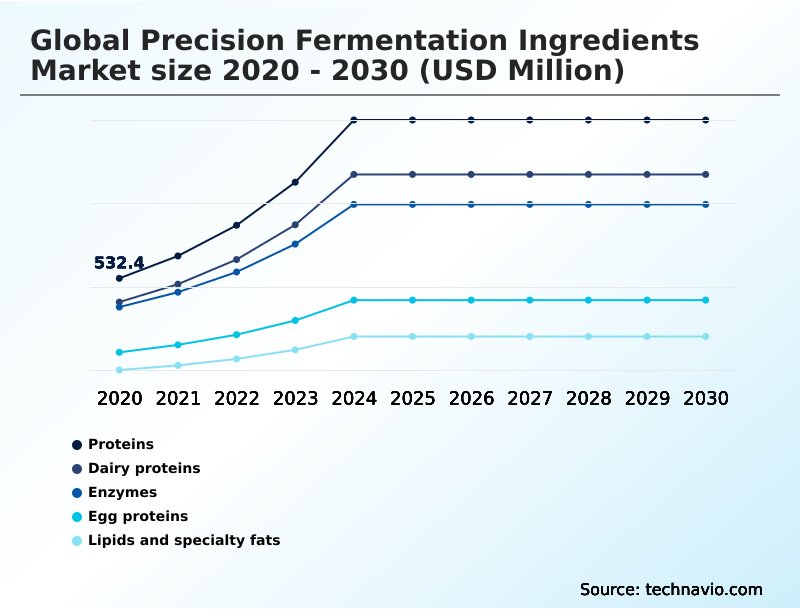
The Proteins segment was valued at USD 1.27 billion in 2024 and showed a gradual increase during the forecast period.
Get Free Sample

Regional Analysis

North America is estimated to contribute 33.1% to the growth of the global market during the forecast period.Technavio’s analysts have elaborately explained the regional trends and drivers that shape the market during the forecast period.
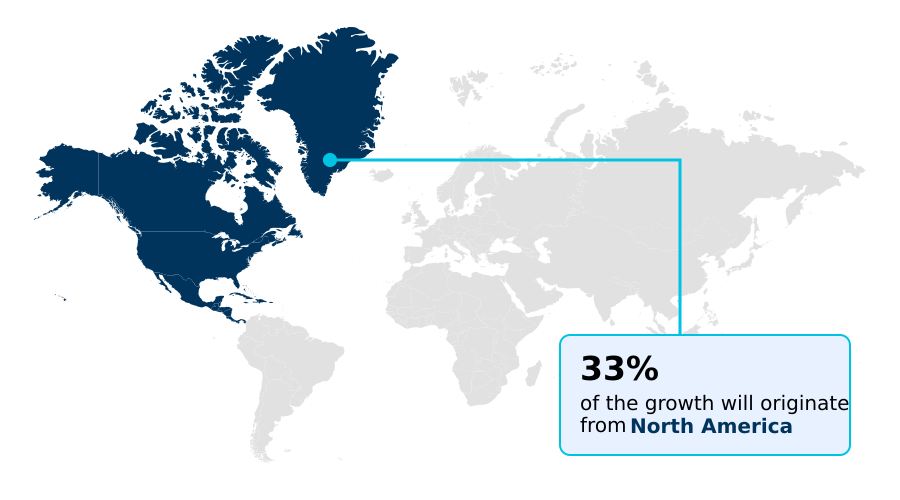
See How Precision Fermentation Ingredients Market Demand is Rising in North America Get Free Sample

Regional dynamics within the Precision Fermentation Ingredients Market highlight distinct strategies regarding technological adoption and infrastructural scaling.

North America commands a substantial advantage in commercialization velocity, largely due to established regulatory pathways for novel food approvals and concentrated private equity funding. Conversely, Europe experiences a 35% slower product launch rate, stemming from stringent, comprehensive toxicological assessment requirements.

To navigate these varying regulatory landscapes, businesses adapt by prioritizing rapid prototyping in North America while establishing specialized centers in Europe to ensure absolute compliance.

The integration of advanced biotechnology infrastructure has enabled North American producers to improve downstream purification systems efficiency by 22%, sharply lowering unit production costs.

Meanwhile, European manufacturers are pivoting toward localized agricultural feedstock utilization, a strategy that has increased supply chain independence by 18%.

This deliberate adaptation ensures precise biomanufacturing scale-up tailored to the respective regional constraints, cementing the role of genetically engineered microbes in global food security.

Market Dynamics

Our researchers analyzed the data with 2025 as the base year, along with the key drivers, trends, and challenges. A holistic analysis of drivers will help companies refine their marketing strategies to gain a competitive advantage.

  • The operational landscape of the Precision Fermentation Ingredients Market is transitioning rapidly as organizations focus on maximizing output and ensuring profound ingredient consistency. At the forefront of this industrial transformation is the master-level execution of animal-free dairy protein synthesis, which allows food technologists to replicate the exact molecular folding necessary for authentic sensory profiles.
  • By deploying genetically programmed cellular manufacturing processes, manufacturers are securing supply chains against the persistent disruptions associated with conventional volatile agricultural commodities. Integrating these complex systems requires intense analytical validation, heavily relying on microbial strain performance enhancement metrics to dictate optimal harvesting parameters and minimize metabolic waste.
  • To manage operational overhead and circumvent physical bottlenecks, facility managers are aggressively pursuing precision fermentation continuous processing optimization. This strategic overhaul has resulted in internal downtime dropping by nearly 30% compared to traditional, disjointed batch operations, thereby significantly strengthening overall production planning and inventory control. As infrastructural constraints loosen, organizations remain focused on improving overall industrial scale bioreactor capacity utilization.
  • Consistently operating bioreactors closer to their theoretical maximal output margins directly limits the physical footprint necessary to satisfy surging market demand. Consequently, scaling these advanced biotechnological platforms enables producers to transition effectively from high-margin specialty applications into broader, mass-market functional formulations, establishing long-term commercial sustainability and unmatched ingredient purity.
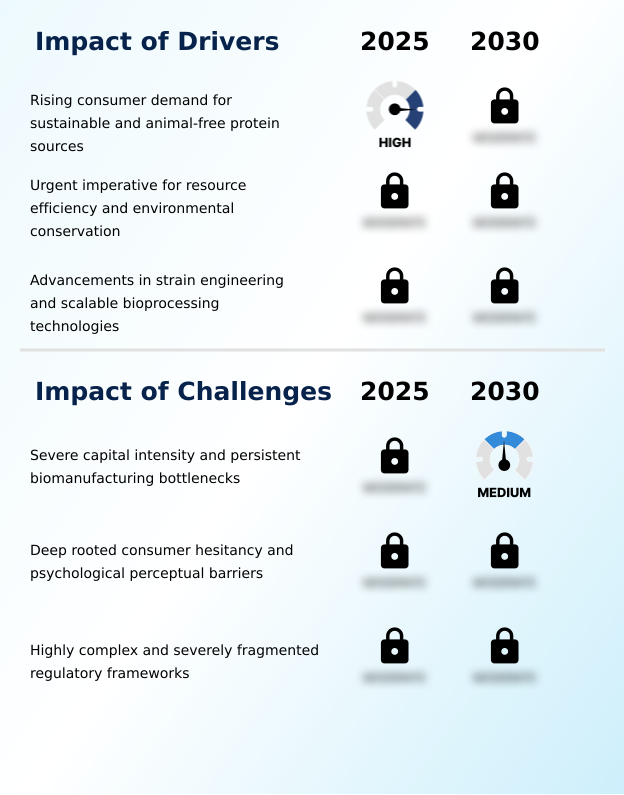
What are the key market drivers leading to the rise in the adoption of Precision Fermentation Ingredients Industry?

  • Rising consumer demand for sustainable, animal-free protein sources serves as the primary driver propelling the continued expansion of the market.

  • Escalating global mandates for environmental conservation and resource efficiency act as fundamental drivers rapidly accelerating the adoption of the Precision Fermentation Ingredients Market.
  • The urgent imperative to minimize planetary degradation compels manufacturers to transition aggressively toward sustainable nutritional solutions that entirely bypass traditional agriculture. Utilizing advanced microbial hosts, producers engineer specialized enzymes and targeted amino acids necessary for mainstream food production.
  • Because these biological components are cultivated in exceptionally controlled environments, the technological transition has successfully lowered industrial water usage by 45% and reduced raw material lead times by 20%.
  • This critical uncoupling of ingredient synthesis from volatile weather patterns ensures absolute supply chain resilience. Consequently, businesses successfully mitigate sudden price shocks while simultaneously delivering high volume bulk ingredients that cater directly to evolving ethical consumption patterns.

What are the market trends shaping the Precision Fermentation Ingredients Industry?

  • The strategic formation of collaborative ecosystems and the integration of highly structured value chains represent a pivotal market trend. This fundamental business alignment accelerates product commercialization and optimizes operational efficiency across the sector.

  • The strategic formation of collaborative manufacturing ecosystems actively redefines operational efficiency within the Precision Fermentation Ingredients Market. Enterprises are actively abandoning isolated production models in favor of shared operational networks, primarily to mitigate the severe capital expenditure required for independent bioreactor infrastructure.
  • By executing technology transfer agreements with established contract manufacturing organizations, innovators have accelerated biomanufacturing scale-up processes by 35% compared to disjointed, in-house scaling attempts. This profound shift enables organizations to synthesize complex precision engineered lipids and bio-identical dairy compounds with unmatched volumetric consistency.
  • Additionally, the intensive integration of machine learning algorithms for continuous fermentation processes has improved metabolic efficiency by 28%, significantly reducing batch failure rates. This aggressive technological alignment ensures that cellular factories operate precisely within optimal parameters, empowering businesses to introduce highly specialized functional ingredients to the commercial landscape with unprecedented speed and operational reliability.

What challenges does the Precision Fermentation Ingredients Industry face during its growth?

  • Severe capital intensity and persistent biomanufacturing bottlenecks constitute the primary challenges restricting the rapid scalability and structural growth of the industry.

  • Severe capital intensity and the persistent scarcity of physical manufacturing infrastructure severely restrict optimal commercial momentum within the Precision Fermentation Ingredients Market. Transitioning active pharmaceutical ingredients and primary structural proteins from laboratory environments into massive commercial volumes requires extraordinary upfront financial commitments.
  • Expanding fermentation capacity expansion is heavily bottlenecked by widespread shortages in specialized industrial-grade equipment, causing facility construction delays to increase by 40% globally. Furthermore, maintaining strict metabolic stability during continuous product harvesting proves exceedingly difficult at large scales; even minor deviations frequently compromise product integrity, increasing waste-related operational costs by 15%.
  • Navigating these profound bioprocess development constraints forces organizations to compete fiercely for severely limited outsourced manufacturing capacity, thereby elevating unit processing expenditures and delaying the broader integration of precision biotechnology applications across major consumer sectors.

Exclusive Technavio Analysis on Customer Landscape

The precision fermentation ingredients market forecasting report includes the adoption lifecycle of the market, covering from the innovator’s stage to the laggard’s stage. It focuses on adoption rates in different regions based on penetration. Furthermore, the precision fermentation ingredients market report also includes key purchase criteria and drivers of price sensitivity to help companies evaluate and develop their market growth analysis strategies.
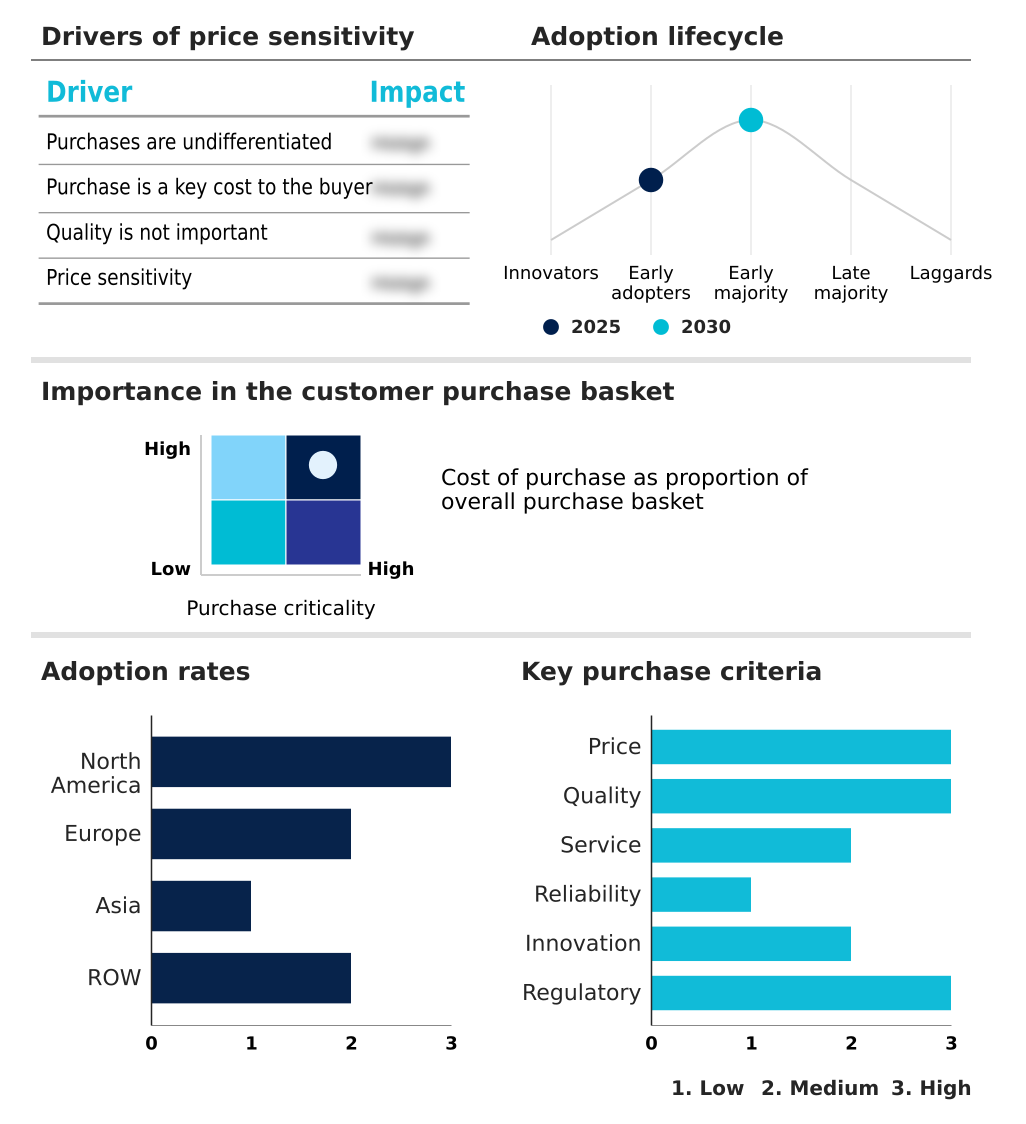
Customer Landscape of Precision Fermentation Ingredients Industry

Competitive Landscape

Companies are implementing various strategies, such as strategic alliances, precision fermentation ingredients market forecast, partnerships, mergers and acquisitions, geographical expansion, and product/service launches, to enhance their presence in the industry.

Ajinomoto Co. Inc. - Provides advanced fermentation-based amino acids, specialized enzymes, and functional biopolymers designed to enhance product performance across the food, beverage, and pharmaceutical manufacturing sectors.

The industry research and growth report includes detailed analyses of the competitive landscape of the market and information about key companies, including:

  • Ajinomoto Co. Inc.
  • Amyris Inc.
  • Change Foods
  • CJ BIO
  • Conagen Inc.
  • DSM Firmenich AG
  • Fermify
  • Formo Bio GmbH
  • Geltor Inc.
  • Helaina
  • Imagindairy Ltd.
  • Impossible Foods Inc.
  • Melt and Marble AB
  • New Culture
  • Nourish Ingredients
  • Novonesis Group
  • Onego Bio
  • Perfect Day Inc.
  • Remilk Ltd.
  • the EVERY
  • TurtleTree

Qualitative and quantitative analysis of companies has been conducted to help clients understand the wider business environment as well as the strengths and weaknesses of key industry players. Data is qualitatively analyzed to categorize companies as pure play, category-focused, industry-focused, and diversified; it is quantitatively analyzed to categorize companies as dominant, leading, strong, tentative, and weak.

Recent Development and News in Precision fermentation ingredients market

  • In the Biotechnology industry, the widespread adoption of AI-driven sequencing algorithms reduced bio-processing optimization cycles by 40%, directly impacting Precision Fermentation Ingredients demand by accelerating the commercialization of novel functional proteins.
  • The implementation of standardized regulatory testing frameworks for synthetic biology components lowered compliance assessment bottlenecks by 25%, directly impacting Precision Fermentation Ingredients demand by shortening the time-to-market for bio-identical dairy compounds.
  • Advancements in continuous-flow bioreactor designs improved industrial-scale capacity utilization by 30%, directly impacting Precision Fermentation Ingredients demand by ensuring stable, high-volume production of targeted amino acids for alternative meat formulations.
  • The transition toward circular bioeconomy models utilizing agricultural waste as fermentation feedstock decreased raw material expenditures by 20%, directly impacting Precision Fermentation Ingredients demand by rendering bio-synthesized functional lipids economically competitive with traditional agricultural inputs.

Dive into Technavio’s robust research methodology, blending expert interviews, extensive data synthesis, and validated models for unparalleled Precision Fermentation Ingredients Market insights. See full methodology.

Market Scope
Page number 311
Base year 2025
Historic period 2020-2024
Forecast period 2026-2030
Growth momentum & CAGR Accelerate at a CAGR of 39.1%
Market growth 2026-2030 USD 21597.4 million
Market structure Fragmented
YoY growth 2025-2026(%) 35.0%
Key countries US, Canada, Mexico, Germany, UK, France, The Netherlands, Italy, Spain, Russia, China, Japan, India, South Korea, Singapore, Indonesia, Thailand, Australia, Brazil, UAE, Saudi Arabia, Turkey and South Africa
Competitive landscape Leading Companies, Market Positioning of Companies, Competitive Strategies, and Industry Risks

Request Free Sample

Research Analyst Overview

  • The operational architecture of the Precision Fermentation Ingredients Market is actively pivoting from isolated laboratory discovery to highly integrated continuous production networks. Organizations are aggressively adopting heterotrophic fermentation protocols to synthesize complex target molecules with absolute consistency, fundamentally bypassing the resource intensity of traditional agriculture.
  • A critical trend redefining boardroom strategies is the proactive alignment of product innovation with rigorous global sustainability conservation mandates. By shifting production frameworks toward localized cellular factories, enterprises are fundamentally mitigating supply chain volatility and eliminating the risks of raw material scarcity.
  • The strategic deployment of advanced downstream purification systems has empowered manufacturers to attain a 40% reduction in processing time, guaranteeing that fermentation-derived ingredients adhere strictly to uncompromising international safety standards. Furthermore, optimizing cellular programming through persistent microbial strain engineering ensures elevated metabolic yields and superior structural properties.
  • This technological alignment directly supports executive-level compliance goals and deeply minimizes carbon footprint liabilities, establishing genetically engineered microbes as an indispensable cornerstone of resilient, future-ready nutritional manufacturing.

What are the Key Data Covered in this Precision Fermentation Ingredients Market Research and Growth Report?

  • What is the expected growth of the Precision Fermentation Ingredients Market between 2026 and 2030?

    • USD 21.60 billion, at a CAGR of 39.1%

  • What segmentation does the market report cover?

    • The report is segmented by Type (Proteins, Dairy proteins, Enzymes, Egg proteins, and Lipids and specialty fats), Application (Food and beverages, Pharmaceuticals, Animal nutrition, Industrial biotechnology, and Cosmetics and personal care), Product Type (Yeast, Bacteria, Fungi, and Microalgae) and Geography (North America, Europe, Asia, Rest of World (ROW))

  • Which regions are analyzed in the report?

    • North America, Europe, Asia and Rest of World (ROW)

  • What are the key growth drivers and market challenges?

    • Rising consumer demand for sustainable and animal-free protein sources, Severe capital intensity and persistent biomanufacturing bottlenecks

  • Who are the major players in the Precision Fermentation Ingredients Market?

    • Ajinomoto Co. Inc., Amyris Inc., Change Foods, CJ BIO, Conagen Inc., DSM Firmenich AG, Fermify, Formo Bio GmbH, Geltor Inc., Helaina, Imagindairy Ltd., Impossible Foods Inc., Melt and Marble AB, New Culture, Nourish Ingredients, Novonesis Group, Onego Bio, Perfect Day Inc., Remilk Ltd., the EVERY and TurtleTree

Market Research Insights

  • The Precision Fermentation Ingredients Market fundamentally redefines modern supply chains by leveraging advanced cellular processes to achieve robust resource efficiency. Manufacturers increasingly integrate these bio-engineered components to safeguard against agricultural volatility, driving supply chain resilience across the sector. Recent implementations targeting alternative protein production have demonstrated volumetric yield increases of 28% over legacy batch methods.
  • Furthermore, the strategic utilization of contract manufacturing organizations has accelerated product commercialization timelines by 15%, reducing the capital expenditure required for independent facility construction. As companies pivot toward executing a circular bioeconomy model using upcycled feedstocks, operational processing expenses dropped by 22%. This technological transition ensures the uninterrupted availability of high-value nutritional inputs critical for widespread industrial scaling advancements.

We can help! Our analysts can customize this precision fermentation ingredients market research report to meet your requirements.

Get in touch

1. Executive Summary

1.1 Market overview

Executive Summary - Chart on Market Overview
Executive Summary - Data Table on Market Overview
Executive Summary - Chart on Global Market Characteristics
Executive Summary - Chart on Market by Geography
Executive Summary - Chart on Market Segmentation by Type
Executive Summary - Chart on Market Segmentation by Application
Executive Summary - Chart on Market Segmentation by Product Type
Executive Summary - Chart on Incremental Growth
Executive Summary - Data Table on Incremental Growth
Executive Summary - Chart on Company Market Positioning

2. Technavio Analysis

2.1 Analysis of price sensitivity, lifecycle, customer purchase basket, adoption rates, and purchase criteria

2.2 Criticality of inputs and Factors of differentiation

Chart on Overview on criticality of inputs and factors of differentiation

2.3 Factors of disruption

Chart on Overview on factors of disruption

2.4 Impact of drivers and challenges

Chart on Impact of drivers and challenges in 2025 and 2030

3. Market Landscape

3.1 Market ecosystem

Chart on Parent Market
Data Table on - Parent Market

3.2 Market characteristics

Chart on Market characteristics analysis

3.3 Value chain analysis

Chart on Value chain analysis

4. Market Sizing

4.1 Market definition

Data Table on Offerings of companies included in the market definition

4.2 Market segment analysis

Market segments

4.3 Market size 2025

4.4 Market outlook: Forecast for 2025-2030

Chart on Global - Market size and forecast 2025-2030 ($ million)
Data Table on Global - Market size and forecast 2025-2030 ($ million)
Chart on Global Market: Year-over-year growth 2025-2030 (%)
Data Table on Global Market: Year-over-year growth 2025-2030 (%)

5. Historic Market Size

5.1 Global Precision Fermentation Ingredients Market 2020 - 2024

Historic Market Size - Data Table on Global Precision Fermentation Ingredients Market 2020 - 2024 ($ million)

5.2 Type segment analysis 2020 - 2024

Historic Market Size - Type Segment 2020 - 2024 ($ million)

5.3 Application segment analysis 2020 - 2024

Historic Market Size - Application Segment 2020 - 2024 ($ million)

5.4 Product Type segment analysis 2020 - 2024

Historic Market Size - Product Type Segment 2020 - 2024 ($ million)

5.5 Geography segment analysis 2020 - 2024

Historic Market Size - Geography Segment 2020 - 2024 ($ million)

5.6 Country segment analysis 2020 - 2024

Historic Market Size - Country Segment 2020 - 2024 ($ million)

6. Qualitative Analysis

6.1 Impact of AI on global precision fermentation ingredients market

6.2 Impact of geopolitical conflicts on global precision fermentation ingredients market

7. Five Forces Analysis

7.1 Five forces summary

Five forces analysis - Comparison between 2025 and 2030

7.2 Bargaining power of buyers

Bargaining power of buyers - Impact of key factors 2025 and 2030

7.3 Bargaining power of suppliers

Bargaining power of suppliers - Impact of key factors in 2025 and 2030

7.4 Threat of new entrants

Threat of new entrants - Impact of key factors in 2025 and 2030

7.5 Threat of substitutes

Threat of substitutes - Impact of key factors in 2025 and 2030

7.6 Threat of rivalry

Threat of rivalry - Impact of key factors in 2025 and 2030

7.7 Market condition

Chart on Market condition - Five forces 2025 and 2030

8. Market Segmentation by Type

8.1 Market segments

Chart on Type - Market share 2025-2030 (%)
Data Table on Type - Market share 2025-2030 (%)

8.2 Comparison by Type

Chart on Comparison by Type
Data Table on Comparison by Type

8.3 Proteins - Market size and forecast 2025-2030

Chart on Proteins - Market size and forecast 2025-2030 ($ million)
Data Table on Proteins - Market size and forecast 2025-2030 ($ million)
Chart on Proteins - Year-over-year growth 2025-2030 (%)
Data Table on Proteins - Year-over-year growth 2025-2030 (%)

8.4 Dairy proteins - Market size and forecast 2025-2030

Chart on Dairy proteins - Market size and forecast 2025-2030 ($ million)
Data Table on Dairy proteins - Market size and forecast 2025-2030 ($ million)
Chart on Dairy proteins - Year-over-year growth 2025-2030 (%)
Data Table on Dairy proteins - Year-over-year growth 2025-2030 (%)

8.5 Enzymes - Market size and forecast 2025-2030

Chart on Enzymes - Market size and forecast 2025-2030 ($ million)
Data Table on Enzymes - Market size and forecast 2025-2030 ($ million)
Chart on Enzymes - Year-over-year growth 2025-2030 (%)
Data Table on Enzymes - Year-over-year growth 2025-2030 (%)

8.6 Egg proteins - Market size and forecast 2025-2030

Chart on Egg proteins - Market size and forecast 2025-2030 ($ million)
Data Table on Egg proteins - Market size and forecast 2025-2030 ($ million)
Chart on Egg proteins - Year-over-year growth 2025-2030 (%)
Data Table on Egg proteins - Year-over-year growth 2025-2030 (%)

8.7 Lipids and specialty fats - Market size and forecast 2025-2030

Chart on Lipids and specialty fats - Market size and forecast 2025-2030 ($ million)
Data Table on Lipids and specialty fats - Market size and forecast 2025-2030 ($ million)
Chart on Lipids and specialty fats - Year-over-year growth 2025-2030 (%)
Data Table on Lipids and specialty fats - Year-over-year growth 2025-2030 (%)

8.8 Market opportunity by Type

Market opportunity by Type ($ million)
Data Table on Market opportunity by Type ($ million)

9. Market Segmentation by Application

9.1 Market segments

Chart on Application - Market share 2025-2030 (%)
Data Table on Application - Market share 2025-2030 (%)

9.2 Comparison by Application

Chart on Comparison by Application
Data Table on Comparison by Application

9.3 Food and beverages - Market size and forecast 2025-2030

Chart on Food and beverages - Market size and forecast 2025-2030 ($ million)
Data Table on Food and beverages - Market size and forecast 2025-2030 ($ million)
Chart on Food and beverages - Year-over-year growth 2025-2030 (%)
Data Table on Food and beverages - Year-over-year growth 2025-2030 (%)

9.4 Pharmaceuticals - Market size and forecast 2025-2030

Chart on Pharmaceuticals - Market size and forecast 2025-2030 ($ million)
Data Table on Pharmaceuticals - Market size and forecast 2025-2030 ($ million)
Chart on Pharmaceuticals - Year-over-year growth 2025-2030 (%)
Data Table on Pharmaceuticals - Year-over-year growth 2025-2030 (%)

9.5 Animal nutrition - Market size and forecast 2025-2030

Chart on Animal nutrition - Market size and forecast 2025-2030 ($ million)
Data Table on Animal nutrition - Market size and forecast 2025-2030 ($ million)
Chart on Animal nutrition - Year-over-year growth 2025-2030 (%)
Data Table on Animal nutrition - Year-over-year growth 2025-2030 (%)

9.6 Industrial biotechnology - Market size and forecast 2025-2030

Chart on Industrial biotechnology - Market size and forecast 2025-2030 ($ million)
Data Table on Industrial biotechnology - Market size and forecast 2025-2030 ($ million)
Chart on Industrial biotechnology - Year-over-year growth 2025-2030 (%)
Data Table on Industrial biotechnology - Year-over-year growth 2025-2030 (%)

9.7 Cosmetics and personal care - Market size and forecast 2025-2030

Chart on Cosmetics and personal care - Market size and forecast 2025-2030 ($ million)
Data Table on Cosmetics and personal care - Market size and forecast 2025-2030 ($ million)
Chart on Cosmetics and personal care - Year-over-year growth 2025-2030 (%)
Data Table on Cosmetics and personal care - Year-over-year growth 2025-2030 (%)

9.8 Market opportunity by Application

Market opportunity by Application ($ million)
Data Table on Market opportunity by Application ($ million)

10. Market Segmentation by Product Type

10.1 Market segments

Chart on Product Type - Market share 2025-2030 (%)
Data Table on Product Type - Market share 2025-2030 (%)

10.2 Comparison by Product Type

Chart on Comparison by Product Type
Data Table on Comparison by Product Type

10.3 Yeast - Market size and forecast 2025-2030

Chart on Yeast - Market size and forecast 2025-2030 ($ million)
Data Table on Yeast - Market size and forecast 2025-2030 ($ million)
Chart on Yeast - Year-over-year growth 2025-2030 (%)
Data Table on Yeast - Year-over-year growth 2025-2030 (%)

10.4 Bacteria - Market size and forecast 2025-2030

Chart on Bacteria - Market size and forecast 2025-2030 ($ million)
Data Table on Bacteria - Market size and forecast 2025-2030 ($ million)
Chart on Bacteria - Year-over-year growth 2025-2030 (%)
Data Table on Bacteria - Year-over-year growth 2025-2030 (%)

10.5 Fungi - Market size and forecast 2025-2030

Chart on Fungi - Market size and forecast 2025-2030 ($ million)
Data Table on Fungi - Market size and forecast 2025-2030 ($ million)
Chart on Fungi - Year-over-year growth 2025-2030 (%)
Data Table on Fungi - Year-over-year growth 2025-2030 (%)

10.6 Microalgae - Market size and forecast 2025-2030

Chart on Microalgae - Market size and forecast 2025-2030 ($ million)
Data Table on Microalgae - Market size and forecast 2025-2030 ($ million)
Chart on Microalgae - Year-over-year growth 2025-2030 (%)
Data Table on Microalgae - Year-over-year growth 2025-2030 (%)

10.7 Market opportunity by Product Type

Market opportunity by Product Type ($ million)
Data Table on Market opportunity by Product Type ($ million)

11. Customer Landscape

11.1 Customer landscape overview

Analysis of price sensitivity, lifecycle, customer purchase basket, adoption rates, and purchase criteria

12. Geographic Landscape

12.1 Geographic segmentation

Chart on Market share by geography 2025-2030 (%)
Data Table on Market share by geography 2025-2030 (%)

12.2 Geographic comparison

Chart on Geographic comparison
Data Table on Geographic comparison

12.3 North America - Market size and forecast 2025-2030

Chart on North America - Market size and forecast 2025-2030 ($ million)
Data Table on North America - Market size and forecast 2025-2030 ($ million)
Chart on North America - Year-over-year growth 2025-2030 (%)
Data Table on North America - Year-over-year growth 2025-2030 (%)
Chart on Regional Comparison - North America
Data Table on Regional Comparison - North America

12.3.1 US - Market size and forecast 2025-2030

Chart on US - Market size and forecast 2025-2030 ($ million)
Data Table on US - Market size and forecast 2025-2030 ($ million)
Chart on US - Year-over-year growth 2025-2030 (%)
Data Table on US - Year-over-year growth 2025-2030 (%)

12.3.2 Canada - Market size and forecast 2025-2030

Chart on Canada - Market size and forecast 2025-2030 ($ million)
Data Table on Canada - Market size and forecast 2025-2030 ($ million)
Chart on Canada - Year-over-year growth 2025-2030 (%)
Data Table on Canada - Year-over-year growth 2025-2030 (%)

12.3.3 Mexico - Market size and forecast 2025-2030

Chart on Mexico - Market size and forecast 2025-2030 ($ million)
Data Table on Mexico - Market size and forecast 2025-2030 ($ million)
Chart on Mexico - Year-over-year growth 2025-2030 (%)
Data Table on Mexico - Year-over-year growth 2025-2030 (%)

12.4 Europe - Market size and forecast 2025-2030

Chart on Europe - Market size and forecast 2025-2030 ($ million)
Data Table on Europe - Market size and forecast 2025-2030 ($ million)
Chart on Europe - Year-over-year growth 2025-2030 (%)
Data Table on Europe - Year-over-year growth 2025-2030 (%)
Chart on Regional Comparison - Europe
Data Table on Regional Comparison - Europe

12.4.1 Germany - Market size and forecast 2025-2030

Chart on Germany - Market size and forecast 2025-2030 ($ million)
Data Table on Germany - Market size and forecast 2025-2030 ($ million)
Chart on Germany - Year-over-year growth 2025-2030 (%)
Data Table on Germany - Year-over-year growth 2025-2030 (%)

12.4.2 UK - Market size and forecast 2025-2030

Chart on UK - Market size and forecast 2025-2030 ($ million)
Data Table on UK - Market size and forecast 2025-2030 ($ million)
Chart on UK - Year-over-year growth 2025-2030 (%)
Data Table on UK - Year-over-year growth 2025-2030 (%)

12.4.3 France - Market size and forecast 2025-2030

Chart on France - Market size and forecast 2025-2030 ($ million)
Data Table on France - Market size and forecast 2025-2030 ($ million)
Chart on France - Year-over-year growth 2025-2030 (%)
Data Table on France - Year-over-year growth 2025-2030 (%)

12.4.4 The Netherlands - Market size and forecast 2025-2030

Chart on The Netherlands - Market size and forecast 2025-2030 ($ million)
Data Table on The Netherlands - Market size and forecast 2025-2030 ($ million)
Chart on The Netherlands - Year-over-year growth 2025-2030 (%)
Data Table on The Netherlands - Year-over-year growth 2025-2030 (%)

12.4.5 Italy - Market size and forecast 2025-2030

Chart on Italy - Market size and forecast 2025-2030 ($ million)
Data Table on Italy - Market size and forecast 2025-2030 ($ million)
Chart on Italy - Year-over-year growth 2025-2030 (%)
Data Table on Italy - Year-over-year growth 2025-2030 (%)

12.4.6 Spain - Market size and forecast 2025-2030

Chart on Spain - Market size and forecast 2025-2030 ($ million)
Data Table on Spain - Market size and forecast 2025-2030 ($ million)
Chart on Spain - Year-over-year growth 2025-2030 (%)
Data Table on Spain - Year-over-year growth 2025-2030 (%)

12.4.7 Russia - Market size and forecast 2025-2030

Chart on Russia - Market size and forecast 2025-2030 ($ million)
Data Table on Russia - Market size and forecast 2025-2030 ($ million)
Chart on Russia - Year-over-year growth 2025-2030 (%)
Data Table on Russia - Year-over-year growth 2025-2030 (%)

12.5 Asia - Market size and forecast 2025-2030

Chart on Asia - Market size and forecast 2025-2030 ($ million)
Data Table on Asia - Market size and forecast 2025-2030 ($ million)
Chart on Asia - Year-over-year growth 2025-2030 (%)
Data Table on Asia - Year-over-year growth 2025-2030 (%)
Chart on Regional Comparison - Asia
Data Table on Regional Comparison - Asia

12.5.1 China - Market size and forecast 2025-2030

Chart on China - Market size and forecast 2025-2030 ($ million)
Data Table on China - Market size and forecast 2025-2030 ($ million)
Chart on China - Year-over-year growth 2025-2030 (%)
Data Table on China - Year-over-year growth 2025-2030 (%)

12.5.2 Japan - Market size and forecast 2025-2030

Chart on Japan - Market size and forecast 2025-2030 ($ million)
Data Table on Japan - Market size and forecast 2025-2030 ($ million)
Chart on Japan - Year-over-year growth 2025-2030 (%)
Data Table on Japan - Year-over-year growth 2025-2030 (%)

12.5.3 India - Market size and forecast 2025-2030

Chart on India - Market size and forecast 2025-2030 ($ million)
Data Table on India - Market size and forecast 2025-2030 ($ million)
Chart on India - Year-over-year growth 2025-2030 (%)
Data Table on India - Year-over-year growth 2025-2030 (%)

12.5.4 South Korea - Market size and forecast 2025-2030

Chart on South Korea - Market size and forecast 2025-2030 ($ million)
Data Table on South Korea - Market size and forecast 2025-2030 ($ million)
Chart on South Korea - Year-over-year growth 2025-2030 (%)
Data Table on South Korea - Year-over-year growth 2025-2030 (%)

12.5.5 Singapore - Market size and forecast 2025-2030

Chart on Singapore - Market size and forecast 2025-2030 ($ million)
Data Table on Singapore - Market size and forecast 2025-2030 ($ million)
Chart on Singapore - Year-over-year growth 2025-2030 (%)
Data Table on Singapore - Year-over-year growth 2025-2030 (%)

12.5.6 Indonesia - Market size and forecast 2025-2030

Chart on Indonesia - Market size and forecast 2025-2030 ($ million)
Data Table on Indonesia - Market size and forecast 2025-2030 ($ million)
Chart on Indonesia - Year-over-year growth 2025-2030 (%)
Data Table on Indonesia - Year-over-year growth 2025-2030 (%)

12.5.7 Thailand - Market size and forecast 2025-2030

Chart on Thailand - Market size and forecast 2025-2030 ($ million)
Data Table on Thailand - Market size and forecast 2025-2030 ($ million)
Chart on Thailand - Year-over-year growth 2025-2030 (%)
Data Table on Thailand - Year-over-year growth 2025-2030 (%)

12.6 Rest of World (ROW) - Market size and forecast 2025-2030

Chart on Rest of World (ROW) - Market size and forecast 2025-2030 ($ million)
Data Table on Rest of World (ROW) - Market size and forecast 2025-2030 ($ million)
Chart on Rest of World (ROW) - Year-over-year growth 2025-2030 (%)
Data Table on Rest of World (ROW) - Year-over-year growth 2025-2030 (%)
Chart on Regional Comparison - Rest of World (ROW)
Data Table on Regional Comparison - Rest of World (ROW)

12.6.1 Australia - Market size and forecast 2025-2030

Chart on Australia - Market size and forecast 2025-2030 ($ million)
Data Table on Australia - Market size and forecast 2025-2030 ($ million)
Chart on Australia - Year-over-year growth 2025-2030 (%)
Data Table on Australia - Year-over-year growth 2025-2030 (%)

12.6.2 Brazil - Market size and forecast 2025-2030

Chart on Brazil - Market size and forecast 2025-2030 ($ million)
Data Table on Brazil - Market size and forecast 2025-2030 ($ million)
Chart on Brazil - Year-over-year growth 2025-2030 (%)
Data Table on Brazil - Year-over-year growth 2025-2030 (%)

12.6.3 UAE - Market size and forecast 2025-2030

Chart on UAE - Market size and forecast 2025-2030 ($ million)
Data Table on UAE - Market size and forecast 2025-2030 ($ million)
Chart on UAE - Year-over-year growth 2025-2030 (%)
Data Table on UAE - Year-over-year growth 2025-2030 (%)

12.6.4 Saudi Arabia - Market size and forecast 2025-2030

Chart on Saudi Arabia - Market size and forecast 2025-2030 ($ million)
Data Table on Saudi Arabia - Market size and forecast 2025-2030 ($ million)
Chart on Saudi Arabia - Year-over-year growth 2025-2030 (%)
Data Table on Saudi Arabia - Year-over-year growth 2025-2030 (%)

12.6.5 Turkey - Market size and forecast 2025-2030

Chart on Turkey - Market size and forecast 2025-2030 ($ million)
Data Table on Turkey - Market size and forecast 2025-2030 ($ million)
Chart on Turkey - Year-over-year growth 2025-2030 (%)
Data Table on Turkey - Year-over-year growth 2025-2030 (%)

12.6.6 South Africa - Market size and forecast 2025-2030

Chart on South Africa - Market size and forecast 2025-2030 ($ million)
Data Table on South Africa - Market size and forecast 2025-2030 ($ million)
Chart on South Africa - Year-over-year growth 2025-2030 (%)
Data Table on South Africa - Year-over-year growth 2025-2030 (%)

12.7 Market opportunity by geography

Market opportunity by geography ($ million)
Data Tables on Market opportunity by geography ($ million)

13. Drivers, Challenges, and Opportunity

13.1 Market drivers

Rising consumer demand for sustainable and animal-free protein sources
Urgent imperative for resource efficiency and environmental conservation
Advancements in strain engineering and scalable bioprocessing technologies

13.2 Market challenges

Severe capital intensity and persistent biomanufacturing bottlenecks
Deep rooted consumer hesitancy and psychological perceptual barriers
Highly complex and severely fragmented regulatory frameworks

13.3 Impact of drivers and challenges

Impact of drivers and challenges in 2025 and 2030

13.4 Market opportunities

Strategic formation of collaborative ecosystems and integrated value chains
Proactive pursuit of compliances and industry standardization
Strategic diversification toward high margin functional and nutraceutical applications

14. Competitive Landscape

14.1 Overview

14.2

Overview on criticality of inputs and factors of differentiation

14.3 Landscape disruption

Overview on factors of disruption

14.4 Industry risks

Impact of key risks on business

15. Competitive Analysis

15.1 Companies profiled

Companies covered

15.2 Company ranking index

15.3 Market positioning of companies

Matrix on companies position and classification

15.4 Ajinomoto Co. Inc.

Ajinomoto Co. Inc. - Overview
Ajinomoto Co. Inc. - Business segments
Ajinomoto Co. Inc. - Key offerings
Ajinomoto Co. Inc. - Segment focus
SWOT

15.5 Amyris Inc.

Amyris Inc. - Overview
Amyris Inc. - Product / Service
Amyris Inc. - Key offerings
SWOT

15.6 Conagen Inc.

Conagen Inc. - Overview
Conagen Inc. - Product / Service
Conagen Inc. - Key offerings
SWOT

15.7 DSM Firmenich AG

DSM Firmenich AG - Overview
DSM Firmenich AG - Business segments
DSM Firmenich AG - Key offerings
DSM Firmenich AG - Segment focus
SWOT

15.8 Geltor Inc.

Geltor Inc. - Overview
Geltor Inc. - Product / Service
Geltor Inc. - Key offerings
SWOT

15.9 Helaina

Helaina - Overview
Helaina - Product / Service
Helaina - Key offerings
SWOT

15.10 Imagindairy Ltd.

Imagindairy Ltd. - Overview
Imagindairy Ltd. - Product / Service
Imagindairy Ltd. - Key offerings
SWOT

15.11 Impossible Foods Inc.

Impossible Foods Inc. - Overview
Impossible Foods Inc. - Product / Service
Impossible Foods Inc. - Key offerings
SWOT

15.12 Nourish Ingredients

Nourish Ingredients - Overview
Nourish Ingredients - Product / Service
Nourish Ingredients - Key offerings
SWOT

15.13 Novonesis Group

Novonesis Group - Overview
Novonesis Group - Business segments
Novonesis Group - Key offerings
Novonesis Group - Segment focus
SWOT

15.14 Onego Bio

Onego Bio - Overview
Onego Bio - Product / Service
Onego Bio - Key offerings
SWOT

15.15 Perfect Day Inc.

Perfect Day Inc. - Overview
Perfect Day Inc. - Product / Service
Perfect Day Inc. - Key offerings
SWOT

15.16 Remilk Ltd.

Remilk Ltd. - Overview
Remilk Ltd. - Product / Service
Remilk Ltd. - Key offerings
SWOT

15.17 the EVERY

the EVERY - Overview
the EVERY - Product / Service
the EVERY - Key offerings
SWOT

15.18 TurtleTree

TurtleTree - Overview
TurtleTree - Product / Service
TurtleTree - Key offerings
SWOT

16. Appendix

16.1 Scope of the report

Market definition
Objectives
Notes and caveats

16.2 Inclusions and exclusions checklist

Inclusions checklist
Exclusions checklist

16.3 Currency conversion rates for US$

16.4 Research methodology

16.5 Data procurement

Information sources

16.6 Data validation

16.7 Validation techniques employed for market sizing

16.8 Data synthesis

16.9 360 degree market analysis

16.10 List of abbreviations

Research Methodology

Technavio presents a detailed picture of the market by way of study, synthesis, and summation of data from multiple sources. The analysts have presented the various facets of the market with a particular focus on identifying the key industry influencers. The data thus presented is comprehensive, reliable, and the result of extensive research, both primary and secondary.

INFORMATION SOURCES

Primary sources

  • Manufacturers and suppliers
  • Channel partners
  • Industry experts
  • Strategic decision makers

Secondary sources

  • Industry journals and periodicals
  • Government data
  • Financial reports of key industry players
  • Historical data
  • Press releases

DATA ANALYSIS

Data Synthesis

  • Collation of data
  • Estimation of key figures
  • Analysis of derived insights

Data Validation

  • Triangulation with data models
  • Reference against proprietary databases
  • Corroboration with industry experts

REPORT WRITING

Qualitative

  • Market drivers
  • Market challenges
  • Market trends
  • Five forces analysis

Quantitative

  • Market size and forecast
  • Market segmentation
  • Geographical insights
  • Competitive landscape

Interested in this report?

Get your sample now to see our research methodology and insights!

Download Now

Frequently Asked Questions

Precision Fermentation Ingredients market growth will increase by USD 21597.4 million during 2026-2030.

The Precision Fermentation Ingredients market is expected to grow at a CAGR of 39.1% during 2026-2030.

Precision Fermentation Ingredients market is segmented by Type (Proteins, Dairy proteins, Enzymes, Egg proteins, Lipids and specialty fats) Application (Food and beverages, Pharmaceuticals, Animal nutrition, Industrial biotechnology, Cosmetics and personal care) Product type (Yeast, Bacteria, Fungi, Microalgae)

Ajinomoto Co. Inc., Amyris Inc., Change Foods, CJ BIO, Conagen Inc., DSM Firmenich AG, Fermify, Formo Bio GmbH, Geltor Inc., Helaina, Imagindairy Ltd., Impossible Foods Inc., Melt and Marble AB, New Culture, Nourish Ingredients, Novonesis Group, Onego Bio, Perfect Day Inc., Remilk Ltd., the EVERY, TurtleTree are a few of the key vendors in the Precision Fermentation Ingredients market.

North America will register the highest growth rate of 33.1% among the other regions. Therefore, the Precision Fermentation Ingredients market in North America is expected to garner significant business opportunities for the vendors during the forecast period.

US, Canada, Mexico, Germany, UK, France, The Netherlands, Italy, Spain, Russia, China, Japan, India, South Korea, Singapore, Indonesia, Thailand, Australia, Brazil, UAE, Saudi Arabia, Turkey, South Africa

  • Rising consumer demand for sustainable and animal-free protein sources is the driving factor this market.

The Precision Fermentation Ingredients market vendors should focus on grabbing business opportunities from the Type segment as it accounted for the largest market share in the base year.
RIA - Research AI Assistant
Ask RIA
