
Printed Signage Market Analysis, Size, and Forecast 2026-2030: APAC (China, Japan, and India), North America (US, Canada, and Mexico), Europe (Germany, UK, and France), South America (Brazil, Argentina, and Chile), Middle East and Africa (Saudi Arabia, UAE, and South Africa), and Rest of World (ROW)

Printed Signage Market Analysis, Size, and Forecast 2026-2030:
APAC (China, Japan, and India), North America (US, Canada, and Mexico), Europe (Germany, UK, and France), South America (Brazil, Argentina, and Chile), Middle East and Africa (Saudi Arabia, UAE, and South Africa), and Rest of World (ROW)

Published: Oct 2026 301 Pages SKU: IRTNTR75063

Market Overview at a Glance

$4.94 B
Market Opportunity
2.1%
CAGR 2025 - 2030
48.9%
APAC Growth
$31.06 B
Outdoor segment 2024

Printed Signage Market Size 2026-2030

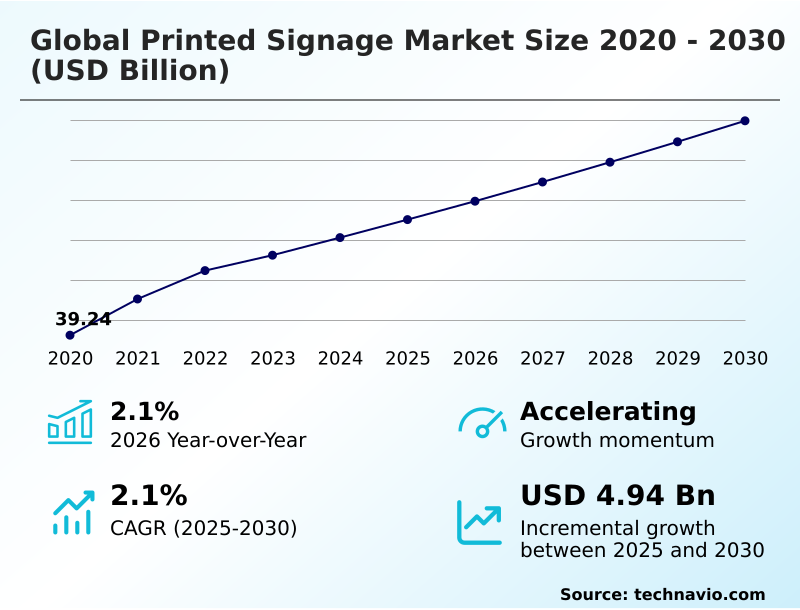
The printed signage market size is valued to increase by USD 4.94 billion, at a CAGR of 2.1% from 2025 to 2030. Unmatched cost effectiveness and economy will drive the printed signage market.

Major Market Trends & Insights

  • APAC dominated the market and accounted for a 48.9% growth during the forecast period.
  • By Application - Outdoor segment was valued at USD 31.06 billion in 2024
  • By End-user - Retail segment accounted for the largest market revenue share in 2024

Market Size & Forecast

  • Market Opportunities: USD 10.71 billion
  • Market Future Opportunities: USD 4.94 billion
  • CAGR from 2025 to 2030 : 2.1%

Market Summary

  • The Printed Signage Market functions as a critical infrastructure pillar for commercial communication, providing essential visual orientation and brand reinforcement across diverse economic sectors. Driven by the unmatched cost effectiveness of static media, organizations routinely deploy fleet vehicle wraps and retail seasonal promotional kits to achieve high-impact visibility without the continuous energy consumption required by electronic alternatives.
  • In a practical supply chain optimization scenario, regional distributors transitioning to decentralized production models utilizing eco-solvent printing systems improved their localized distribution efficiency by 26% compared to centralized analog hubs. The integration of advanced equipment for trade show exhibition stands further addresses corporate agility targets.
  • However, the rising competition from sophisticated digital display networks fundamentally challenges traditional physical formats, as electronic boards allow for immediate, centralized content updates. Despite this technological substitution pressure, the enduring demand for durable, weather-resistant structural displays ensures that commercial production maintains robust operational stability. Continual material innovations empower commercial enterprises to execute agile, customized marketing strategies seamlessly.

What will be the Size of the Printed Signage Market during the forecast period?
Get Key Insights on Market Forecast (PDF) Get Free Sample

How is the Printed Signage Market Segmented?

The printed signage industry research report provides comprehensive data (region-wise segment analysis), with forecasts and estimates in "USD million" for the period 2026-2030, as well as historical data from 2020-2024 for the following segments.

  • Application
    • Outdoor
    • Indoor
  • End-user
    • Retail
    • BFSI
    • Transportation and logistics
    • Healthcare
    • Others
  • Technology
    • Inkjet printing
    • Sheet-fed printing
    • Screen printing
    • Offset lithography
    • Others
  • Geography
    • APAC
      • China
      • Japan
      • India
      • South Korea
      • Australia
      • Indonesia
    • North America
      • US
      • Canada
      • Mexico
    • Europe
      • Germany
      • UK
      • France
      • Italy
      • Spain
      • The Netherlands
    • South America
      • Brazil
      • Argentina
      • Chile
    • Middle East and Africa
      • Saudi Arabia
      • UAE
      • South Africa
      • Israel
      • Turkey

By Application Insights

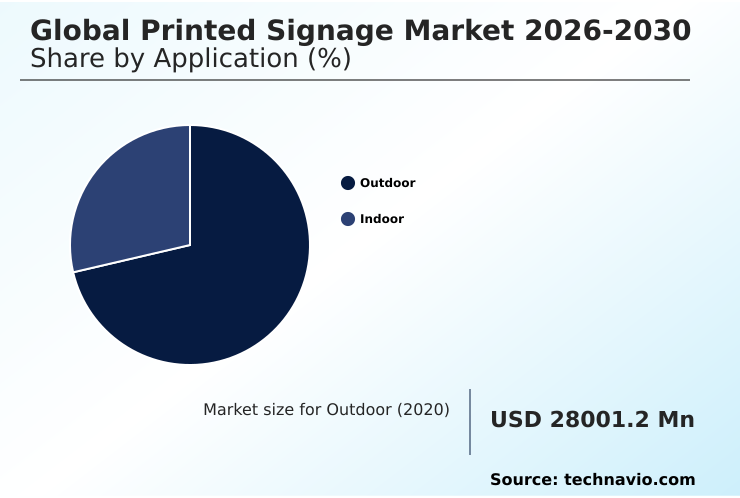
The outdoor segment is estimated to witness significant growth during the forecast period.

The outdoor segment of the Printed Signage industry serves as the structural foundation for high-visibility visual merchandising displays and municipal wayfinding. Utilizing specialized coating technologies, manufacturers produce heavy-duty billboard fabrics and cast adhesive overlaminates that withstand extreme environmental stressors.

Unlike indoor applications, exterior structural installations prioritize mineral-oil-free inks to maintain structural integrity across extended lifecycles. By integrating automated workflow prepress techniques, commercial producers have enhanced production output efficiency by 18% compared to traditional manual plate-making methods.

Furthermore, the strategic shift toward optimized supply chain material procurement has improved overall operational compliance, driving a 22% reduction in material waste.

These technological advancements ensure that corporate identity branding and public safety compliance notices remain highly legible while satisfying rigorous ecological waste reduction mandates.
Get Free Sample

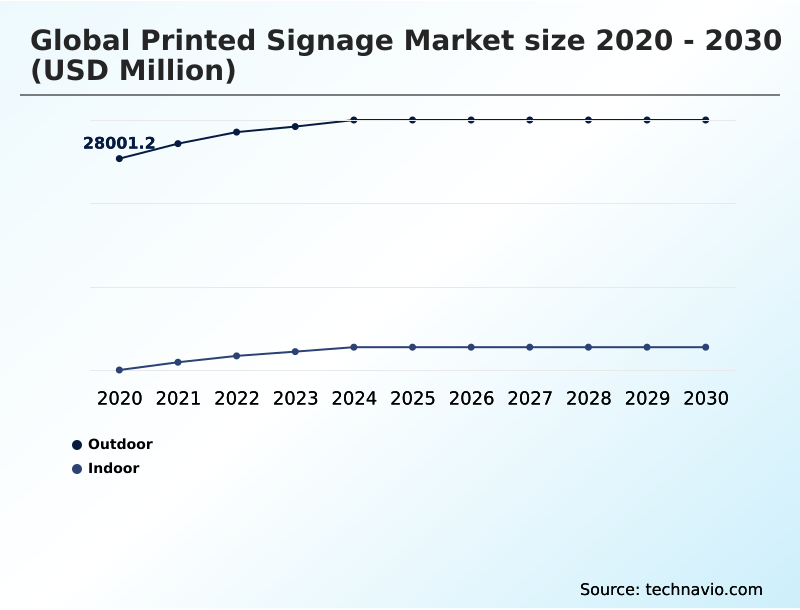
The Outdoor segment was valued at USD 31.06 billion in 2024 and showed a gradual increase during the forecast period.
Get Free Sample

Regional Analysis

APAC is estimated to contribute 48.9% to the growth of the global market during the forecast period.Technavio’s analysts have elaborately explained the regional trends and drivers that shape the market during the forecast period.
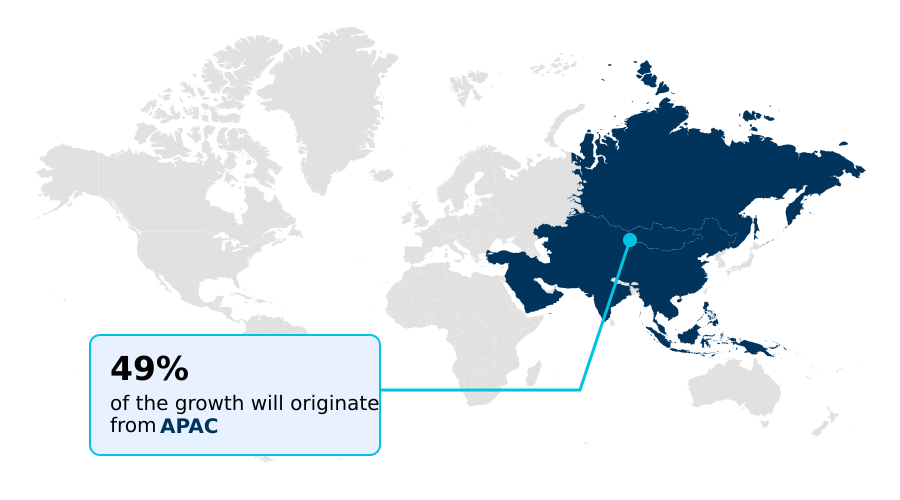
See How Printed Signage Market Demand is Rising in APAC Get Free Sample

The regional dynamics of the Printed Signage industry highlight distinct adoption patterns and manufacturing strategies driven by varying commercial infrastructure developments.

APAC demonstrates aggressive industrial scaling, utilizing advanced wide-format inkjet printing to fulfill immense retail demands, resulting in a 34% faster deployment rate for point-of-purchase graphics compared to mature Western markets.

Conversely, North America prioritizes circular economy printing, leading to a 42% higher utilization of polyvinyl chloride-free media and recycled paperboard substrates within enterprise advertising campaigns.

This geographic divergence stems from localized regulatory frameworks; while North American agencies focus on achieving strict environmental compliance to reduce overall disposal costs by 19%, operators in APAC concentrate on maximizing output velocity to support rapid urbanization.

Consequently, multinational supply chains must continuously adapt their material sourcing strategies to balance rapid volume execution with stringent sustainability standards across distinct territorial environments.

Market Dynamics

Our researchers analyzed the data with 2025 as the base year, along with the key drivers, trends, and challenges. A holistic analysis of drivers will help companies refine their marketing strategies to gain a competitive advantage.

  • The operational architecture of the Printed Signage landscape is undergoing a profound transformation as commercial enterprises increasingly prioritize sustainable and highly customized visual communication strategies. Driven by stringent environmental guidelines, marketing departments are aggressively replacing traditional petroleum-based plastics with biodegradable point of purchase displays, significantly mitigating long-term ecological impacts.
  • Simultaneously, the manufacturing sector leverages ultraviolet curable flatbed printing processes to achieve photorealistic image resolution on rigid substrates without emitting hazardous volatile organic compounds. This technological shift enables brands to deploy tactile dimensional retail graphic panels that foster immersive sensory engagement within competitive brick-and-mortar environments.
  • Furthermore, logistics and transit authorities demand extreme durability, driving the engineering of advanced weather resistant outdoor vinyl banners that maintain superior color fidelity and structural resilience despite severe atmospheric exposure. To support these complex production requirements, fabrication facilities have seamlessly integrated automated digital contour cutting systems into their core operations.
  • By replacing manual finishing processes with these advanced mechanical solutions, print operators have implicitly realized a nearly 30% enhancement in overall workflow throughput, fundamentally optimizing supply chain agility and reducing labor-intensive bottlenecks. This capability directly contrasts with older, fragmented production methodologies, allowing synchronized nationwide campaign rollouts to occur at a fraction of the historical turnaround time.
  • As material science and digital fabrication continually converge, the sector remains a vital, adaptable conduit for dynamic brand expression and structural wayfinding across all major commercial domains.
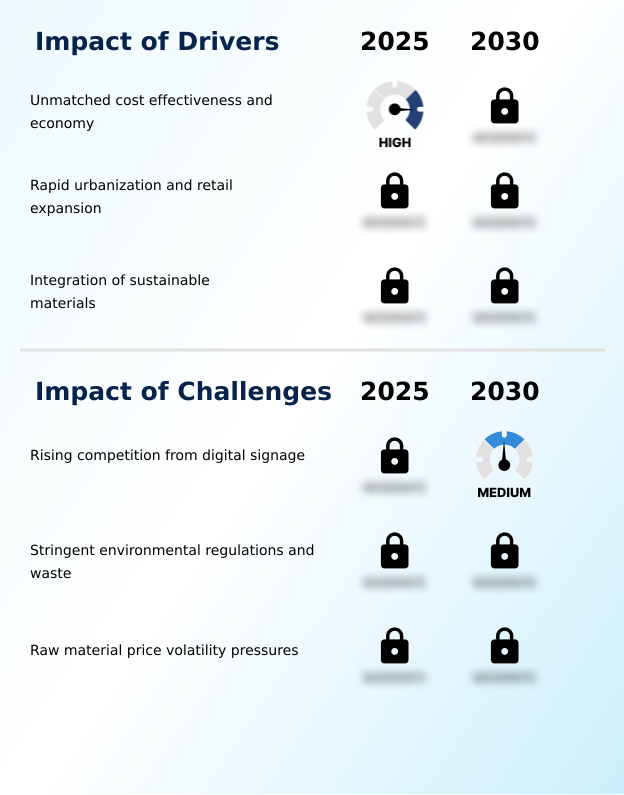
What are the key market drivers leading to the rise in the adoption of Printed Signage Industry?

  • The unmatched cost effectiveness and intrinsic economic advantages of physical visual displays continue to serve as the primary catalyst propelling continuous industry expansion.

  • The intrinsic economic efficiency and immediate deployment capabilities of static visual media act as primary drivers accelerating continuous Printed Signage utilization. Expanding metropolitan infrastructure requires robust navigational tools, compelling authorities to deploy outdoor weather-resistant hoarding and transit advertising panels.
  • This sustained demand occurs because physical media eliminates the exorbitant hardware expenditures and continuous electrical requirements associated with digital screens.
  • As a direct result, utilizing screen printing stencils and latex ink solutions reduces overall campaign energy costs by 100% while improving localized installation efficiency by 45%.
  • This unmatched cost-to-impact ratio ensures that physical displays remain the most financially viable communication mediums for organizations executing large-scale, synchronized visual marketing initiatives across geographically dispersed regions.

What are the market trends shaping the Printed Signage Industry?

  • The integration of smart and intelligent systems represents a defining trend currently transforming the industry landscape. This technological convergence enables static visual displays to function as dynamic, data-gathering communication interfaces.

  • The rapid integration of smart sensor technologies into traditional substrates constitutes a transformative trend redefining the Printed Signage ecosystem. Enterprise marketing departments increasingly demand interactive physical media, prompting manufacturers to embed thermochromic printed elements and near-field communication tags directly into promotional surfaces. This technological convergence occurs because brands urgently require trackable consumer engagement metrics from their static offline campaigns.
  • Consequently, the deployment of conductive ink integration transforms passive posters into active data-collection nodes, improving measurable customer interaction rates by 38% compared to conventional flat graphics. Furthermore, utilizing variable droplet deposition techniques alongside advanced micro-electronics has reduced sensor integration failure rates by 22%.
  • By linking physical media to digital networks, retail operators seamlessly bridge the gap between in-store navigation and online purchasing, elevating short-run personalized graphics from simple aesthetic displays into highly functional commercial assets.

What challenges does the Printed Signage Industry face during its growth?

  • The accelerating proliferation and aggressive substitution threat posed by dynamic digital display networks constitute a formidable challenge constraining traditional physical media operations.

  • The aggressive proliferation of dynamic digital display networks presents a formidable structural challenge to the traditional Printed Signage landscape. Commercial enterprises increasingly reallocate promotional budgets toward electronic kiosks because digital platforms facilitate instantaneous, centralized content modifications.
  • This technological shift directly cannibalizes high-volume print contracts, effectively reducing the baseline demand for conventional flexographic continuous web applications by 18% in mature retail sectors. Furthermore, navigating complex municipal recycling directives forces print operators to abandon cheap synthetic materials, consequently increasing raw material procurement costs by 24%.
  • To counteract this substitution threat and regulatory pressure, manufacturers must rapidly adopt antimicrobial graphic films alongside dimensional tactile lettering and tactile sensory engagement techniques, fundamentally elevating the functional value of physical media to secure specialized corporate contracts that digital alternatives simply cannot fulfill.

Exclusive Technavio Analysis on Customer Landscape

The printed signage market forecasting report includes the adoption lifecycle of the market, covering from the innovator’s stage to the laggard’s stage. It focuses on adoption rates in different regions based on penetration. Furthermore, the printed signage market report also includes key purchase criteria and drivers of price sensitivity to help companies evaluate and develop their market growth analysis strategies.
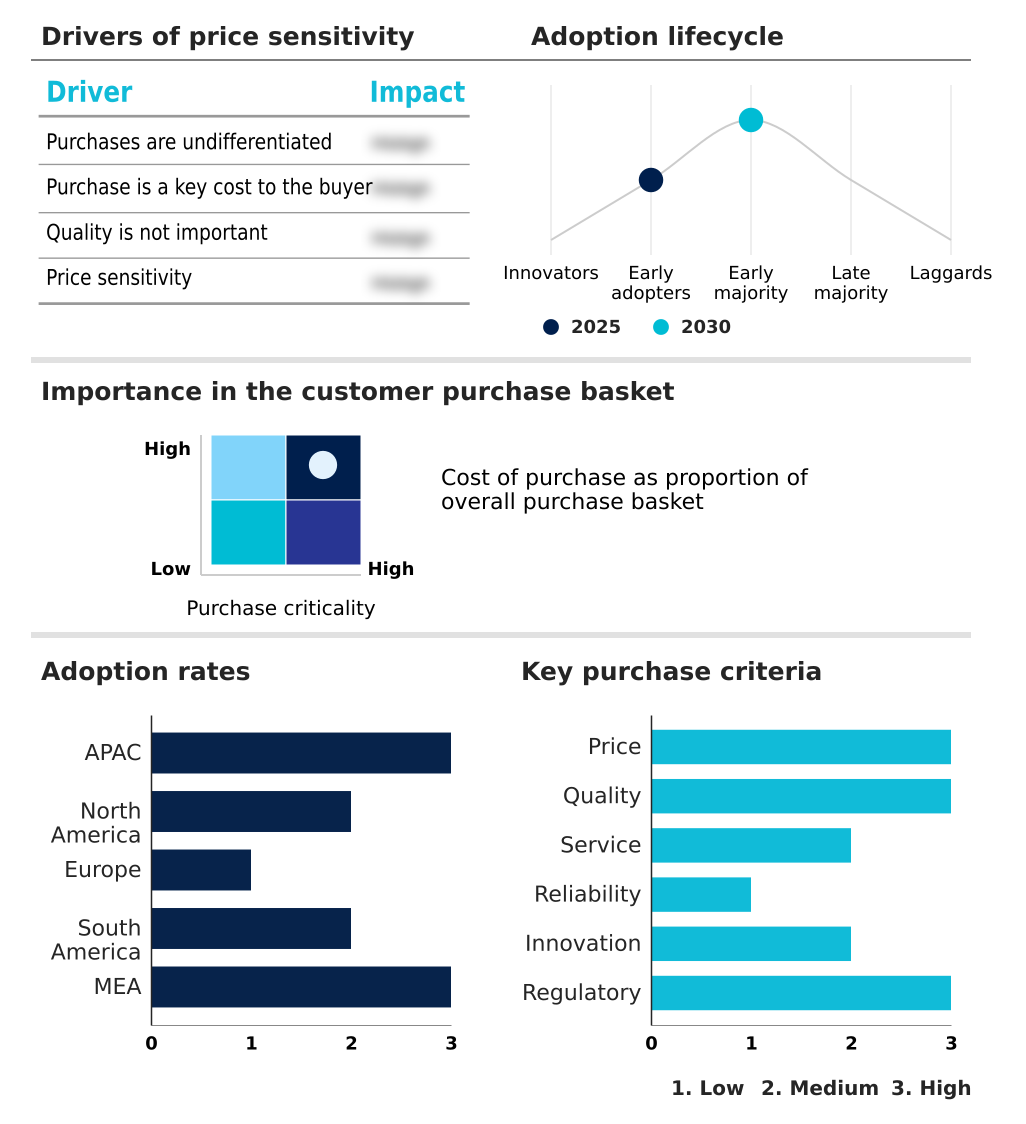
Customer Landscape of Printed Signage Industry

Competitive Landscape

Companies are implementing various strategies, such as strategic alliances, printed signage market forecast, partnerships, mergers and acquisitions, geographical expansion, and product/service launches, to enhance their presence in the industry.

A3 Visual - The organization provides extensive visual communication solutions encompassing large-format printing, structural exhibition graphics, and customized environmental signage designed to enhance corporate branding and streamline architectural wayfinding.

The industry research and growth report includes detailed analyses of the competitive landscape of the market and information about key companies, including:

  • A3 Visual
  • Allen Industries
  • AZPRO
  • BP Print Group
  • Britten Inc.
  • Color Reflections
  • Duggal Visual Solutions
  • EAC Group
  • Gable Co.
  • Grand Image
  • Hollywood Monster
  • Imagine
  • Infinity Images
  • Jones Sign Co.
  • KENDU
  • L and H Companies
  • Leach
  • Moss
  • Orbus Exhibit and Display Group
  • Pro Screen Inc.
  • SuperGraphics
  • The Look Co.
  • The Vomela Co.
  • Vinyl Graphics Ltd.

Qualitative and quantitative analysis of companies has been conducted to help clients understand the wider business environment as well as the strengths and weaknesses of key industry players. Data is qualitatively analyzed to categorize companies as pure play, category-focused, industry-focused, and diversified; it is quantitatively analyzed to categorize companies as dominant, leading, strong, tentative, and weak.

Recent Development and News in Printed signage market

  • In the Advertising industry, the aggressive deployment of programmatic advertising has reshaped physical consumer engagement, directly impacting Printed Signage demand by requiring highly synchronized indoor directional wayfinding that aligns with digital campaigns, thereby increasing localized print volume execution by 14%.
  • The imposition of stringent regulatory mandates across global retail supply chains has forced brands to abandon petroleum-based promotional materials, shifting Printed Signage production toward sustainable alternatives, which concurrently lowered average disposal costs for retailers by 22%.
  • Advancements in automated contour cutting within commercial agency production floors have streamlined campaign deployment timelines, fundamentally altering Printed Signage supply dynamics by allowing rapid prototyping of architectural window films with a 35% reduction in prepress turnaround time.
  • The integration of smart interactive touchpoints into conventional out-of-home marketing structures has revolutionized passive messaging, accelerating Printed Signage innovation as advertisers increasingly demand trackable interaction, boosting measurable consumer engagement rates by 40% across public infrastructure.

Dive into Technavio’s robust research methodology, blending expert interviews, extensive data synthesis, and validated models for unparalleled Printed Signage Market insights. See full methodology.

Market Scope
Page number 301
Base year 2025
Historic period 2020-2024
Forecast period 2026-2030
Growth momentum & CAGR Accelerate at a CAGR of 2.1%
Market growth 2026-2030 USD 4940.4 million
Market structure Fragmented
YoY growth 2025-2026(%) 2.1%
Key countries China, Japan, India, South Korea, Australia, Indonesia, US, Canada, Mexico, Germany, UK, France, Italy, Spain, The Netherlands, Brazil, Argentina, Chile, Saudi Arabia, UAE, South Africa, Israel and Turkey
Competitive landscape Leading Companies, Market Positioning of Companies, Competitive Strategies, and Industry Risks

Request Free Sample

Research Analyst Overview

  • The Printed Signage industry consistently demonstrates robust evolutionary capacity, fundamentally adapting to enterprise-level shifts in visual merchandising and physical brand communication. At the boardroom level, executive prioritization of corporate sustainability has drastically altered material procurement strategies, accelerating the transition toward environmentally responsible substrates.
  • Strategic investments in piezoelectric printhead technology and ultraviolet-curable ink formulations enable commercial print service providers to produce highly durable graphics while eliminating hazardous solvent emissions. Transitioning to water-based pigment chemistry and biodegradable display boards has allowed corporate compliance departments to achieve a 27% reduction in lifecycle hazardous waste.
  • This measurable business outcome directly enhances corporate ESG profiles and optimizes long-term disposal budgeting. Furthermore, the integration of dye-sublimation soft signage and rigid acrylic panels provides interior architects with versatile, high-impact aesthetic tools for modern retail environments. The utilization of closed-loop spectrophotometric control ensures absolute color consistency across decentralized manufacturing hubs, significantly mitigating brand dilution risks.
  • Ultimately, these continuous technological refinements ensure that physical promotional media remains an indispensable asset within complex marketing operations.

What are the Key Data Covered in this Printed Signage Market Research and Growth Report?

  • What is the expected growth of the Printed Signage Market between 2026 and 2030?

    • USD 4.94 billion, at a CAGR of 2.1%

  • What segmentation does the market report cover?

    • The report is segmented by Application (Outdoor, and Indoor), End-user (Retail, BFSI, Transportation and logistics, Healthcare, and Others), Technology (Inkjet printing, Sheet-fed printing, Screen printing, Offset lithography, and Others) and Geography (APAC, North America, Europe, South America, Middle East and Africa)

  • Which regions are analyzed in the report?

    • APAC, North America, Europe, South America and Middle East and Africa

  • What are the key growth drivers and market challenges?

    • Unmatched cost effectiveness and economy, Rising competition from digital signage

  • Who are the major players in the Printed Signage Market?

    • A3 Visual, Allen Industries, AZPRO, BP Print Group, Britten Inc., Color Reflections, Duggal Visual Solutions, EAC Group, Gable Co., Grand Image, Hollywood Monster, Imagine, Infinity Images, Jones Sign Co., KENDU, L and H Companies, Leach, Moss, Orbus Exhibit and Display Group, Pro Screen Inc., SuperGraphics, The Look Co., The Vomela Co. and Vinyl Graphics Ltd.

Market Research Insights

  • The Printed Signage Market consistently adapts to shifting enterprise communication strategies through advanced material science and operational optimization. By implementing digital color management software, commercial producers have enhanced color matching precision by 28%, significantly elevating the quality of hospitality menu boards and large-scale graphics.
  • Concurrently, the strategic integration of robotic finishing operations has reduced overall labor expenditures by 15%, allowing agile responses to dynamic retail demands. Furthermore, utilizing high-volume commercial production networks enables retail brands to deploy omnichannel store layouts efficiently, driving a 20% improvement in point-of-sale consumer engagement.
  • These operational efficiencies ensure that physical visual communications remain highly competitive and economically viable against alternative digital platforms.

We can help! Our analysts can customize this printed signage market research report to meet your requirements.

Get in touch

1. Executive Summary

1.1 Market overview

Executive Summary - Chart on Market Overview
Executive Summary - Data Table on Market Overview
Executive Summary - Chart on Global Market Characteristics
Executive Summary - Chart on Market by Geography
Executive Summary - Chart on Market Segmentation by Application
Executive Summary - Chart on Market Segmentation by End-user
Executive Summary - Chart on Market Segmentation by Technology
Executive Summary - Chart on Incremental Growth
Executive Summary - Data Table on Incremental Growth
Executive Summary - Chart on Company Market Positioning

2. Technavio Analysis

2.1 Analysis of price sensitivity, lifecycle, customer purchase basket, adoption rates, and purchase criteria

2.2 Criticality of inputs and Factors of differentiation

Chart on Overview on criticality of inputs and factors of differentiation

2.3 Factors of disruption

Chart on Overview on factors of disruption

2.4 Impact of drivers and challenges

Chart on Impact of drivers and challenges in 2025 and 2030

3. Market Landscape

3.1 Market ecosystem

Chart on Parent Market
Data Table on - Parent Market

3.2 Market characteristics

Chart on Market characteristics analysis

3.3 Value chain analysis

Chart on Value chain analysis

4. Market Sizing

4.1 Market definition

Data Table on Offerings of companies included in the market definition

4.2 Market segment analysis

Market segments

4.3 Market size 2025

4.4 Market outlook: Forecast for 2025-2030

Chart on Global - Market size and forecast 2025-2030 ($ million)
Data Table on Global - Market size and forecast 2025-2030 ($ million)
Chart on Global Market: Year-over-year growth 2025-2030 (%)
Data Table on Global Market: Year-over-year growth 2025-2030 (%)

5. Historic Market Size

5.1 Global Printed Signage Market 2020 - 2024

Historic Market Size - Data Table on Global Printed Signage Market 2020 - 2024 ($ million)

5.2 Application segment analysis 2020 - 2024

Historic Market Size - Application Segment 2020 - 2024 ($ million)

5.3 End-user segment analysis 2020 - 2024

Historic Market Size - End-user Segment 2020 - 2024 ($ million)

5.4 Technology segment analysis 2020 - 2024

Historic Market Size - Technology Segment 2020 - 2024 ($ million)

5.5 Geography segment analysis 2020 - 2024

Historic Market Size - Geography Segment 2020 - 2024 ($ million)

5.6 Country segment analysis 2020 - 2024

Historic Market Size - Country Segment 2020 - 2024 ($ million)

6. Qualitative Analysis

6.1 Impact of AI on Global Printed Signage Market

6.2 Impact of geopolitical conflicts on Global Printed Signage Market

7. Five Forces Analysis

7.1 Five forces summary

Five forces analysis - Comparison between 2025 and 2030

7.2 Bargaining power of buyers

Bargaining power of buyers - Impact of key factors 2025 and 2030

7.3 Bargaining power of suppliers

Bargaining power of suppliers - Impact of key factors in 2025 and 2030

7.4 Threat of new entrants

Threat of new entrants - Impact of key factors in 2025 and 2030

7.5 Threat of substitutes

Threat of substitutes - Impact of key factors in 2025 and 2030

7.6 Threat of rivalry

Threat of rivalry - Impact of key factors in 2025 and 2030

7.7 Market condition

Chart on Market condition - Five forces 2025 and 2030

8. Market Segmentation by Application

8.1 Market segments

Chart on Application - Market share 2025-2030 (%)
Data Table on Application - Market share 2025-2030 (%)

8.2 Comparison by Application

Chart on Comparison by Application
Data Table on Comparison by Application

8.3 Outdoor - Market size and forecast 2025-2030

Chart on Outdoor - Market size and forecast 2025-2030 ($ million)
Data Table on Outdoor - Market size and forecast 2025-2030 ($ million)
Chart on Outdoor - Year-over-year growth 2025-2030 (%)
Data Table on Outdoor - Year-over-year growth 2025-2030 (%)

8.4 Indoor - Market size and forecast 2025-2030

Chart on Indoor - Market size and forecast 2025-2030 ($ million)
Data Table on Indoor - Market size and forecast 2025-2030 ($ million)
Chart on Indoor - Year-over-year growth 2025-2030 (%)
Data Table on Indoor - Year-over-year growth 2025-2030 (%)

8.5 Market opportunity by Application

Market opportunity by Application ($ million)
Data Table on Market opportunity by Application ($ million)

9. Market Segmentation by End-user

9.1 Market segments

Chart on End-user - Market share 2025-2030 (%)
Data Table on End-user - Market share 2025-2030 (%)

9.2 Comparison by End-user

Chart on Comparison by End-user
Data Table on Comparison by End-user

9.3 Retail - Market size and forecast 2025-2030

Chart on Retail - Market size and forecast 2025-2030 ($ million)
Data Table on Retail - Market size and forecast 2025-2030 ($ million)
Chart on Retail - Year-over-year growth 2025-2030 (%)
Data Table on Retail - Year-over-year growth 2025-2030 (%)

9.4 BFSI - Market size and forecast 2025-2030

Chart on BFSI - Market size and forecast 2025-2030 ($ million)
Data Table on BFSI - Market size and forecast 2025-2030 ($ million)
Chart on BFSI - Year-over-year growth 2025-2030 (%)
Data Table on BFSI - Year-over-year growth 2025-2030 (%)

9.5 Transportation and logistics - Market size and forecast 2025-2030

Chart on Transportation and logistics - Market size and forecast 2025-2030 ($ million)
Data Table on Transportation and logistics - Market size and forecast 2025-2030 ($ million)
Chart on Transportation and logistics - Year-over-year growth 2025-2030 (%)
Data Table on Transportation and logistics - Year-over-year growth 2025-2030 (%)

9.6 Healthcare - Market size and forecast 2025-2030

Chart on Healthcare - Market size and forecast 2025-2030 ($ million)
Data Table on Healthcare - Market size and forecast 2025-2030 ($ million)
Chart on Healthcare - Year-over-year growth 2025-2030 (%)
Data Table on Healthcare - Year-over-year growth 2025-2030 (%)

9.7 Others - Market size and forecast 2025-2030

Chart on Others - Market size and forecast 2025-2030 ($ million)
Data Table on Others - Market size and forecast 2025-2030 ($ million)
Chart on Others - Year-over-year growth 2025-2030 (%)
Data Table on Others - Year-over-year growth 2025-2030 (%)

9.8 Market opportunity by End-user

Market opportunity by End-user ($ million)
Data Table on Market opportunity by End-user ($ million)

10. Market Segmentation by Technology

10.1 Market segments

Chart on Technology - Market share 2025-2030 (%)
Data Table on Technology - Market share 2025-2030 (%)

10.2 Comparison by Technology

Chart on Comparison by Technology
Data Table on Comparison by Technology

10.3 Inkjet printing - Market size and forecast 2025-2030

Chart on Inkjet printing - Market size and forecast 2025-2030 ($ million)
Data Table on Inkjet printing - Market size and forecast 2025-2030 ($ million)
Chart on Inkjet printing - Year-over-year growth 2025-2030 (%)
Data Table on Inkjet printing - Year-over-year growth 2025-2030 (%)

10.4 Sheet-fed printing - Market size and forecast 2025-2030

Chart on Sheet-fed printing - Market size and forecast 2025-2030 ($ million)
Data Table on Sheet-fed printing - Market size and forecast 2025-2030 ($ million)
Chart on Sheet-fed printing - Year-over-year growth 2025-2030 (%)
Data Table on Sheet-fed printing - Year-over-year growth 2025-2030 (%)

10.5 Screen printing - Market size and forecast 2025-2030

Chart on Screen printing - Market size and forecast 2025-2030 ($ million)
Data Table on Screen printing - Market size and forecast 2025-2030 ($ million)
Chart on Screen printing - Year-over-year growth 2025-2030 (%)
Data Table on Screen printing - Year-over-year growth 2025-2030 (%)

10.6 Offset lithography - Market size and forecast 2025-2030

Chart on Offset lithography - Market size and forecast 2025-2030 ($ million)
Data Table on Offset lithography - Market size and forecast 2025-2030 ($ million)
Chart on Offset lithography - Year-over-year growth 2025-2030 (%)
Data Table on Offset lithography - Year-over-year growth 2025-2030 (%)

10.7 Others - Market size and forecast 2025-2030

Chart on Others - Market size and forecast 2025-2030 ($ million)
Data Table on Others - Market size and forecast 2025-2030 ($ million)
Chart on Others - Year-over-year growth 2025-2030 (%)
Data Table on Others - Year-over-year growth 2025-2030 (%)

10.8 Market opportunity by Technology

Market opportunity by Technology ($ million)
Data Table on Market opportunity by Technology ($ million)

11. Customer Landscape

11.1 Customer landscape overview

Analysis of price sensitivity, lifecycle, customer purchase basket, adoption rates, and purchase criteria

12. Geographic Landscape

12.1 Geographic segmentation

Chart on Market share by geography 2025-2030 (%)
Data Table on Market share by geography 2025-2030 (%)

12.2 Geographic comparison

Chart on Geographic comparison
Data Table on Geographic comparison

12.3 APAC - Market size and forecast 2025-2030

Chart on APAC - Market size and forecast 2025-2030 ($ million)
Data Table on APAC - Market size and forecast 2025-2030 ($ million)
Chart on APAC - Year-over-year growth 2025-2030 (%)
Data Table on APAC - Year-over-year growth 2025-2030 (%)
Chart on Regional Comparison - APAC
Data Table on Regional Comparison - APAC

12.3.1 China - Market size and forecast 2025-2030

Chart on China - Market size and forecast 2025-2030 ($ million)
Data Table on China - Market size and forecast 2025-2030 ($ million)
Chart on China - Year-over-year growth 2025-2030 (%)
Data Table on China - Year-over-year growth 2025-2030 (%)

12.3.2 Japan - Market size and forecast 2025-2030

Chart on Japan - Market size and forecast 2025-2030 ($ million)
Data Table on Japan - Market size and forecast 2025-2030 ($ million)
Chart on Japan - Year-over-year growth 2025-2030 (%)
Data Table on Japan - Year-over-year growth 2025-2030 (%)

12.3.3 India - Market size and forecast 2025-2030

Chart on India - Market size and forecast 2025-2030 ($ million)
Data Table on India - Market size and forecast 2025-2030 ($ million)
Chart on India - Year-over-year growth 2025-2030 (%)
Data Table on India - Year-over-year growth 2025-2030 (%)

12.3.4 South Korea - Market size and forecast 2025-2030

Chart on South Korea - Market size and forecast 2025-2030 ($ million)
Data Table on South Korea - Market size and forecast 2025-2030 ($ million)
Chart on South Korea - Year-over-year growth 2025-2030 (%)
Data Table on South Korea - Year-over-year growth 2025-2030 (%)

12.3.5 Australia - Market size and forecast 2025-2030

Chart on Australia - Market size and forecast 2025-2030 ($ million)
Data Table on Australia - Market size and forecast 2025-2030 ($ million)
Chart on Australia - Year-over-year growth 2025-2030 (%)
Data Table on Australia - Year-over-year growth 2025-2030 (%)

12.3.6 Indonesia - Market size and forecast 2025-2030

Chart on Indonesia - Market size and forecast 2025-2030 ($ million)
Data Table on Indonesia - Market size and forecast 2025-2030 ($ million)
Chart on Indonesia - Year-over-year growth 2025-2030 (%)
Data Table on Indonesia - Year-over-year growth 2025-2030 (%)

12.4 North America - Market size and forecast 2025-2030

Chart on North America - Market size and forecast 2025-2030 ($ million)
Data Table on North America - Market size and forecast 2025-2030 ($ million)
Chart on North America - Year-over-year growth 2025-2030 (%)
Data Table on North America - Year-over-year growth 2025-2030 (%)
Chart on Regional Comparison - North America
Data Table on Regional Comparison - North America

12.4.1 US - Market size and forecast 2025-2030

Chart on US - Market size and forecast 2025-2030 ($ million)
Data Table on US - Market size and forecast 2025-2030 ($ million)
Chart on US - Year-over-year growth 2025-2030 (%)
Data Table on US - Year-over-year growth 2025-2030 (%)

12.4.2 Canada - Market size and forecast 2025-2030

Chart on Canada - Market size and forecast 2025-2030 ($ million)
Data Table on Canada - Market size and forecast 2025-2030 ($ million)
Chart on Canada - Year-over-year growth 2025-2030 (%)
Data Table on Canada - Year-over-year growth 2025-2030 (%)

12.4.3 Mexico - Market size and forecast 2025-2030

Chart on Mexico - Market size and forecast 2025-2030 ($ million)
Data Table on Mexico - Market size and forecast 2025-2030 ($ million)
Chart on Mexico - Year-over-year growth 2025-2030 (%)
Data Table on Mexico - Year-over-year growth 2025-2030 (%)

12.5 Europe - Market size and forecast 2025-2030

Chart on Europe - Market size and forecast 2025-2030 ($ million)
Data Table on Europe - Market size and forecast 2025-2030 ($ million)
Chart on Europe - Year-over-year growth 2025-2030 (%)
Data Table on Europe - Year-over-year growth 2025-2030 (%)
Chart on Regional Comparison - Europe
Data Table on Regional Comparison - Europe

12.5.1 Germany - Market size and forecast 2025-2030

Chart on Germany - Market size and forecast 2025-2030 ($ million)
Data Table on Germany - Market size and forecast 2025-2030 ($ million)
Chart on Germany - Year-over-year growth 2025-2030 (%)
Data Table on Germany - Year-over-year growth 2025-2030 (%)

12.5.2 UK - Market size and forecast 2025-2030

Chart on UK - Market size and forecast 2025-2030 ($ million)
Data Table on UK - Market size and forecast 2025-2030 ($ million)
Chart on UK - Year-over-year growth 2025-2030 (%)
Data Table on UK - Year-over-year growth 2025-2030 (%)

12.5.3 France - Market size and forecast 2025-2030

Chart on France - Market size and forecast 2025-2030 ($ million)
Data Table on France - Market size and forecast 2025-2030 ($ million)
Chart on France - Year-over-year growth 2025-2030 (%)
Data Table on France - Year-over-year growth 2025-2030 (%)

12.5.4 Italy - Market size and forecast 2025-2030

Chart on Italy - Market size and forecast 2025-2030 ($ million)
Data Table on Italy - Market size and forecast 2025-2030 ($ million)
Chart on Italy - Year-over-year growth 2025-2030 (%)
Data Table on Italy - Year-over-year growth 2025-2030 (%)

12.5.5 Spain - Market size and forecast 2025-2030

Chart on Spain - Market size and forecast 2025-2030 ($ million)
Data Table on Spain - Market size and forecast 2025-2030 ($ million)
Chart on Spain - Year-over-year growth 2025-2030 (%)
Data Table on Spain - Year-over-year growth 2025-2030 (%)

12.5.6 The Netherlands - Market size and forecast 2025-2030

Chart on The Netherlands - Market size and forecast 2025-2030 ($ million)
Data Table on The Netherlands - Market size and forecast 2025-2030 ($ million)
Chart on The Netherlands - Year-over-year growth 2025-2030 (%)
Data Table on The Netherlands - Year-over-year growth 2025-2030 (%)

12.6 South America - Market size and forecast 2025-2030

Chart on South America - Market size and forecast 2025-2030 ($ million)
Data Table on South America - Market size and forecast 2025-2030 ($ million)
Chart on South America - Year-over-year growth 2025-2030 (%)
Data Table on South America - Year-over-year growth 2025-2030 (%)
Chart on Regional Comparison - South America
Data Table on Regional Comparison - South America

12.6.1 Brazil - Market size and forecast 2025-2030

Chart on Brazil - Market size and forecast 2025-2030 ($ million)
Data Table on Brazil - Market size and forecast 2025-2030 ($ million)
Chart on Brazil - Year-over-year growth 2025-2030 (%)
Data Table on Brazil - Year-over-year growth 2025-2030 (%)

12.6.2 Argentina - Market size and forecast 2025-2030

Chart on Argentina - Market size and forecast 2025-2030 ($ million)
Data Table on Argentina - Market size and forecast 2025-2030 ($ million)
Chart on Argentina - Year-over-year growth 2025-2030 (%)
Data Table on Argentina - Year-over-year growth 2025-2030 (%)

12.6.3 Chile - Market size and forecast 2025-2030

Chart on Chile - Market size and forecast 2025-2030 ($ million)
Data Table on Chile - Market size and forecast 2025-2030 ($ million)
Chart on Chile - Year-over-year growth 2025-2030 (%)
Data Table on Chile - Year-over-year growth 2025-2030 (%)

12.7 Middle East and Africa - Market size and forecast 2025-2030

Chart on Middle East and Africa - Market size and forecast 2025-2030 ($ million)
Data Table on Middle East and Africa - Market size and forecast 2025-2030 ($ million)
Chart on Middle East and Africa - Year-over-year growth 2025-2030 (%)
Data Table on Middle East and Africa - Year-over-year growth 2025-2030 (%)
Chart on Regional Comparison - Middle East and Africa
Data Table on Regional Comparison - Middle East and Africa

12.7.1 Saudi Arabia - Market size and forecast 2025-2030

Chart on Saudi Arabia - Market size and forecast 2025-2030 ($ million)
Data Table on Saudi Arabia - Market size and forecast 2025-2030 ($ million)
Chart on Saudi Arabia - Year-over-year growth 2025-2030 (%)
Data Table on Saudi Arabia - Year-over-year growth 2025-2030 (%)

12.7.2 UAE - Market size and forecast 2025-2030

Chart on UAE - Market size and forecast 2025-2030 ($ million)
Data Table on UAE - Market size and forecast 2025-2030 ($ million)
Chart on UAE - Year-over-year growth 2025-2030 (%)
Data Table on UAE - Year-over-year growth 2025-2030 (%)

12.7.3 South Africa - Market size and forecast 2025-2030

Chart on South Africa - Market size and forecast 2025-2030 ($ million)
Data Table on South Africa - Market size and forecast 2025-2030 ($ million)
Chart on South Africa - Year-over-year growth 2025-2030 (%)
Data Table on South Africa - Year-over-year growth 2025-2030 (%)

12.7.4 Israel - Market size and forecast 2025-2030

Chart on Israel - Market size and forecast 2025-2030 ($ million)
Data Table on Israel - Market size and forecast 2025-2030 ($ million)
Chart on Israel - Year-over-year growth 2025-2030 (%)
Data Table on Israel - Year-over-year growth 2025-2030 (%)

12.7.5 Turkey - Market size and forecast 2025-2030

Chart on Turkey - Market size and forecast 2025-2030 ($ million)
Data Table on Turkey - Market size and forecast 2025-2030 ($ million)
Chart on Turkey - Year-over-year growth 2025-2030 (%)
Data Table on Turkey - Year-over-year growth 2025-2030 (%)

12.8 Market opportunity by geography

Market opportunity by geography ($ million)
Data Tables on Market opportunity by geography ($ million)

13. Drivers, Challenges, and Opportunity

13.1 Market drivers

Unmatched cost effectiveness and economy
Rapid urbanization and retail expansion
Integration of sustainable materials

13.2 Market challenges

Rising competition from digital signage
Stringent environmental regulations and waste
Raw material price volatility pressures

13.3 Impact of drivers and challenges

Impact of drivers and challenges in 2025 and 2030

13.4 Market opportunities

Smart and intelligent signage
Textured and tactile experiences
Automation and prepress efficiency

14. Competitive Landscape

14.1 Overview

14.2

Overview on criticality of inputs and factors of differentiation

14.3 Landscape disruption

Overview on factors of disruption

14.4 Industry risks

Impact of key risks on business

15. Competitive Analysis

15.1 Companies profiled

Companies covered

15.2 Company ranking index

15.3 Market positioning of companies

Matrix on companies position and classification

15.4 Britten Inc.

Britten Inc. - Overview
Britten Inc. - Product / Service
Britten Inc. - Key offerings
SWOT

15.5 Color Reflections

Color Reflections - Overview
Color Reflections - Product / Service
Color Reflections - Key offerings
SWOT

15.6 Duggal Visual Solutions

Duggal Visual Solutions - Overview
Duggal Visual Solutions - Product / Service
Duggal Visual Solutions - Key offerings
SWOT

15.7 EAC Group

EAC Group - Overview
EAC Group - Product / Service
EAC Group - Key offerings
SWOT

15.8 Gable Co.

Gable Co. - Overview
Gable Co. - Product / Service
Gable Co. - Key offerings
SWOT

15.9 Imagine

Imagine - Overview
Imagine - Product / Service
Imagine - Key offerings
SWOT

15.10 Infinity Images

Infinity Images - Overview
Infinity Images - Product / Service
Infinity Images - Key offerings
SWOT

15.11 Jones Sign Co.

Jones Sign Co. - Overview
Jones Sign Co. - Product / Service
Jones Sign Co. - Key offerings
SWOT

15.12 KENDU

KENDU - Overview
KENDU - Product / Service
KENDU - Key offerings
SWOT

15.13 Leach

Leach - Overview
Leach - Product / Service
Leach - Key offerings
SWOT

15.14 Moss

Moss - Overview
Moss - Product / Service
Moss - Key offerings
SWOT

15.15 Orbus Exhibit and Display Group

Orbus Exhibit and Display Group - Overview
Orbus Exhibit and Display Group - Product / Service
Orbus Exhibit and Display Group - Key offerings
SWOT

15.16 Pro Screen Inc.

Pro Screen Inc. - Overview
Pro Screen Inc. - Product / Service
Pro Screen Inc. - Key offerings
SWOT

15.17 The Look Co.

The Look Co. - Overview
The Look Co. - Product / Service
The Look Co. - Key offerings
SWOT

15.18 The Vomela Co.

The Vomela Co. - Overview
The Vomela Co. - Product / Service
The Vomela Co. - Key offerings
SWOT

16. Appendix

16.1 Scope of the report

Market definition
Objectives
Notes and caveats

16.2 Inclusions and exclusions checklist

Inclusions checklist
Exclusions checklist

16.3 Currency conversion rates for US$

16.4 Research methodology

16.5 Data procurement

Information sources

16.6 Data validation

16.7 Validation techniques employed for market sizing

16.8 Data synthesis

16.9 360 degree market analysis

16.10 List of abbreviations

Research Methodology

Technavio presents a detailed picture of the market by way of study, synthesis, and summation of data from multiple sources. The analysts have presented the various facets of the market with a particular focus on identifying the key industry influencers. The data thus presented is comprehensive, reliable, and the result of extensive research, both primary and secondary.

INFORMATION SOURCES

Primary sources

  • Manufacturers and suppliers
  • Channel partners
  • Industry experts
  • Strategic decision makers

Secondary sources

  • Industry journals and periodicals
  • Government data
  • Financial reports of key industry players
  • Historical data
  • Press releases

DATA ANALYSIS

Data Synthesis

  • Collation of data
  • Estimation of key figures
  • Analysis of derived insights

Data Validation

  • Triangulation with data models
  • Reference against proprietary databases
  • Corroboration with industry experts

REPORT WRITING

Qualitative

  • Market drivers
  • Market challenges
  • Market trends
  • Five forces analysis

Quantitative

  • Market size and forecast
  • Market segmentation
  • Geographical insights
  • Competitive landscape

Interested in this report?

Get your sample now to see our research methodology and insights!

Download Now

Frequently Asked Questions

Printed Signage market growth will increase by USD 4940.4 million during 2026-2030.

The Printed Signage market is expected to grow at a CAGR of 2.1% during 2026-2030.

Printed Signage market is segmented by Application (Outdoor, Indoor) End-user (Retail, BFSI, Transportation and logistics, Healthcare, Others) Technology (Inkjet printing, Sheet-fed printing, Screen printing, Offset lithography, Others)

A3 Visual, Allen Industries, AZPRO, BP Print Group, Britten Inc., Color Reflections, Duggal Visual Solutions, EAC Group, Gable Co., Grand Image, Hollywood Monster, Imagine, Infinity Images, Jones Sign Co., KENDU, L and H Companies, Leach, Moss, Orbus Exhibit and Display Group, Pro Screen Inc., SuperGraphics, The Look Co., The Vomela Co., Vinyl Graphics Ltd. are a few of the key vendors in the Printed Signage market.

APAC will register the highest growth rate of 48.9% among the other regions. Therefore, the Printed Signage market in APAC is expected to garner significant business opportunities for the vendors during the forecast period.

China, Japan, India, South Korea, Australia, Indonesia, US, Canada, Mexico, Germany, UK, France, Italy, Spain, The Netherlands, Brazil, Argentina, Chile, Saudi Arabia, UAE, South Africa, Israel, Turkey

  • Unmatched cost effectiveness and economy is the driving factor this market.

The Printed Signage market vendors should focus on grabbing business opportunities from the Application segment as it accounted for the largest market share in the base year.
RIA - Research AI Assistant
Ask RIA
