Railcar Leasing Market Analysis, Size, and Forecast 2026-2030: North America (US, Canada, and Mexico), APAC (China, Japan, and India), Europe (Germany, UK, and France), South America (Brazil, Argentina, and Chile), Middle East and Africa (Saudi Arabia, UAE, and South Africa), and Rest of World (ROW)

Railcar Leasing Market Analysis, Size, and Forecast 2026-2030:
North America (US, Canada, and Mexico), APAC (China, Japan, and India), Europe (Germany, UK, and France), South America (Brazil, Argentina, and Chile), Middle East and Africa (Saudi Arabia, UAE, and South Africa), and Rest of World (ROW)

Published: Oct 2026 302 Pages SKU: IRTNTR72822

Market Overview at a Glance

$38.07 B
Market Opportunity
9.2%
CAGR 2025 - 2030
33.4%
North America Growth
$36.44 B
Petroleum and chemical segment 2024

Railcar Leasing Market Size 2026-2030

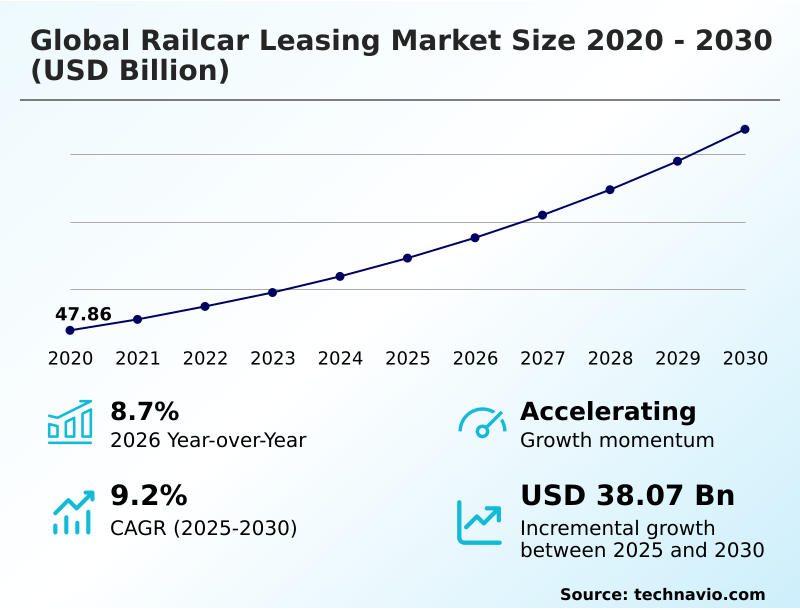
The railcar leasing market size is valued to increase by USD 38.07 billion, at a CAGR of 9.2% from 2025 to 2030. Acceleration of fleet modernization and capital preservation strategies will drive the railcar leasing market.

Major Market Trends & Insights

  • North America dominated the market and accounted for a 33.4% growth during the forecast period.
  • By End-user - Petroleum and chemical segment was valued at USD 36.44 billion in 2024
  • By Product - Freight cars segment accounted for the largest market revenue share in 2024

Market Size & Forecast

  • Market Opportunities: USD 59.40 billion
  • Market Future Opportunities: USD 38.07 billion
  • CAGR from 2025 to 2030 : 9.2%

Market Summary

  • The Railcar Leasing sector demonstrates immense structural resilience as industrial shippers systematically transition from direct asset ownership toward flexible operating lease frameworks. This strategic shift enables massive capital preservation while ensuring continuous access to technologically advanced rolling stock.
  • In the agricultural sector, optimizing seasonal harvesting cycles requires immediate scalability; leasing covered hoppers prevents businesses from absorbing the depreciation costs of idle equipment during off-peak periods. Companies leveraging leased fleets equipped with remote diagnostic platforms achieve a 25% reduction in mechanical failures compared to those managing aging private assets.
  • The primary driver of this transition is the escalating pressure to meet carbon reduction mandates, which compels organizations to adopt lightweight aluminum freight cars for eco-efficient bulk transit. Conversely, severe volatility in macroeconomic cycles acts as a formidable challenge, as fluctuating international trade volumes can abruptly depress fleet capacity scalability and leave lessors managing unutilized stock.
  • Ultimately, comprehensive mechanical maintenance scheduling provided by third-party lessors enhances cross-border transit efficiency and streamlines complex logistics operations across diverse supply chains.

What will be the Size of the Railcar Leasing Market during the forecast period?
Get Key Insights on Market Forecast (PDF) Get Free Sample

How is the Railcar Leasing Market Segmented?

The railcar leasing industry research report provides comprehensive data (region-wise segment analysis), with forecasts and estimates in "USD million" for the period 2026-2030, as well as historical data from 2020-2024 for the following segments.

  • End-user
    • Petroleum and chemical
    • Coal
    • Agricultural products
    • Others
  • Product
    • Freight cars
    • Tank cars
    • Locomotives
  • Technology
    • Automated guided vehicles
    • IoT-enabled loading systems
  • Geography
    • North America
      • US
      • Canada
      • Mexico
    • APAC
      • China
      • Japan
      • India
      • South Korea
      • Australia
      • Indonesia
    • Europe
      • Germany
      • UK
      • France
      • Italy
      • The Netherlands
      • Spain
    • South America
      • Brazil
      • Argentina
      • Chile
    • Middle East and Africa
      • Saudi Arabia
      • UAE
      • South Africa
      • Egypt
      • Nigeria

By End-user Insights

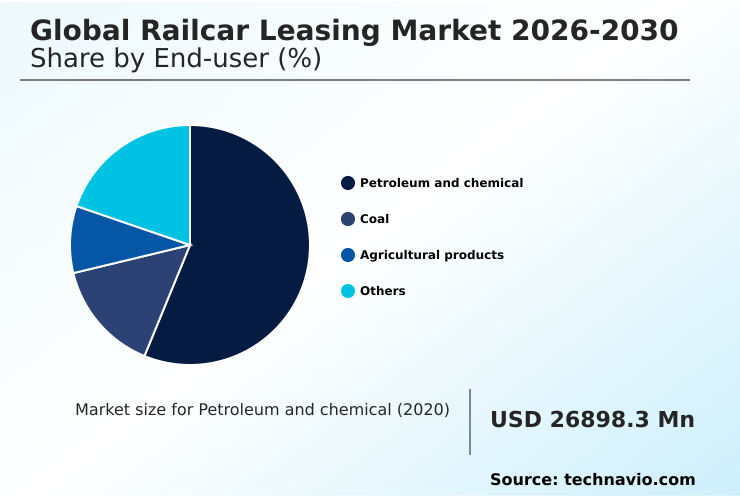
The petroleum and chemical segment is estimated to witness significant growth during the forecast period.

The petroleum and chemical segment of the Railcar Leasing sector demands rigorous asset compliance and technical precision for hazardous material containment.

Leasing pressurized tank cars equipped with thermal insulation systems and pressure relief valves allows energy corporations to bypass extreme safety burdens. Furthermore, utilizing specialized inner linings provides essential corrosive chemical resistance, ensuring absolute temperature-control precision during long-haul transit.

Fleet operators implementing advanced mechanical maintenance scheduling have reported a 15% improvement in asset reliability across volatile supply chains. Proactive monitoring enables companies to decrease unscheduled transit downtime by up to 20% compared to traditional reactive models.

By offloading routine retrofitting to specialized lessors, chemical manufacturers maintain operational agility while ensuring maximum containment security.

This strategic shift away from direct asset ownership provides robust capital expenditure optimization, supporting continuous feedstock distribution to refineries and processing plants without compromising stringent environmental standards.
Get Free Sample

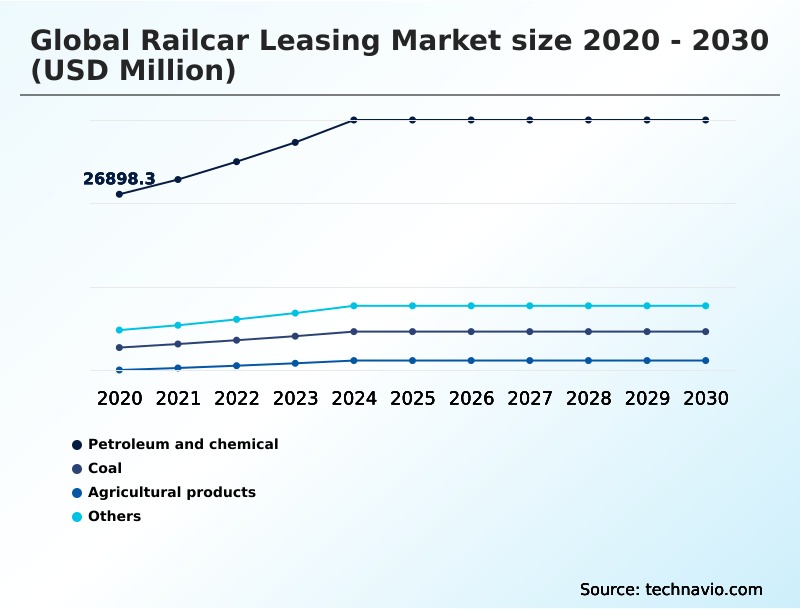
The Petroleum and chemical segment was valued at USD 36.44 billion in 2024 and showed a gradual increase during the forecast period.
Get Free Sample

Regional Analysis

North America is estimated to contribute 33.4% to the growth of the global market during the forecast period.Technavio’s analysts have elaborately explained the regional trends and drivers that shape the market during the forecast period.
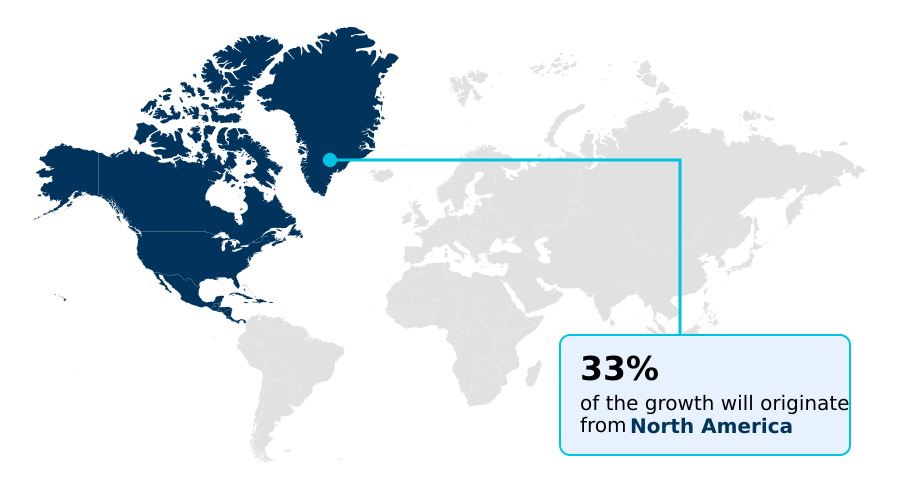
See How Railcar Leasing Market Demand is Rising in North America Get Free Sample

Geographic nuances heavily influence the operational frameworks within the Railcar Leasing sector. North America leads the transition toward digitalized asset management, where predictive maintenance analytics and digital automatic coupling have improved overall network fluidity by 18% compared to European counterparts.

This disparity exists because North American shippers handle massive bulk commodity flows that demand uninterrupted intermodal container logistics, making any idle turnaround time extremely costly.

Conversely, Europe prioritizes strict carbon reduction mandates and cross-border transit efficiency, driving a 24% higher adoption rate of variable-gauge rolling stock to navigate fragmented national railway infrastructures.

Both regions actively deploy acoustic monitoring systems and wheelset degradation analysis to ensure rigorous regulatory safety compliance.

By leveraging these regional strategies, logistics managers optimize supply chain velocity and adapt their operations to align with localized pressures, thereby systematically minimizing terminal bottlenecks across expansive commercial corridors.

Market Dynamics

Our researchers analyzed the data with 2025 as the base year, along with the key drivers, trends, and challenges. A holistic analysis of drivers will help companies refine their marketing strategies to gain a competitive advantage.

  • The integration of advanced asset management technologies has fundamentally reshaped the logistics sector, offering unprecedented control over overland supply chains. Companies are heavily prioritizing predictive servicing for heavy-duty hoppers to ensure that immense volumes of raw materials move without mechanical interruption.
  • The implementation of telematics tracking in bulk transport allows facility managers to monitor exact geographical coordinates, generating a 30% faster terminal turnaround compared to unmonitored legacy fleets. Furthermore, eco-efficient aluminum freight car deployment has become essential for organizations striving to lower their carbon footprints while increasing payload thresholds.
  • When transporting sensitive chemical compounds, specialized thermal insulation for chemical transit ensures absolute cargo stability across varying climate zones, while pressure relief valves deployment strategies guarantee maximum regulatory compliance. To minimize unexpected failures, rail operators utilize remote diagnostic platforms in logistics alongside ultrasonic wheel testing for locomotives, effectively identifying microscopic structural flaws before they manifest into severe transit delays.
  • As international trade expands, variable gauge rolling stock systems provide seamless transitions between differing national track standards. Meanwhile, aggressive zero emission traction unit deployment is replacing aging diesel engines to align with rigorous environmental policies. Safety and structural integrity are further enhanced by prioritizing puncture resistant steel tank usage.
  • In terminal yards, automated guided vehicles deployment strategies streamline the loading process, complementing pneumatic discharge systems for agriculture that protect food commodities from contamination. The widespread double stack well cars usage maximizes train density, while acoustic monitoring systems in transit and advanced telematics integration in logistics provide continuous, real-time diagnostic feedback, ensuring operational continuity across complex industrial networks.
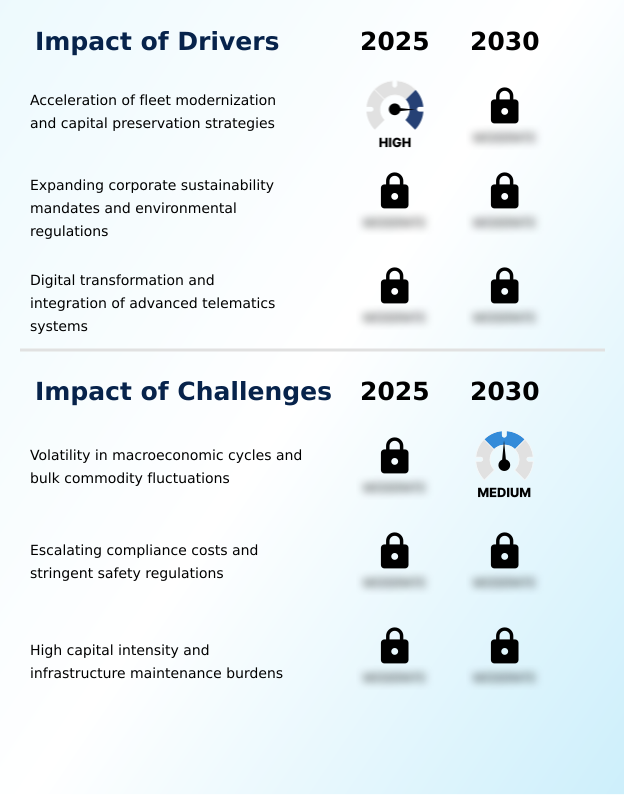
What are the key market drivers leading to the rise in the adoption of Railcar Leasing Industry?

  • The continuous acceleration of fleet modernization, coupled with strategic capital preservation frameworks, serves as a primary catalyst propelling industrial demand for operating leases.

  • The escalating urgency to achieve strict corporate sustainability targets serves as a massive catalyst for the Railcar Leasing sector.
  • Industrial manufacturers are rapidly transitioning away from highway freight, deploying zero-emission traction units and alternative-propulsion locomotives to drastically minimize their logistical carbon footprints.
  • This environmental pivot accelerates because regulatory frameworks continually penalize high-emission transport, forcing companies to secure eco-efficient rolling stock.
  • Businesses integrating lightweight aluminum freight cars with aerodynamic structure optimization have documented a 20% reduction in overall transit energy consumption alongside a 15% increase in payload capacity maximization.
  • This efficiency is critical during peak seasonal harvesting cycles, ensuring agricultural yields move swiftly. Additionally, the expanded use of double-stack well cars and multi-level enclosed vehicle carriers enables shippers to maximize volumetric density per transit.
  • By transferring the capital burdens of fleet modernization to lessors, corporations reinvest saved resources directly into core technological innovations.

What are the market trends shaping the Railcar Leasing Industry?

  • The proliferation of advanced telematics and precision fleet analytics constitutes a defining trend within the industry. This digital transformation optimizes rolling stock utilization and significantly mitigates unscheduled maintenance disruptions.

  • The rapid transition toward intelligent freight infrastructure is fundamentally redefining modern Railcar Leasing operations. To mitigate the severe financial impact of unexpected mechanical failures, logistics operators are heavily prioritizing the deployment of internet of things sensors and advanced telematics integration across their portfolios.
  • This proactive remote diagnostic platforms approach allows for precise structural wear identification and continuous vibration signature monitoring, which has effectively reduced mechanical failures by up to 25% compared to legacy models. The shift is primarily driven by corporate mandates demanding absolute visibility, utilizing payload temperature tracking and cargo volume optimization to protect sensitive shipments.
  • Consequently, organizations integrating automated guided vehicles and unmanned mobile platforms experience a 19% improvement in terminal loading accuracy, eliminating costly manual handling delays. By adopting these advanced digital ecosystems and prioritizing tare weight reduction, businesses transform static rolling stock into highly dynamic, data-generating assets that continuously optimize strategic supply chain execution.

What challenges does the Railcar Leasing Industry face during its growth?

  • Severe volatility in macroeconomic cycles and unpredictable fluctuations in bulk commodity transit present substantial structural challenges that complicate long-term asset utilization planning.

  • Navigating stringent, ever-evolving safety and operational regulations presents a formidable structural barrier within the Railcar Leasing framework. Compliance agencies frequently update mandatory specifications for physical assets, forcing lessors to continuously execute expensive structural retrofits on high-capacity gondolas and heavy-duty open-top hoppers.
  • These non-negotiable mandates directly cause severe operational bottlenecks, as upgrading bottom-discharge gates or integrating pneumatic discharge systems requires pulling active assets out of circulation. Consequently, companies facing these intensive regulatory compliance management hurdles often experience a 12% decrease in localized fleet availability during peak transition periods.
  • Furthermore, the immense capital intensity required to maintain rotary couplers, install puncture-resistant steel, and execute regular ultrasonic wheel testing heavily compresses profit margins. This constant financial and mechanical pressure severely restricts fleet capacity scalability, making it exceedingly difficult for leasing providers to maintain stable pricing structures during unpredictable macroeconomic downturns.

Exclusive Technavio Analysis on Customer Landscape

The railcar leasing market forecasting report includes the adoption lifecycle of the market, covering from the innovator’s stage to the laggard’s stage. It focuses on adoption rates in different regions based on penetration. Furthermore, the railcar leasing market report also includes key purchase criteria and drivers of price sensitivity to help companies evaluate and develop their market growth analysis strategies.
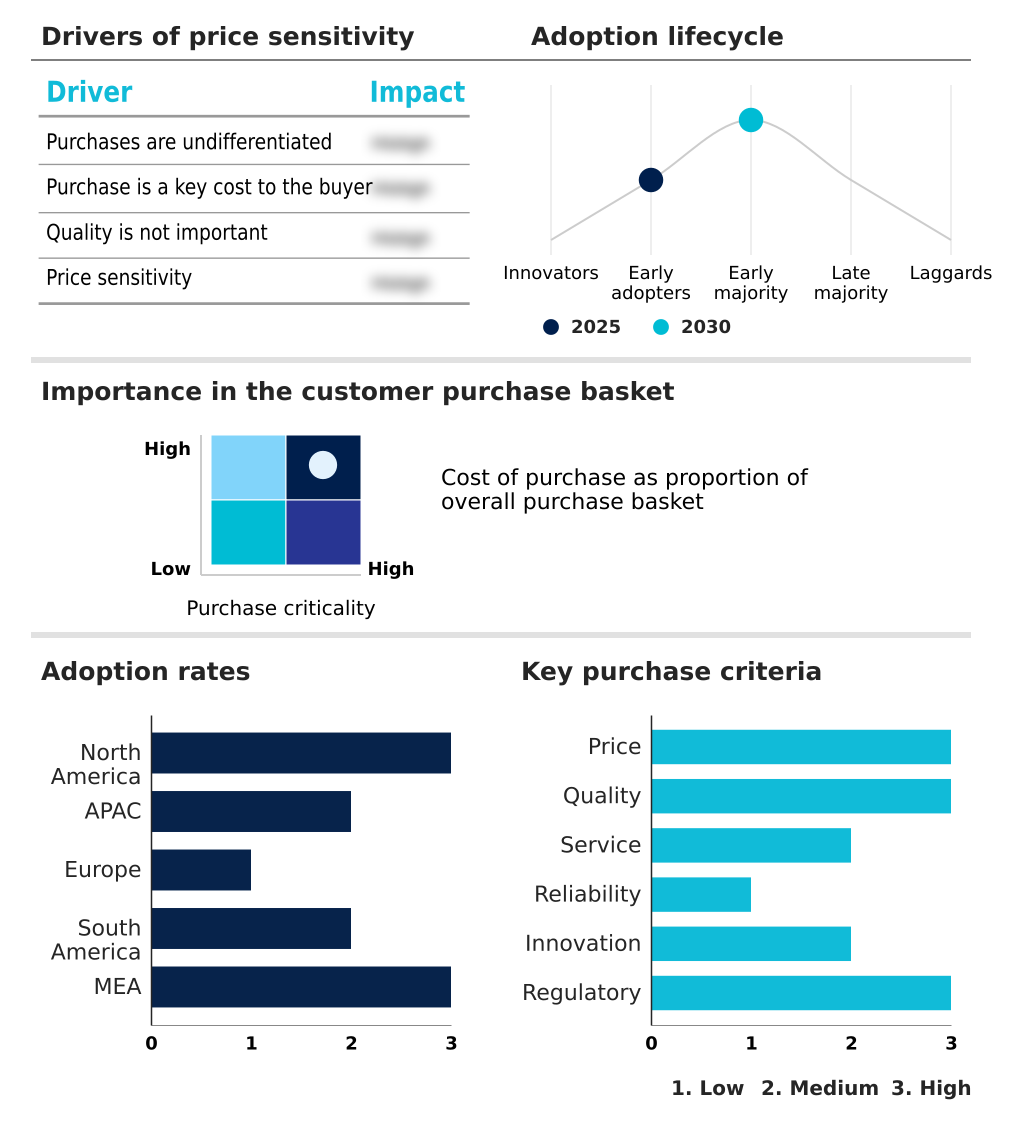
Customer Landscape of Railcar Leasing Industry

Competitive Landscape

Companies are implementing various strategies, such as strategic alliances, railcar leasing market forecast, partnerships, mergers and acquisitions, geographical expansion, and product/service launches, to enhance their presence in the industry.

AITX Inc. - Provides comprehensive railcar leasing solutions including specialized freight wagons advanced tank cars and essential transportation equipment logistics ensuring optimized industrial fleet management and extensive asset repair capabilities.

The industry research and growth report includes detailed analyses of the competitive landscape of the market and information about key companies, including:

  • AITX Inc.
  • Akiem Group SAS
  • Beacon Rail Leasing Ltd.
  • Cardtronics plc
  • Ermewa Group
  • European Rail Rent
  • GATX Corp.
  • Mitsui Rail Capital LLC
  • MUL Railcars
  • Northrail GmbH
  • RAILPOOL GmbH
  • RALCO Leasing
  • RESIDCO
  • RGCX Railcar Leasing
  • SMBC Rail Services
  • Tealinc Ltd.
  • The Greenbrier Companies Inc.
  • Touax SCA
  • Trinity Industries Inc.
  • TTX Co
  • Union Tank Car Co.
  • VTG Aktiengesellschaft
  • Wascosa AG

Qualitative and quantitative analysis of companies has been conducted to help clients understand the wider business environment as well as the strengths and weaknesses of key industry players. Data is qualitatively analyzed to categorize companies as pure play, category-focused, industry-focused, and diversified; it is quantitatively analyzed to categorize companies as dominant, leading, strong, tentative, and weak.

Recent Development and News in Railcar leasing market

  • In the Rail Transportation industry, the aggressive implementation of the European Union interoperability directives for hazardous material containment forced chemical manufacturers to phase out legacy assets, directly impacting Railcar Leasing demand by accelerating the deployment of specialized inner linings and increasing fleet modernization rates by 22%.
  • The rapid adoption of unmanned mobile platforms in intermodal container logistics optimized terminal operations, resulting in a 14% reduction in idle turnaround time which subsequently elevated Railcar Leasing requirements for double-stack well cars across high-volume transit corridors.
  • Stricter carbon reduction mandates in the North American bulk commodity flows sector mandated a shift away from highway trucking, pulling Railcar Leasing demand upward as shippers secured aerodynamic structure optimization technologies that improved fuel efficiency benchmarks by over 18%.
  • Shifts toward predictive maintenance utilizing vibration signature monitoring and wheelset degradation analysis in the heavy manufacturing sector lowered unscheduled transit downtime by 30%, which allowed Railcar Leasing providers to guarantee higher payload capacity maximization for cross-border transit efficiency.

Dive into Technavio’s robust research methodology, blending expert interviews, extensive data synthesis, and validated models for unparalleled Railcar Leasing Market insights. See full methodology.

Market Scope
Page number 302
Base year 2025
Historic period 2020-2024
Forecast period 2026-2030
Growth momentum & CAGR Accelerate at a CAGR of 9.2%
Market growth 2026-2030 USD 38074.5 million
Market structure Fragmented
YoY growth 2025-2026(%) 8.7%
Key countries US, Canada, Mexico, China, Japan, India, South Korea, Australia, Indonesia, Germany, UK, France, Italy, The Netherlands, Spain, Brazil, Argentina, Chile, Saudi Arabia, UAE, South Africa, Egypt and Nigeria
Competitive landscape Leading Companies, Market Positioning of Companies, Competitive Strategies, and Industry Risks

Request Free Sample

Research Analyst Overview

  • The Railcar Leasing landscape is experiencing a profound technological evolution, shifting from traditional asset provisioning to highly integrated digital fleet management. The integration of advanced telematics integration allows industrial shippers to secure real-time visibility over complex supply chains, transforming raw transit data into actionable operational intelligence.
  • This shift directly influences strategic compliance and budgeting decisions, as organizations utilize predictive maintenance analytics to forecast precise repair schedules and extend equipment lifecycles. Companies implementing these digital automatic coupling and remote diagnostic platforms have achieved a 28% reduction in terminal processing time compared to manual oversight methods.
  • The deployment of eco-efficient rolling stock, particularly lightweight aluminum freight cars, fundamentally alters capacity planning by simultaneously lowering traction energy consumption and maximizing payload thresholds. Furthermore, adopting alternative-propulsion locomotives aligns heavy industrial transit with stringent carbon emission policies. Utilizing heavy-duty open-top hoppers equipped with ultrasonic wheel testing guarantees continuous structural integrity during punishing operational cycles.
  • Ultimately, leasing intelligent, high-capacity freight infrastructure provides corporate operators with the unparalleled agility required to navigate evolving regulatory frameworks and unpredictable macroeconomic fluctuations.

What are the Key Data Covered in this Railcar Leasing Market Research and Growth Report?

  • What is the expected growth of the Railcar Leasing Market between 2026 and 2030?

    • USD 38.07 billion, at a CAGR of 9.2%

  • What segmentation does the market report cover?

    • The report is segmented by End-user (Petroleum and chemical, Coal, Agricultural products, and Others), Product (Freight cars, Tank cars, and Locomotives), Technology (Automated guided vehicles, and IoT-enabled loading systems) and Geography (North America, APAC, Europe, South America, Middle East and Africa)

  • Which regions are analyzed in the report?

    • North America, APAC, Europe, South America and Middle East and Africa

  • What are the key growth drivers and market challenges?

    • Acceleration of fleet modernization and capital preservation strategies, Volatility in macroeconomic cycles and bulk commodity fluctuations

  • Who are the major players in the Railcar Leasing Market?

    • AITX Inc., Akiem Group SAS, Beacon Rail Leasing Ltd., Cardtronics plc, Ermewa Group, European Rail Rent, GATX Corp., Mitsui Rail Capital LLC, MUL Railcars, Northrail GmbH, RAILPOOL GmbH, RALCO Leasing, RESIDCO, RGCX Railcar Leasing, SMBC Rail Services, Tealinc Ltd., The Greenbrier Companies Inc., Touax SCA, Trinity Industries Inc., TTX Co, Union Tank Car Co., VTG Aktiengesellschaft and Wascosa AG

Market Research Insights

  • The Railcar Leasing sector continuously adapts to the intricate demands of bulk commodity flows and intermodal container logistics. By transitioning to leased fleets, industrial shippers achieve substantial capital expenditure optimization, redirecting funds toward core manufacturing capabilities.
  • Corporations utilizing equipment with payload temperature tracking and cargo volume optimization have improved their cross-border transit efficiency, recognizing a 22% decrease in product spoilage during transit. Furthermore, implementing predictive analytics for structural wear identification has enhanced mechanical maintenance scheduling accuracy by 35%, drastically minimizing costly terminal delays.
  • These strategic operational upgrades allow logistics managers to effectively scale fleet capacities, ensuring that hazardous material containment protocols are strictly maintained while navigating fluctuating seasonal demand cycles.

We can help! Our analysts can customize this railcar leasing market research report to meet your requirements.

Get in touch

1. Executive Summary

1.1 Market overview

Executive Summary - Chart on Market Overview
Executive Summary - Data Table on Market Overview
Executive Summary - Chart on Global Market Characteristics
Executive Summary - Chart on Market by Geography
Executive Summary - Chart on Market Segmentation by End-user
Executive Summary - Chart on Market Segmentation by Product
Executive Summary - Chart on Market Segmentation by Technology
Executive Summary - Chart on Incremental Growth
Executive Summary - Data Table on Incremental Growth
Executive Summary - Chart on Company Market Positioning

2. Technavio Analysis

2.1 Analysis of price sensitivity, lifecycle, customer purchase basket, adoption rates, and purchase criteria

2.2 Criticality of inputs and Factors of differentiation

Chart on Overview on criticality of inputs and factors of differentiation

2.3 Factors of disruption

Chart on Overview on factors of disruption

2.4 Impact of drivers and challenges

Chart on Impact of drivers and challenges in 2025 and 2030

3. Market Landscape

3.1 Market ecosystem

Chart on Parent Market
Data Table on - Parent Market

3.2 Market characteristics

Chart on Market characteristics analysis

3.3 Value chain analysis

Chart on Value chain analysis

4. Market Sizing

4.1 Market definition

Data Table on Offerings of companies included in the market definition

4.2 Market segment analysis

Market segments

4.3 Market size 2025

4.4 Market outlook: Forecast for 2025-2030

Chart on Global - Market size and forecast 2025-2030 ($ million)
Data Table on Global - Market size and forecast 2025-2030 ($ million)
Chart on Global Market: Year-over-year growth 2025-2030 (%)
Data Table on Global Market: Year-over-year growth 2025-2030 (%)

5. Historic Market Size

5.1 Global Railcar Leasing Market 2020 - 2024

Historic Market Size - Data Table on Global Railcar Leasing Market 2020 - 2024 ($ million)

5.2 End-user segment analysis 2020 - 2024

Historic Market Size - End-user Segment 2020 - 2024 ($ million)

5.3 Product segment analysis 2020 - 2024

Historic Market Size - Product Segment 2020 - 2024 ($ million)

5.4 Technology segment analysis 2020 - 2024

Historic Market Size - Technology Segment 2020 - 2024 ($ million)

5.5 Geography segment analysis 2020 - 2024

Historic Market Size - Geography Segment 2020 - 2024 ($ million)

5.6 Country segment analysis 2020 - 2024

Historic Market Size - Country Segment 2020 - 2024 ($ million)

6. Qualitative Analysis

6.1 Impact of AI on global railcar leasing market

6.2 Impact of geopolitical conflicts on global railcar leasing market

7. Five Forces Analysis

7.1 Five forces summary

Five forces analysis - Comparison between 2025 and 2030

7.2 Bargaining power of buyers

Bargaining power of buyers - Impact of key factors 2025 and 2030

7.3 Bargaining power of suppliers

Bargaining power of suppliers - Impact of key factors in 2025 and 2030

7.4 Threat of new entrants

Threat of new entrants - Impact of key factors in 2025 and 2030

7.5 Threat of substitutes

Threat of substitutes - Impact of key factors in 2025 and 2030

7.6 Threat of rivalry

Threat of rivalry - Impact of key factors in 2025 and 2030

7.7 Market condition

Chart on Market condition - Five forces 2025 and 2030

8. Market Segmentation by End-user

8.1 Market segments

Chart on End-user - Market share 2025-2030 (%)
Data Table on End-user - Market share 2025-2030 (%)

8.2 Comparison by End-user

Chart on Comparison by End-user
Data Table on Comparison by End-user

8.3 Petroleum and chemical - Market size and forecast 2025-2030

Chart on Petroleum and chemical - Market size and forecast 2025-2030 ($ million)
Data Table on Petroleum and chemical - Market size and forecast 2025-2030 ($ million)
Chart on Petroleum and chemical - Year-over-year growth 2025-2030 (%)
Data Table on Petroleum and chemical - Year-over-year growth 2025-2030 (%)

8.4 Coal - Market size and forecast 2025-2030

Chart on Coal - Market size and forecast 2025-2030 ($ million)
Data Table on Coal - Market size and forecast 2025-2030 ($ million)
Chart on Coal - Year-over-year growth 2025-2030 (%)
Data Table on Coal - Year-over-year growth 2025-2030 (%)

8.5 Agricultural products - Market size and forecast 2025-2030

Chart on Agricultural products - Market size and forecast 2025-2030 ($ million)
Data Table on Agricultural products - Market size and forecast 2025-2030 ($ million)
Chart on Agricultural products - Year-over-year growth 2025-2030 (%)
Data Table on Agricultural products - Year-over-year growth 2025-2030 (%)

8.6 Others - Market size and forecast 2025-2030

Chart on Others - Market size and forecast 2025-2030 ($ million)
Data Table on Others - Market size and forecast 2025-2030 ($ million)
Chart on Others - Year-over-year growth 2025-2030 (%)
Data Table on Others - Year-over-year growth 2025-2030 (%)

8.7 Market opportunity by End-user

Market opportunity by End-user ($ million)
Data Table on Market opportunity by End-user ($ million)

9. Market Segmentation by Product

9.1 Market segments

Chart on Product - Market share 2025-2030 (%)
Data Table on Product - Market share 2025-2030 (%)

9.2 Comparison by Product

Chart on Comparison by Product
Data Table on Comparison by Product

9.3 Freight cars - Market size and forecast 2025-2030

Chart on Freight cars - Market size and forecast 2025-2030 ($ million)
Data Table on Freight cars - Market size and forecast 2025-2030 ($ million)
Chart on Freight cars - Year-over-year growth 2025-2030 (%)
Data Table on Freight cars - Year-over-year growth 2025-2030 (%)

9.4 Tank cars - Market size and forecast 2025-2030

Chart on Tank cars - Market size and forecast 2025-2030 ($ million)
Data Table on Tank cars - Market size and forecast 2025-2030 ($ million)
Chart on Tank cars - Year-over-year growth 2025-2030 (%)
Data Table on Tank cars - Year-over-year growth 2025-2030 (%)

9.5 Locomotives - Market size and forecast 2025-2030

Chart on Locomotives - Market size and forecast 2025-2030 ($ million)
Data Table on Locomotives - Market size and forecast 2025-2030 ($ million)
Chart on Locomotives - Year-over-year growth 2025-2030 (%)
Data Table on Locomotives - Year-over-year growth 2025-2030 (%)

9.6 Market opportunity by Product

Market opportunity by Product ($ million)
Data Table on Market opportunity by Product ($ million)

10. Market Segmentation by Technology

10.1 Market segments

Chart on Technology - Market share 2025-2030 (%)
Data Table on Technology - Market share 2025-2030 (%)

10.2 Comparison by Technology

Chart on Comparison by Technology
Data Table on Comparison by Technology

10.3 Automated guided vehicles - Market size and forecast 2025-2030

Chart on Automated guided vehicles - Market size and forecast 2025-2030 ($ million)
Data Table on Automated guided vehicles - Market size and forecast 2025-2030 ($ million)
Chart on Automated guided vehicles - Year-over-year growth 2025-2030 (%)
Data Table on Automated guided vehicles - Year-over-year growth 2025-2030 (%)

10.4 IoT-enabled loading systems - Market size and forecast 2025-2030

Chart on IoT-enabled loading systems - Market size and forecast 2025-2030 ($ million)
Data Table on IoT-enabled loading systems - Market size and forecast 2025-2030 ($ million)
Chart on IoT-enabled loading systems - Year-over-year growth 2025-2030 (%)
Data Table on IoT-enabled loading systems - Year-over-year growth 2025-2030 (%)

10.5 Market opportunity by Technology

Market opportunity by Technology ($ million)
Data Table on Market opportunity by Technology ($ million)

11. Customer Landscape

11.1 Customer landscape overview

Analysis of price sensitivity, lifecycle, customer purchase basket, adoption rates, and purchase criteria

12. Geographic Landscape

12.1 Geographic segmentation

Chart on Market share by geography 2025-2030 (%)
Data Table on Market share by geography 2025-2030 (%)

12.2 Geographic comparison

Chart on Geographic comparison
Data Table on Geographic comparison

12.3 North America - Market size and forecast 2025-2030

Chart on North America - Market size and forecast 2025-2030 ($ million)
Data Table on North America - Market size and forecast 2025-2030 ($ million)
Chart on North America - Year-over-year growth 2025-2030 (%)
Data Table on North America - Year-over-year growth 2025-2030 (%)
Chart on Regional Comparison - North America
Data Table on Regional Comparison - North America

12.3.1 US - Market size and forecast 2025-2030

Chart on US - Market size and forecast 2025-2030 ($ million)
Data Table on US - Market size and forecast 2025-2030 ($ million)
Chart on US - Year-over-year growth 2025-2030 (%)
Data Table on US - Year-over-year growth 2025-2030 (%)

12.3.2 Canada - Market size and forecast 2025-2030

Chart on Canada - Market size and forecast 2025-2030 ($ million)
Data Table on Canada - Market size and forecast 2025-2030 ($ million)
Chart on Canada - Year-over-year growth 2025-2030 (%)
Data Table on Canada - Year-over-year growth 2025-2030 (%)

12.3.3 Mexico - Market size and forecast 2025-2030

Chart on Mexico - Market size and forecast 2025-2030 ($ million)
Data Table on Mexico - Market size and forecast 2025-2030 ($ million)
Chart on Mexico - Year-over-year growth 2025-2030 (%)
Data Table on Mexico - Year-over-year growth 2025-2030 (%)

12.4 APAC - Market size and forecast 2025-2030

Chart on APAC - Market size and forecast 2025-2030 ($ million)
Data Table on APAC - Market size and forecast 2025-2030 ($ million)
Chart on APAC - Year-over-year growth 2025-2030 (%)
Data Table on APAC - Year-over-year growth 2025-2030 (%)
Chart on Regional Comparison - APAC
Data Table on Regional Comparison - APAC

12.4.1 China - Market size and forecast 2025-2030

Chart on China - Market size and forecast 2025-2030 ($ million)
Data Table on China - Market size and forecast 2025-2030 ($ million)
Chart on China - Year-over-year growth 2025-2030 (%)
Data Table on China - Year-over-year growth 2025-2030 (%)

12.4.2 Japan - Market size and forecast 2025-2030

Chart on Japan - Market size and forecast 2025-2030 ($ million)
Data Table on Japan - Market size and forecast 2025-2030 ($ million)
Chart on Japan - Year-over-year growth 2025-2030 (%)
Data Table on Japan - Year-over-year growth 2025-2030 (%)

12.4.3 India - Market size and forecast 2025-2030

Chart on India - Market size and forecast 2025-2030 ($ million)
Data Table on India - Market size and forecast 2025-2030 ($ million)
Chart on India - Year-over-year growth 2025-2030 (%)
Data Table on India - Year-over-year growth 2025-2030 (%)

12.4.4 South Korea - Market size and forecast 2025-2030

Chart on South Korea - Market size and forecast 2025-2030 ($ million)
Data Table on South Korea - Market size and forecast 2025-2030 ($ million)
Chart on South Korea - Year-over-year growth 2025-2030 (%)
Data Table on South Korea - Year-over-year growth 2025-2030 (%)

12.4.5 Australia - Market size and forecast 2025-2030

Chart on Australia - Market size and forecast 2025-2030 ($ million)
Data Table on Australia - Market size and forecast 2025-2030 ($ million)
Chart on Australia - Year-over-year growth 2025-2030 (%)
Data Table on Australia - Year-over-year growth 2025-2030 (%)

12.4.6 Indonesia - Market size and forecast 2025-2030

Chart on Indonesia - Market size and forecast 2025-2030 ($ million)
Data Table on Indonesia - Market size and forecast 2025-2030 ($ million)
Chart on Indonesia - Year-over-year growth 2025-2030 (%)
Data Table on Indonesia - Year-over-year growth 2025-2030 (%)

12.5 Europe - Market size and forecast 2025-2030

Chart on Europe - Market size and forecast 2025-2030 ($ million)
Data Table on Europe - Market size and forecast 2025-2030 ($ million)
Chart on Europe - Year-over-year growth 2025-2030 (%)
Data Table on Europe - Year-over-year growth 2025-2030 (%)
Chart on Regional Comparison - Europe
Data Table on Regional Comparison - Europe

12.5.1 Germany - Market size and forecast 2025-2030

Chart on Germany - Market size and forecast 2025-2030 ($ million)
Data Table on Germany - Market size and forecast 2025-2030 ($ million)
Chart on Germany - Year-over-year growth 2025-2030 (%)
Data Table on Germany - Year-over-year growth 2025-2030 (%)

12.5.2 UK - Market size and forecast 2025-2030

Chart on UK - Market size and forecast 2025-2030 ($ million)
Data Table on UK - Market size and forecast 2025-2030 ($ million)
Chart on UK - Year-over-year growth 2025-2030 (%)
Data Table on UK - Year-over-year growth 2025-2030 (%)

12.5.3 France - Market size and forecast 2025-2030

Chart on France - Market size and forecast 2025-2030 ($ million)
Data Table on France - Market size and forecast 2025-2030 ($ million)
Chart on France - Year-over-year growth 2025-2030 (%)
Data Table on France - Year-over-year growth 2025-2030 (%)

12.5.4 Italy - Market size and forecast 2025-2030

Chart on Italy - Market size and forecast 2025-2030 ($ million)
Data Table on Italy - Market size and forecast 2025-2030 ($ million)
Chart on Italy - Year-over-year growth 2025-2030 (%)
Data Table on Italy - Year-over-year growth 2025-2030 (%)

12.5.5 The Netherlands - Market size and forecast 2025-2030

Chart on The Netherlands - Market size and forecast 2025-2030 ($ million)
Data Table on The Netherlands - Market size and forecast 2025-2030 ($ million)
Chart on The Netherlands - Year-over-year growth 2025-2030 (%)
Data Table on The Netherlands - Year-over-year growth 2025-2030 (%)

12.5.6 Spain - Market size and forecast 2025-2030

Chart on Spain - Market size and forecast 2025-2030 ($ million)
Data Table on Spain - Market size and forecast 2025-2030 ($ million)
Chart on Spain - Year-over-year growth 2025-2030 (%)
Data Table on Spain - Year-over-year growth 2025-2030 (%)

12.6 South America - Market size and forecast 2025-2030

Chart on South America - Market size and forecast 2025-2030 ($ million)
Data Table on South America - Market size and forecast 2025-2030 ($ million)
Chart on South America - Year-over-year growth 2025-2030 (%)
Data Table on South America - Year-over-year growth 2025-2030 (%)
Chart on Regional Comparison - South America
Data Table on Regional Comparison - South America

12.6.1 Brazil - Market size and forecast 2025-2030

Chart on Brazil - Market size and forecast 2025-2030 ($ million)
Data Table on Brazil - Market size and forecast 2025-2030 ($ million)
Chart on Brazil - Year-over-year growth 2025-2030 (%)
Data Table on Brazil - Year-over-year growth 2025-2030 (%)

12.6.2 Argentina - Market size and forecast 2025-2030

Chart on Argentina - Market size and forecast 2025-2030 ($ million)
Data Table on Argentina - Market size and forecast 2025-2030 ($ million)
Chart on Argentina - Year-over-year growth 2025-2030 (%)
Data Table on Argentina - Year-over-year growth 2025-2030 (%)

12.6.3 Chile - Market size and forecast 2025-2030

Chart on Chile - Market size and forecast 2025-2030 ($ million)
Data Table on Chile - Market size and forecast 2025-2030 ($ million)
Chart on Chile - Year-over-year growth 2025-2030 (%)
Data Table on Chile - Year-over-year growth 2025-2030 (%)

12.7 Middle East and Africa - Market size and forecast 2025-2030

Chart on Middle East and Africa - Market size and forecast 2025-2030 ($ million)
Data Table on Middle East and Africa - Market size and forecast 2025-2030 ($ million)
Chart on Middle East and Africa - Year-over-year growth 2025-2030 (%)
Data Table on Middle East and Africa - Year-over-year growth 2025-2030 (%)
Chart on Regional Comparison - Middle East and Africa
Data Table on Regional Comparison - Middle East and Africa

12.7.1 Saudi Arabia - Market size and forecast 2025-2030

Chart on Saudi Arabia - Market size and forecast 2025-2030 ($ million)
Data Table on Saudi Arabia - Market size and forecast 2025-2030 ($ million)
Chart on Saudi Arabia - Year-over-year growth 2025-2030 (%)
Data Table on Saudi Arabia - Year-over-year growth 2025-2030 (%)

12.7.2 UAE - Market size and forecast 2025-2030

Chart on UAE - Market size and forecast 2025-2030 ($ million)
Data Table on UAE - Market size and forecast 2025-2030 ($ million)
Chart on UAE - Year-over-year growth 2025-2030 (%)
Data Table on UAE - Year-over-year growth 2025-2030 (%)

12.7.3 South Africa - Market size and forecast 2025-2030

Chart on South Africa - Market size and forecast 2025-2030 ($ million)
Data Table on South Africa - Market size and forecast 2025-2030 ($ million)
Chart on South Africa - Year-over-year growth 2025-2030 (%)
Data Table on South Africa - Year-over-year growth 2025-2030 (%)

12.7.4 Egypt - Market size and forecast 2025-2030

Chart on Egypt - Market size and forecast 2025-2030 ($ million)
Data Table on Egypt - Market size and forecast 2025-2030 ($ million)
Chart on Egypt - Year-over-year growth 2025-2030 (%)
Data Table on Egypt - Year-over-year growth 2025-2030 (%)

12.7.5 Nigeria - Market size and forecast 2025-2030

Chart on Nigeria - Market size and forecast 2025-2030 ($ million)
Data Table on Nigeria - Market size and forecast 2025-2030 ($ million)
Chart on Nigeria - Year-over-year growth 2025-2030 (%)
Data Table on Nigeria - Year-over-year growth 2025-2030 (%)

12.8 Market opportunity by geography

Market opportunity by geography ($ million)
Data Tables on Market opportunity by geography ($ million)

13. Drivers, Challenges, and Opportunity

13.1 Market drivers

Acceleration of fleet modernization and capital preservation strategies
Expanding corporate sustainability mandates and environmental regulations
Digital transformation and integration of advanced telematics systems

13.2 Market challenges

Volatility in macroeconomic cycles and bulk commodity fluctuations
Escalating compliance costs and stringent safety regulations
High capital intensity and infrastructure maintenance burdens

13.3 Impact of drivers and challenges

Impact of drivers and challenges in 2025 and 2030

13.4 Market opportunities

Proliferation of telematics and precision fleet analytics
Shift toward green financing and sustainable rolling stock portfolios
Expansion of customized leasing models and fleet customization

14. Competitive Landscape

14.1 Overview

14.2

Overview on criticality of inputs and factors of differentiation

14.3 Landscape disruption

Overview on factors of disruption

14.4 Industry risks

Impact of key risks on business

15. Competitive Analysis

15.1 Companies profiled

Companies covered

15.2 Company ranking index

15.3 Market positioning of companies

Matrix on companies position and classification

15.4 AITX Inc.

AITX Inc. - Overview
AITX Inc. - Product / Service
AITX Inc. - Key offerings
SWOT

15.5 Akiem Group SAS

Akiem Group SAS - Overview
Akiem Group SAS - Product / Service
Akiem Group SAS - Key offerings
SWOT

15.6 Cardtronics plc

Cardtronics plc - Overview
Cardtronics plc - Product / Service
Cardtronics plc - Key offerings
SWOT

15.7 Mitsui Rail Capital LLC

Mitsui Rail Capital LLC - Overview
Mitsui Rail Capital LLC - Product / Service
Mitsui Rail Capital LLC - Key offerings
SWOT

15.8 MUL Railcars

MUL Railcars - Overview
MUL Railcars - Product / Service
MUL Railcars - Key offerings
SWOT

15.9 Northrail GmbH

Northrail GmbH - Overview
Northrail GmbH - Product / Service
Northrail GmbH - Key offerings
SWOT

15.10 RAILPOOL GmbH

RAILPOOL GmbH - Overview
RAILPOOL GmbH - Product / Service
RAILPOOL GmbH - Key offerings
SWOT

15.11 RALCO Leasing

RALCO Leasing - Overview
RALCO Leasing - Product / Service
RALCO Leasing - Key offerings
SWOT

15.12 RESIDCO

RESIDCO - Overview
RESIDCO - Product / Service
RESIDCO - Key offerings
SWOT

15.13 Tealinc Ltd.

Tealinc Ltd. - Overview
Tealinc Ltd. - Product / Service
Tealinc Ltd. - Key offerings
SWOT

15.14 The Greenbrier Companies Inc.

The Greenbrier Companies Inc. - Overview
The Greenbrier Companies Inc. - Business segments
The Greenbrier Companies Inc. - Key news
The Greenbrier Companies Inc. - Key offerings
The Greenbrier Companies Inc. - Segment focus
SWOT

15.15 Touax SCA

Touax SCA - Overview
Touax SCA - Business segments
Touax SCA - Key offerings
Touax SCA - Segment focus
SWOT

15.16 Trinity Industries Inc.

Trinity Industries Inc. - Overview
Trinity Industries Inc. - Business segments
Trinity Industries Inc. - Key offerings
Trinity Industries Inc. - Segment focus
SWOT

15.17 VTG Aktiengesellschaft

VTG Aktiengesellschaft - Overview
VTG Aktiengesellschaft - Product / Service
VTG Aktiengesellschaft - Key offerings
SWOT

15.18 Wascosa AG

Wascosa AG - Overview
Wascosa AG - Product / Service
Wascosa AG - Key offerings
SWOT

16. Appendix

16.1 Scope of the report

Market definition
Objectives
Notes and caveats

16.2 Inclusions and exclusions checklist

Inclusions checklist
Exclusions checklist

16.3 Currency conversion rates for US$

16.4 Research methodology

16.5 Data procurement

Information sources

16.6 Data validation

16.7 Validation techniques employed for market sizing

16.8 Data synthesis

16.9 360 degree market analysis

16.10 List of abbreviations

Research Methodology

Technavio presents a detailed picture of the market by way of study, synthesis, and summation of data from multiple sources. The analysts have presented the various facets of the market with a particular focus on identifying the key industry influencers. The data thus presented is comprehensive, reliable, and the result of extensive research, both primary and secondary.

INFORMATION SOURCES

Primary sources

  • Manufacturers and suppliers
  • Channel partners
  • Industry experts
  • Strategic decision makers

Secondary sources

  • Industry journals and periodicals
  • Government data
  • Financial reports of key industry players
  • Historical data
  • Press releases

DATA ANALYSIS

Data Synthesis

  • Collation of data
  • Estimation of key figures
  • Analysis of derived insights

Data Validation

  • Triangulation with data models
  • Reference against proprietary databases
  • Corroboration with industry experts

REPORT WRITING

Qualitative

  • Market drivers
  • Market challenges
  • Market trends
  • Five forces analysis

Quantitative

  • Market size and forecast
  • Market segmentation
  • Geographical insights
  • Competitive landscape

Interested in this report?

Get your sample now to see our research methodology and insights!

Download Now

Frequently Asked Questions

Railcar Leasing market growth will increase by USD 38074.5 million during 2026-2030.

The Railcar Leasing market is expected to grow at a CAGR of 9.2% during 2026-2030.

Railcar Leasing market is segmented by End-user (Petroleum and chemical, Coal, Agricultural products, Others) Product (Freight cars, Tank cars, Locomotives) Technology (Automated guided vehicles, IoT-enabled loading systems)

AITX Inc., Akiem Group SAS, Beacon Rail Leasing Ltd., Cardtronics plc, Ermewa Group, European Rail Rent, GATX Corp., Mitsui Rail Capital LLC, MUL Railcars, Northrail GmbH, RAILPOOL GmbH, RALCO Leasing, RESIDCO, RGCX Railcar Leasing, SMBC Rail Services, Tealinc Ltd., The Greenbrier Companies Inc., Touax SCA, Trinity Industries Inc., TTX Co, Union Tank Car Co., VTG Aktiengesellschaft, Wascosa AG are a few of the key vendors in the Railcar Leasing market.

North America will register the highest growth rate of 33.4% among the other regions. Therefore, the Railcar Leasing market in North America is expected to garner significant business opportunities for the vendors during the forecast period.

US, Canada, Mexico, China, Japan, India, South Korea, Australia, Indonesia, Germany, UK, France, Italy, The Netherlands, Spain, Brazil, Argentina, Chile, Saudi Arabia, UAE, South Africa, Egypt, Nigeria

  • Acceleration of fleet modernization and capital preservation strategies is the driving factor this market.

The Railcar Leasing market vendors should focus on grabbing business opportunities from the End-user segment as it accounted for the largest market share in the base year.
RIA - Research AI Assistant
Ask RIA
