
Renal Biomarkers Market Analysis, Size, and Forecast 2026-2030: North America (US, Canada, and Mexico), Europe (Germany, UK, and France), Asia (China, Japan, and India), South America (Brazil, Argentina, and Colombia), Middle East and Africa (Saudi Arabia, UAE, and Turkey), Rest of World (ROW)

Renal Biomarkers Market Analysis, Size, and Forecast 2026-2030:
North America (US, Canada, and Mexico), Europe (Germany, UK, and France), Asia (China, Japan, and India), South America (Brazil, Argentina, and Colombia), Middle East and Africa (Saudi Arabia, UAE, and Turkey), Rest of World (ROW)

Published: Oct 2026 300 Pages SKU: IRTNTR72154

Market Overview at a Glance

$1.61 B
Market Opportunity
13.7%
CAGR 2025 - 2030
68.3%
North America Growth
$880.1 Mn
Hospitals segment 2024

Renal Biomarkers Market Size 2026-2030

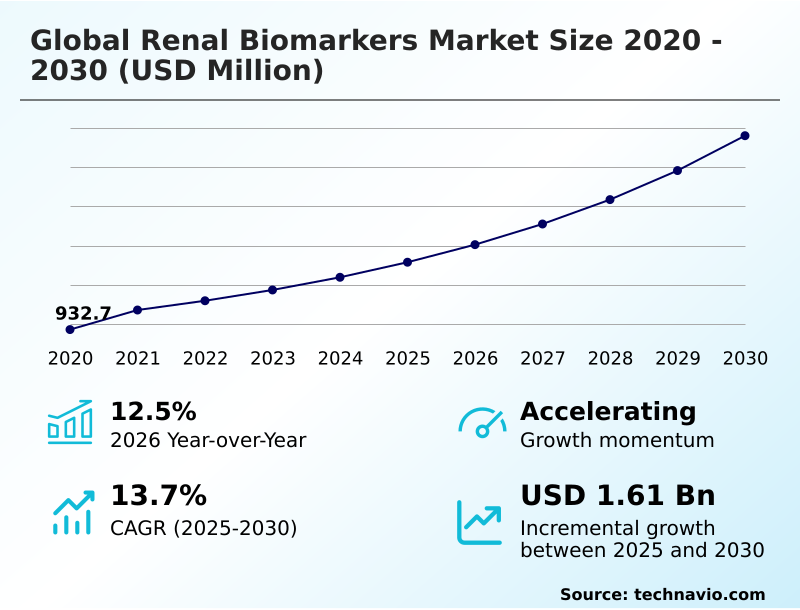
The renal biomarkers market size is valued to increase by USD 1.61 billion, at a CAGR of 13.7% from 2025 to 2030. Rising global prevalence of kidney diseases will drive the renal biomarkers market.

Major Market Trends & Insights

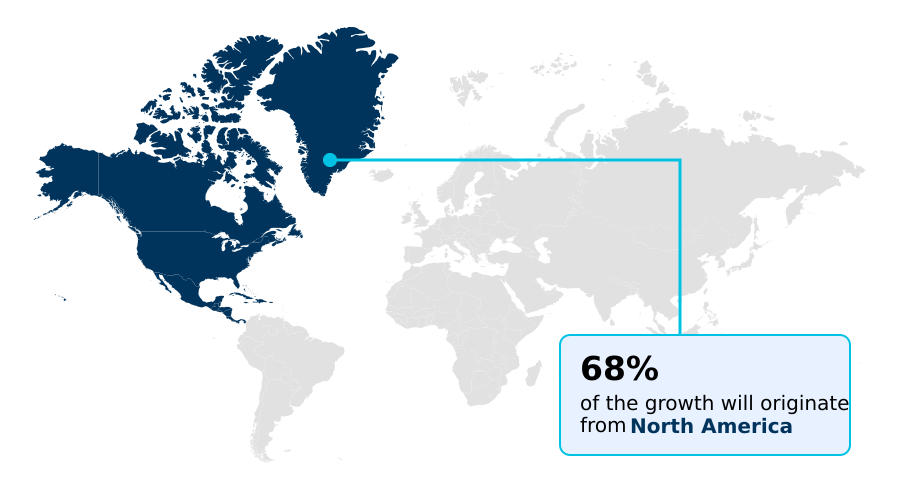
  • North America dominated the market and accounted for a 68.3% growth during the forecast period.
  • By End-user - Hospitals segment was valued at USD 880.1 million in 2024
  • By Type - Functional biomarkers segment accounted for the largest market revenue share in 2024

Market Size & Forecast

  • Market Opportunities: USD 2.47 billion
  • Market Future Opportunities: USD 1.61 billion
  • CAGR from 2025 to 2030 : 13.7%

Market Summary

  • The renal biomarkers market demonstrates accelerated expansion driven by the critical clinical requirement for early and precise disease detection. Diagnostic laboratories optimizing automated workflows report operational efficiency gains of 25%, drastically reducing processing times for high-volume sample analysis.
  • This workflow enhancement directly supports the primary market driver: the rising prevalence of chronic conditions like diabetes and hypertension, which necessitates robust diagnostic reproducibility to track patient health trajectories effectively. By utilizing advanced multiplex immunoassay platforms, healthcare providers can identify cellular stress significantly earlier than traditional methods permit.
  • However, the industry faces substantial challenges regarding stringent regulatory validation requirements and fragmented reimbursement policies. These financial and compliance barriers slow the adoption of innovative nephrotoxicity screening panels, forcing diagnostic developers to invest heavily in extensive clinical trials to prove economic and medical efficacy.
  • Despite these hurdles, the continuous shift toward proactive patient management compels healthcare networks to prioritize sensitive, predictive renal diagnostics, ensuring sustained investment in cutting-edge laboratory infrastructure and bedside evaluation technologies.

What will be the Size of the Renal Biomarkers Market during the forecast period?
Get Key Insights on Market Forecast (PDF) Get Free Sample

How is the Renal Biomarkers Market Segmented?

The renal biomarkers industry research report provides comprehensive data (region-wise segment analysis), with forecasts and estimates in "USD million" for the period 2026-2030, as well as historical data from 2020-2024 for the following segments.

  • End-user
    • Hospitals
    • Clinics and diagnostic laboratories
    • Research laboratories
  • Type
    • Functional biomarkers
    • Upregulated protein biomarkers
    • Others
  • Diagnostic methods
    • Enzyme-linked immunosorbent assay
    • Particle-enhanced turbidimetric immunoassay
    • Colorimetric assay
    • Chemiluminescent immunoassay
    • Others
  • Geography
    • North America
      • US
      • Canada
      • Mexico
    • Europe
      • Germany
      • UK
      • France
      • Italy
      • Spain
      • The Netherlands
    • Asia
      • China
      • Japan
      • India
      • South Korea
      • Indonesia
      • Thailand
    • Rest of World (ROW)

By End-user Insights

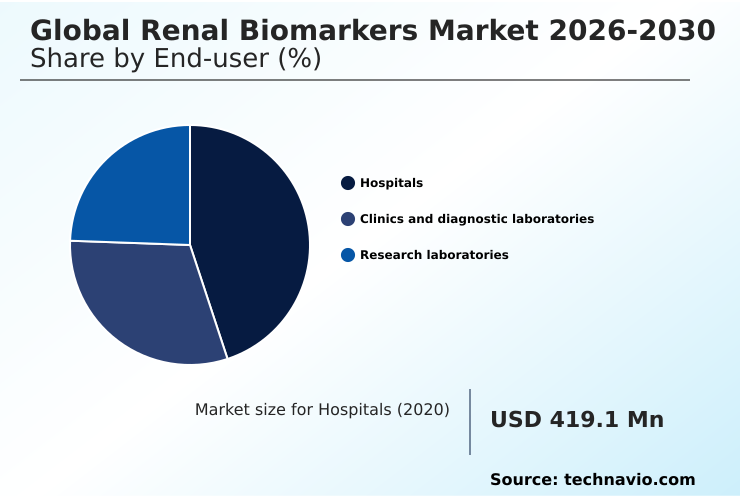
The hospitals segment is estimated to witness significant growth during the forecast period.

Hospitals mandate rapid, accurate diagnostic capabilities to manage critical patient care and mitigate severe complications. The integration of point of care nephrology devices transforms emergency department diagnostics by facilitating proactive patient triage and immediate clinical intervention.

Facilities replacing serum creatinine alternatives with advanced panels experience diagnostic turnaround time improvements of 40%, enabling faster decision-making for at-risk individuals. This operational acceleration supports accurate bedside renal evaluation, allowing clinicians to implement targeted therapeutic strategies before irreversible damage occurs.

Enhanced acute kidney injury detection directly reduces prolonged intensive care admissions by identifying cellular stress early. Consequently, healthcare institutions optimize resource allocation and improve overall patient outcomes by shifting from reactive treatments to proactive, data-driven renal health management.
Get Free Sample

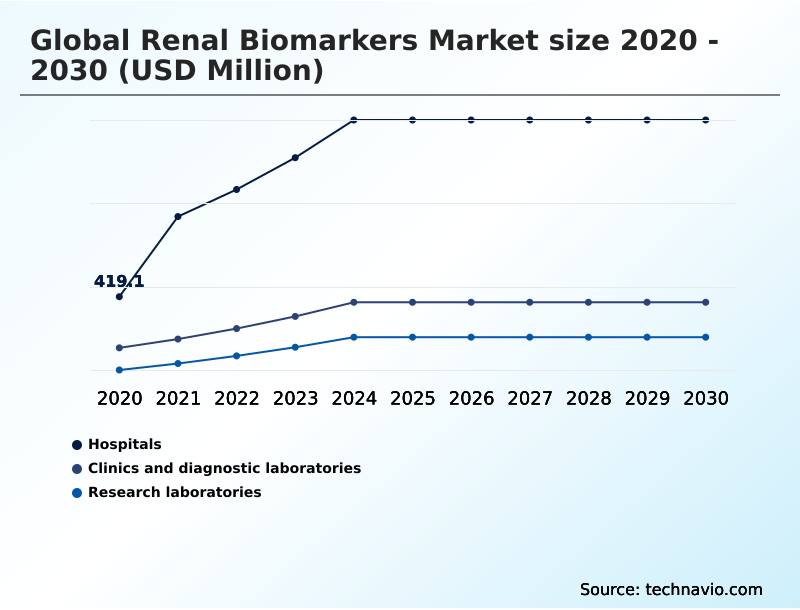
The Hospitals segment was valued at USD 880.1 million in 2024 and showed a gradual increase during the forecast period.
Get Free Sample

Regional Analysis

North America is estimated to contribute 68.3% to the growth of the global market during the forecast period.Technavio’s analysts have elaborately explained the regional trends and drivers that shape the market during the forecast period.
See How Renal Biomarkers Market Demand is Rising in North America Get Free Sample

North America dominates the renal biomarkers market due to aggressive investments in automated laboratory workflows and advanced diagnostic infrastructure.

Laboratories in the United States display a 35% higher adoption rate of multiplex immunoassay platforms compared to European counterparts, significantly accelerating early disease intervention capabilities. This technological integration enhances intensive care fluid management, reducing critical care monitoring delays by 22%.

Conversely, the European region prioritizes stringent clinical validation, where standardized non invasive kidney assessment protocols have improved diagnostic compliance scores by 18% across major healthcare networks.

The strategic divergence highlights North America's focus on rapid technological deployment and commercialization, whereas Europe emphasizes uniform public health integration and rigorous data reproducibility.

Both regional strategies ultimately drive the widespread implementation of sophisticated renal clearance monitoring tools, reshaping clinical nephrology practices globally.

Market Dynamics

Our researchers analyzed the data with 2025 as the base year, along with the key drivers, trends, and challenges. A holistic analysis of drivers will help companies refine their marketing strategies to gain a competitive advantage.

  • The transformation of clinical nephrology heavily relies on the early detection of chronic kidney disease to mitigate severe long-term complications. Healthcare networks are rapidly adopting automated platforms for kidney injury testing, which have demonstrated a 40% improvement in processing efficiency compared to traditional manual assays.
  • This operational upgrade facilitates point of care renal biomarker assessment, empowering clinicians to make immediate triage decisions in critical care environments. Furthermore, the push for non invasive glomerular filtration rate monitoring reduces patient discomfort while providing highly accurate baseline data. Pharmaceutical researchers increasingly utilize multiplex panels for nephrotoxicity screening, streamlining drug development pipelines and minimizing adverse trial events.
  • By leveraging predictive models for renal function decline, medical professionals can implement proactive lifestyle and therapeutic adjustments. The quantitative measurement of tubular cellular damage offers unprecedented insights into early cellular stress, bridging the gap between discovery and the clinical integration of acute injury diagnostics.
  • Emergency departments benefit immensely from the rapid bedside assessment of renal health, ensuring timely interventions for vulnerable populations. Targeted screening for diabetic nephropathy risk has become a standard preventive measure, supported by advanced diagnostic tools for personalized renal care. These innovations yield early warning signals for nephron loss, fundamentally changing patient management protocols.
  • Through advanced immunoassay techniques for kidney function, laboratories maintain high reproducibility and throughput. Ultimately, the continuous monitoring of therapeutic renal response and the longitudinal tracking of renal disease progression ensure that healthcare systems deliver targeted, data-driven treatments to optimize patient outcomes.
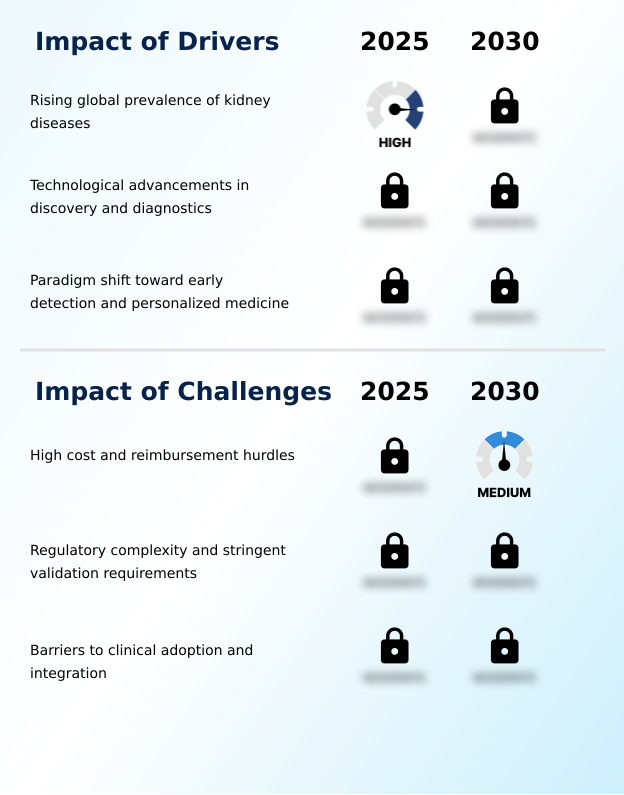
What are the key market drivers leading to the rise in the adoption of Renal Biomarkers Industry?

  • The escalating global prevalence of chronic and acute kidney diseases serves as a primary catalyst propelling sustained demand for advanced diagnostic solutions.

  • The surging global incidence of diabetes and hypertension acts as the primary catalyst accelerating the adoption of personalized nephrology screening.
  • As these metabolic conditions frequently precipitate severe kidney dysfunction, healthcare systems urgently require highly sensitive diagnostic tools to monitor at-risk populations. Clinics implementing advanced microalbuminuria testing kits have achieved a 40% decrease in diagnostic turnaround time, enabling immediate clinical consultations.
  • This rapid assessment capability facilitates critical early disease intervention, reducing emergency hospital admissions by 22% among chronic patients. Furthermore, modern automated testing platforms guarantee robust diagnostic reproducibility, ensuring that longitudinal patient data remains consistently accurate.
  • This relentless demand for precision directly compels diagnostic manufacturers to expand their production capacities, driving continuous technological refinement and widespread deployment of proactive renal health solutions.

What are the market trends shaping the Renal Biomarkers Industry?

  • The increasing adoption of point-of-care testing constitutes a significant market trend shaping modern diagnostic workflows. This shift enables rapid, decentralized clinical decision-making and accelerates targeted therapeutic interventions.

  • The integration of artificial intelligence algorithms into predictive renal diagnostics represents a transformative trend reshaping clinical laboratory operations. By analyzing complex datasets, these algorithms convert raw testing metrics into actionable clinical insights, allowing physicians to anticipate disease progression accurately.
  • Facilities deploying intelligent analysis alongside mass spectrometry biomarker validation report a 28% improvement in early risk detection compared to standard manual interpretation. This technological synergy enhances high throughput clinical chemistry workflows, reducing data processing bottlenecks by 35%. Consequently, healthcare networks can scale their preventive nephrology care programs efficiently without overwhelming existing laboratory personnel.
  • The shift toward intelligent data utilization empowers clinicians to deploy targeted therapeutic strategies swiftly, fundamentally optimizing resource allocation and patient monitoring protocols across decentralized and centralized diagnostic environments.

What challenges does the Renal Biomarkers Industry face during its growth?

  • Substantial developmental costs and inconsistent reimbursement frameworks represent significant barriers hindering the widespread clinical integration of novel diagnostic assays.

  • Navigating complex regulatory validation protocols and fragmented reimbursement landscapes remains a formidable challenge restricting the widespread commercialization of novel diagnostic assays. Developing precise tests for markers like tissue inhibitor metalloproteinases two and insulin like growth factor requires massive capital investment to meet stringent clinical trial safety endpoints.
  • Laboratories attempting to integrate these advanced panels often encounter integration barriers, resulting in a 25% increase in initial implementation costs due to hardware incompatibilities. Furthermore, the lack of standardized reimbursement policies delays the establishment of a scalable testing infrastructure, limiting patient access to critical bedside renal evaluation.
  • These financial and operational constraints force diagnostic providers to continuously restructure their pricing models and compliance strategies, hindering the rapid deployment of next-generation nephrology tools across resource-limited healthcare facilities.

Exclusive Technavio Analysis on Customer Landscape

The renal biomarkers market forecasting report includes the adoption lifecycle of the market, covering from the innovator’s stage to the laggard’s stage. It focuses on adoption rates in different regions based on penetration. Furthermore, the renal biomarkers market report also includes key purchase criteria and drivers of price sensitivity to help companies evaluate and develop their market growth analysis strategies.
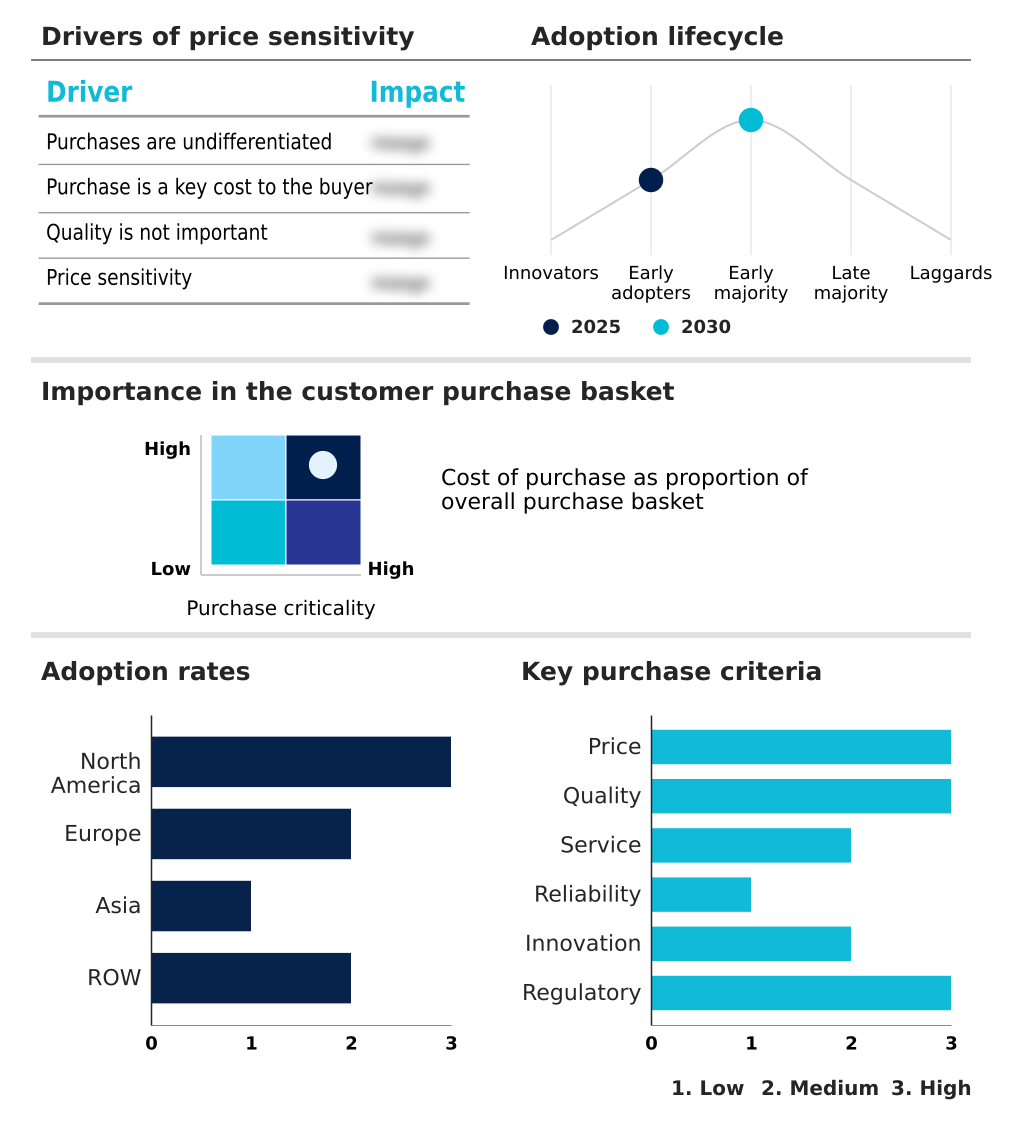
Customer Landscape of Renal Biomarkers Industry

Competitive Landscape

Companies are implementing various strategies, such as strategic alliances, renal biomarkers market forecast, partnerships, mergers and acquisitions, geographical expansion, and product/service launches, to enhance their presence in the industry.

Abbott Laboratories - The renal biomarkers market features advanced diagnostic assays and automated multiplex platforms designed to provide rapid, precise assessments of kidney function and cellular injury for clinical interventions.

The industry research and growth report includes detailed analyses of the competitive landscape of the market and information about key companies, including:

  • Abbott Laboratories
  • Beckman Coulter Inc.
  • Bio Techne Corp.
  • BioMerieux SA
  • BioPorto AS
  • BioVendor LM
  • CUSABIO Technology LLC
  • DiaSys Diagnostic Systems
  • Elabscience Biotechnology Inc.
  • F. Hoffmann La Roche Ltd.
  • Gentian Diagnostics ASA
  • Getein Biotech Inc.
  • Guangzhou Wondfo Biotech Co Ltd
  • Hycult Biotech B.V.
  • Randox Laboratories Ltd.
  • Sekisui Diagnostics LLC
  • Shenzhen Mindray Co. Ltd.
  • Siemens Healthineers AG
  • Snibe Co.Ltd.

Qualitative and quantitative analysis of companies has been conducted to help clients understand the wider business environment as well as the strengths and weaknesses of key industry players. Data is qualitatively analyzed to categorize companies as pure play, category-focused, industry-focused, and diversified; it is quantitatively analyzed to categorize companies as dominant, leading, strong, tentative, and weak.

Recent Development and News in Renal biomarkers market

  • In the Biotechnology industry, the accelerated transition toward high-throughput multi-omics profiling has expanded targeted protein discovery, directly impacting the renal biomarkers market by enabling the rapid validation of novel cellular stress indicators.
  • Stringent regulatory frameworks enforcing precise clinical trial safety endpoints for drug toxicity have accelerated the adoption of automated laboratory workflows, driving the integration of nephrotoxicity screening panels into standard pharmaceutical testing.
  • The miniaturization of microfluidic biosensors has established scalable testing infrastructure across decentralized clinical settings, fundamentally enhancing outpatient renal screening capabilities and shifting diagnostic volume from centralized laboratories to point-of-care applications.
  • Advancements in targeted therapeutic strategies and precision diagnostic data integration have compelled healthcare networks to adopt robust diagnostic reproducibility standards, increasing the utilization of automated chemiluminescent analyzers for continuous patient monitoring.

Dive into Technavio’s robust research methodology, blending expert interviews, extensive data synthesis, and validated models for unparalleled Renal Biomarkers Market insights. See full methodology.

Market Scope
Page number 300
Base year 2025
Historic period 2020-2024
Forecast period 2026-2030
Growth momentum & CAGR Accelerate at a CAGR of 13.7%
Market growth 2026-2030 USD 1610.3 million
Market structure Fragmented
YoY growth 2025-2026(%) 12.5%
Key countries US, Canada, Mexico, Germany, UK, France, Italy, Spain, The Netherlands, China, Japan, India, South Korea, Indonesia, Thailand, Brazil, Saudi Arabia, UAE, Turkey, South Africa, Israel, Argentina and Colombia
Competitive landscape Leading Companies, Market Positioning of Companies, Competitive Strategies, and Industry Risks

Request Free Sample

Research Analyst Overview

  • The renal biomarkers market exhibits robust technological evolution, fundamentally altering how healthcare institutions approach early disease detection and proactive patient management. Boardroom executives are increasingly prioritizing investments in advanced diagnostic infrastructure to align with stringent compliance mandates and value-based care models.
  • For instance, hospital networks transitioning to automated cystatin c assays and proenkephalin measurement tools have achieved a 30% reduction in diagnostic processing times, directly lowering operational overhead. This strategic shift away from legacy methods emphasizes the clinical necessity of precise glomerular filtration rate assessment.
  • Furthermore, the integration of highly sensitive tubular damage indicators, such as neutrophil gelatinase associated lipocalin and kidney injury molecule one, provides crucial data for immediate therapeutic interventions. By standardizing the use of specific renal cellular stress markers, clinical laboratories ensure superior diagnostic accuracy and data reproducibility.
  • These targeted boardroom investments not only streamline complex testing workflows but also establish a scalable framework for personalized medicine, securing long-term operational resilience and elevating the standard of critical care nephrology.

What are the Key Data Covered in this Renal Biomarkers Market Research and Growth Report?

  • What is the expected growth of the Renal Biomarkers Market between 2026 and 2030?

    • USD 1.61 billion, at a CAGR of 13.7%

  • What segmentation does the market report cover?

    • The report is segmented by End-user (Hospitals, Clinics and diagnostic laboratories, and Research laboratories), Type (Functional biomarkers, Upregulated protein biomarkers, and Others), Diagnostic Methods (Enzyme-linked immunosorbent assay, Particle-enhanced turbidimetric immunoassay, Colorimetric assay, Chemiluminescent immunoassay, and Others) and Geography (North America, Europe, Asia, Rest of World (ROW))

  • Which regions are analyzed in the report?

    • North America, Europe, Asia and Rest of World (ROW)

  • What are the key growth drivers and market challenges?

    • Rising global prevalence of kidney diseases, High cost and reimbursement hurdles

  • Who are the major players in the Renal Biomarkers Market?

    • Abbott Laboratories, Beckman Coulter Inc., Bio Techne Corp., BioMerieux SA, BioPorto AS, BioVendor LM, CUSABIO Technology LLC, DiaSys Diagnostic Systems, Elabscience Biotechnology Inc., F. Hoffmann La Roche Ltd., Gentian Diagnostics ASA, Getein Biotech Inc., Guangzhou Wondfo Biotech Co Ltd, Hycult Biotech B.V., Randox Laboratories Ltd., Sekisui Diagnostics LLC, Shenzhen Mindray Co. Ltd., Siemens Healthineers AG and Snibe Co.Ltd.

Market Research Insights

  • The renal biomarkers market undergoes rapid transformation as healthcare networks prioritize precision diagnostic data to enhance chronic condition management. Facilities implementing advanced outpatient renal screening programs demonstrate a 30% reduction in late-stage disease complications, driven by earlier therapeutic interventions.
  • Furthermore, pharmaceutical developers utilizing novel markers for clinical trial safety endpoints report a 20% decrease in late-phase drug attrition related to nephrotoxicity. This shift toward proactive monitoring establishes robust longitudinal health tracking, allowing clinicians to adjust treatments dynamically.
  • Consequently, diagnostic providers continuously refine their automated platforms to deliver faster, highly accurate results, fundamentally altering operational workflows and improving overall patient outcomes across decentralized testing environments.

We can help! Our analysts can customize this renal biomarkers market research report to meet your requirements.

Get in touch

1. Executive Summary

1.1 Market overview

Executive Summary - Chart on Market Overview
Executive Summary - Data Table on Market Overview
Executive Summary - Chart on Global Market Characteristics
Executive Summary - Chart on Market by Geography
Executive Summary - Chart on Market Segmentation by End-user
Executive Summary - Chart on Market Segmentation by Type
Executive Summary - Chart on Market Segmentation by Diagnostic Methods
Executive Summary - Chart on Incremental Growth
Executive Summary - Data Table on Incremental Growth
Executive Summary - Chart on Company Market Positioning

2. Technavio Analysis

2.1 Analysis of price sensitivity, lifecycle, customer purchase basket, adoption rates, and purchase criteria

2.2 Criticality of inputs and Factors of differentiation

Chart on Overview on criticality of inputs and factors of differentiation

2.3 Factors of disruption

Chart on Overview on factors of disruption

2.4 Impact of drivers and challenges

Chart on Impact of drivers and challenges in 2025 and 2030

3. Market Landscape

3.1 Market ecosystem

Chart on Parent Market
Data Table on - Parent Market

3.2 Market characteristics

Chart on Market characteristics analysis

3.3 Value chain analysis

Chart on Value chain analysis

4. Market Sizing

4.1 Market definition

Data Table on Offerings of companies included in the market definition

4.2 Market segment analysis

Market segments

4.3 Market size 2025

4.4 Market outlook: Forecast for 2025-2030

Chart on Global - Market size and forecast 2025-2030 ($ million)
Data Table on Global - Market size and forecast 2025-2030 ($ million)
Chart on Global Market: Year-over-year growth 2025-2030 (%)
Data Table on Global Market: Year-over-year growth 2025-2030 (%)

5. Historic Market Size

5.1 Global Renal Biomarkers Market 2020 - 2024

Historic Market Size - Data Table on Global Renal Biomarkers Market 2020 - 2024 ($ million)

5.2 End-user segment analysis 2020 - 2024

Historic Market Size - End-user Segment 2020 - 2024 ($ million)

5.3 Type segment analysis 2020 - 2024

Historic Market Size - Type Segment 2020 - 2024 ($ million)

5.4 Diagnostic Methods segment analysis 2020 - 2024

Historic Market Size - Diagnostic Methods Segment 2020 - 2024 ($ million)

5.5 Geography segment analysis 2020 - 2024

Historic Market Size - Geography Segment 2020 - 2024 ($ million)

5.6 Country segment analysis 2020 - 2024

Historic Market Size - Country Segment 2020 - 2024 ($ million)

6. Qualitative Analysis

6.1 Impact of AI on Global Renal Biomarkers Market

6.2 Impact of Geopolitical Conflicts on Global Renal Biomarkers Market

7. Five Forces Analysis

7.1 Five forces summary

Five forces analysis - Comparison between 2025 and 2030

7.2 Bargaining power of buyers

Bargaining power of buyers - Impact of key factors 2025 and 2030

7.3 Bargaining power of suppliers

Bargaining power of suppliers - Impact of key factors in 2025 and 2030

7.4 Threat of new entrants

Threat of new entrants - Impact of key factors in 2025 and 2030

7.5 Threat of substitutes

Threat of substitutes - Impact of key factors in 2025 and 2030

7.6 Threat of rivalry

Threat of rivalry - Impact of key factors in 2025 and 2030

7.7 Market condition

Chart on Market condition - Five forces 2025 and 2030

8. Market Segmentation by End-user

8.1 Market segments

Chart on End-user - Market share 2025-2030 (%)
Data Table on End-user - Market share 2025-2030 (%)

8.2 Comparison by End-user

Chart on Comparison by End-user
Data Table on Comparison by End-user

8.3 Hospitals - Market size and forecast 2025-2030

Chart on Hospitals - Market size and forecast 2025-2030 ($ million)
Data Table on Hospitals - Market size and forecast 2025-2030 ($ million)
Chart on Hospitals - Year-over-year growth 2025-2030 (%)
Data Table on Hospitals - Year-over-year growth 2025-2030 (%)

8.4 Clinics and diagnostic laboratories - Market size and forecast 2025-2030

Chart on Clinics and diagnostic laboratories - Market size and forecast 2025-2030 ($ million)
Data Table on Clinics and diagnostic laboratories - Market size and forecast 2025-2030 ($ million)
Chart on Clinics and diagnostic laboratories - Year-over-year growth 2025-2030 (%)
Data Table on Clinics and diagnostic laboratories - Year-over-year growth 2025-2030 (%)

8.5 Research laboratories - Market size and forecast 2025-2030

Chart on Research laboratories - Market size and forecast 2025-2030 ($ million)
Data Table on Research laboratories - Market size and forecast 2025-2030 ($ million)
Chart on Research laboratories - Year-over-year growth 2025-2030 (%)
Data Table on Research laboratories - Year-over-year growth 2025-2030 (%)

8.6 Market opportunity by End-user

Market opportunity by End-user ($ million)
Data Table on Market opportunity by End-user ($ million)

9. Market Segmentation by Type

9.1 Market segments

Chart on Type - Market share 2025-2030 (%)
Data Table on Type - Market share 2025-2030 (%)

9.2 Comparison by Type

Chart on Comparison by Type
Data Table on Comparison by Type

9.3 Functional biomarkers - Market size and forecast 2025-2030

Chart on Functional biomarkers - Market size and forecast 2025-2030 ($ million)
Data Table on Functional biomarkers - Market size and forecast 2025-2030 ($ million)
Chart on Functional biomarkers - Year-over-year growth 2025-2030 (%)
Data Table on Functional biomarkers - Year-over-year growth 2025-2030 (%)

9.4 Upregulated protein biomarkers - Market size and forecast 2025-2030

Chart on Upregulated protein biomarkers - Market size and forecast 2025-2030 ($ million)
Data Table on Upregulated protein biomarkers - Market size and forecast 2025-2030 ($ million)
Chart on Upregulated protein biomarkers - Year-over-year growth 2025-2030 (%)
Data Table on Upregulated protein biomarkers - Year-over-year growth 2025-2030 (%)

9.5 Others - Market size and forecast 2025-2030

Chart on Others - Market size and forecast 2025-2030 ($ million)
Data Table on Others - Market size and forecast 2025-2030 ($ million)
Chart on Others - Year-over-year growth 2025-2030 (%)
Data Table on Others - Year-over-year growth 2025-2030 (%)

9.6 Market opportunity by Type

Market opportunity by Type ($ million)
Data Table on Market opportunity by Type ($ million)

10. Market Segmentation by Diagnostic Methods

10.1 Market segments

Chart on Diagnostic Methods - Market share 2025-2030 (%)
Data Table on Diagnostic Methods - Market share 2025-2030 (%)

10.2 Comparison by Diagnostic Methods

Chart on Comparison by Diagnostic Methods
Data Table on Comparison by Diagnostic Methods

10.3 Enzyme-linked immunosorbent assay - Market size and forecast 2025-2030

Chart on Enzyme-linked immunosorbent assay - Market size and forecast 2025-2030 ($ million)
Data Table on Enzyme-linked immunosorbent assay - Market size and forecast 2025-2030 ($ million)
Chart on Enzyme-linked immunosorbent assay - Year-over-year growth 2025-2030 (%)
Data Table on Enzyme-linked immunosorbent assay - Year-over-year growth 2025-2030 (%)

10.4 Particle-enhanced turbidimetric immunoassay - Market size and forecast 2025-2030

Chart on Particle-enhanced turbidimetric immunoassay - Market size and forecast 2025-2030 ($ million)
Data Table on Particle-enhanced turbidimetric immunoassay - Market size and forecast 2025-2030 ($ million)
Chart on Particle-enhanced turbidimetric immunoassay - Year-over-year growth 2025-2030 (%)
Data Table on Particle-enhanced turbidimetric immunoassay - Year-over-year growth 2025-2030 (%)

10.5 Colorimetric assay - Market size and forecast 2025-2030

Chart on Colorimetric assay - Market size and forecast 2025-2030 ($ million)
Data Table on Colorimetric assay - Market size and forecast 2025-2030 ($ million)
Chart on Colorimetric assay - Year-over-year growth 2025-2030 (%)
Data Table on Colorimetric assay - Year-over-year growth 2025-2030 (%)

10.6 Chemiluminescent immunoassay - Market size and forecast 2025-2030

Chart on Chemiluminescent immunoassay - Market size and forecast 2025-2030 ($ million)
Data Table on Chemiluminescent immunoassay - Market size and forecast 2025-2030 ($ million)
Chart on Chemiluminescent immunoassay - Year-over-year growth 2025-2030 (%)
Data Table on Chemiluminescent immunoassay - Year-over-year growth 2025-2030 (%)

10.7 Others - Market size and forecast 2025-2030

Chart on Others - Market size and forecast 2025-2030 ($ million)
Data Table on Others - Market size and forecast 2025-2030 ($ million)
Chart on Others - Year-over-year growth 2025-2030 (%)
Data Table on Others - Year-over-year growth 2025-2030 (%)

10.8 Market opportunity by Diagnostic Methods

Market opportunity by Diagnostic Methods ($ million)
Data Table on Market opportunity by Diagnostic Methods ($ million)

11. Customer Landscape

11.1 Customer landscape overview

Analysis of price sensitivity, lifecycle, customer purchase basket, adoption rates, and purchase criteria

12. Geographic Landscape

12.1 Geographic segmentation

Chart on Market share by geography 2025-2030 (%)
Data Table on Market share by geography 2025-2030 (%)

12.2 Geographic comparison

Chart on Geographic comparison
Data Table on Geographic comparison

12.3 North America - Market size and forecast 2025-2030

Chart on North America - Market size and forecast 2025-2030 ($ million)
Data Table on North America - Market size and forecast 2025-2030 ($ million)
Chart on North America - Year-over-year growth 2025-2030 (%)
Data Table on North America - Year-over-year growth 2025-2030 (%)
Chart on Regional Comparison - North America
Data Table on Regional Comparison - North America

12.3.1 US - Market size and forecast 2025-2030

Chart on US - Market size and forecast 2025-2030 ($ million)
Data Table on US - Market size and forecast 2025-2030 ($ million)
Chart on US - Year-over-year growth 2025-2030 (%)
Data Table on US - Year-over-year growth 2025-2030 (%)

12.3.2 Canada - Market size and forecast 2025-2030

Chart on Canada - Market size and forecast 2025-2030 ($ million)
Data Table on Canada - Market size and forecast 2025-2030 ($ million)
Chart on Canada - Year-over-year growth 2025-2030 (%)
Data Table on Canada - Year-over-year growth 2025-2030 (%)

12.3.3 Mexico - Market size and forecast 2025-2030

Chart on Mexico - Market size and forecast 2025-2030 ($ million)
Data Table on Mexico - Market size and forecast 2025-2030 ($ million)
Chart on Mexico - Year-over-year growth 2025-2030 (%)
Data Table on Mexico - Year-over-year growth 2025-2030 (%)

12.4 Europe - Market size and forecast 2025-2030

Chart on Europe - Market size and forecast 2025-2030 ($ million)
Data Table on Europe - Market size and forecast 2025-2030 ($ million)
Chart on Europe - Year-over-year growth 2025-2030 (%)
Data Table on Europe - Year-over-year growth 2025-2030 (%)
Chart on Regional Comparison - Europe
Data Table on Regional Comparison - Europe

12.4.1 Germany - Market size and forecast 2025-2030

Chart on Germany - Market size and forecast 2025-2030 ($ million)
Data Table on Germany - Market size and forecast 2025-2030 ($ million)
Chart on Germany - Year-over-year growth 2025-2030 (%)
Data Table on Germany - Year-over-year growth 2025-2030 (%)

12.4.2 UK - Market size and forecast 2025-2030

Chart on UK - Market size and forecast 2025-2030 ($ million)
Data Table on UK - Market size and forecast 2025-2030 ($ million)
Chart on UK - Year-over-year growth 2025-2030 (%)
Data Table on UK - Year-over-year growth 2025-2030 (%)

12.4.3 France - Market size and forecast 2025-2030

Chart on France - Market size and forecast 2025-2030 ($ million)
Data Table on France - Market size and forecast 2025-2030 ($ million)
Chart on France - Year-over-year growth 2025-2030 (%)
Data Table on France - Year-over-year growth 2025-2030 (%)

12.4.4 Italy - Market size and forecast 2025-2030

Chart on Italy - Market size and forecast 2025-2030 ($ million)
Data Table on Italy - Market size and forecast 2025-2030 ($ million)
Chart on Italy - Year-over-year growth 2025-2030 (%)
Data Table on Italy - Year-over-year growth 2025-2030 (%)

12.4.5 Spain - Market size and forecast 2025-2030

Chart on Spain - Market size and forecast 2025-2030 ($ million)
Data Table on Spain - Market size and forecast 2025-2030 ($ million)
Chart on Spain - Year-over-year growth 2025-2030 (%)
Data Table on Spain - Year-over-year growth 2025-2030 (%)

12.4.6 The Netherlands - Market size and forecast 2025-2030

Chart on The Netherlands - Market size and forecast 2025-2030 ($ million)
Data Table on The Netherlands - Market size and forecast 2025-2030 ($ million)
Chart on The Netherlands - Year-over-year growth 2025-2030 (%)
Data Table on The Netherlands - Year-over-year growth 2025-2030 (%)

12.5 Asia - Market size and forecast 2025-2030

Chart on Asia - Market size and forecast 2025-2030 ($ million)
Data Table on Asia - Market size and forecast 2025-2030 ($ million)
Chart on Asia - Year-over-year growth 2025-2030 (%)
Data Table on Asia - Year-over-year growth 2025-2030 (%)
Chart on Regional Comparison - Asia
Data Table on Regional Comparison - Asia

12.5.1 China - Market size and forecast 2025-2030

Chart on China - Market size and forecast 2025-2030 ($ million)
Data Table on China - Market size and forecast 2025-2030 ($ million)
Chart on China - Year-over-year growth 2025-2030 (%)
Data Table on China - Year-over-year growth 2025-2030 (%)

12.5.2 Japan - Market size and forecast 2025-2030

Chart on Japan - Market size and forecast 2025-2030 ($ million)
Data Table on Japan - Market size and forecast 2025-2030 ($ million)
Chart on Japan - Year-over-year growth 2025-2030 (%)
Data Table on Japan - Year-over-year growth 2025-2030 (%)

12.5.3 India - Market size and forecast 2025-2030

Chart on India - Market size and forecast 2025-2030 ($ million)
Data Table on India - Market size and forecast 2025-2030 ($ million)
Chart on India - Year-over-year growth 2025-2030 (%)
Data Table on India - Year-over-year growth 2025-2030 (%)

12.5.4 South Korea - Market size and forecast 2025-2030

Chart on South Korea - Market size and forecast 2025-2030 ($ million)
Data Table on South Korea - Market size and forecast 2025-2030 ($ million)
Chart on South Korea - Year-over-year growth 2025-2030 (%)
Data Table on South Korea - Year-over-year growth 2025-2030 (%)

12.5.5 Indonesia - Market size and forecast 2025-2030

Chart on Indonesia - Market size and forecast 2025-2030 ($ million)
Data Table on Indonesia - Market size and forecast 2025-2030 ($ million)
Chart on Indonesia - Year-over-year growth 2025-2030 (%)
Data Table on Indonesia - Year-over-year growth 2025-2030 (%)

12.5.6 Thailand - Market size and forecast 2025-2030

Chart on Thailand - Market size and forecast 2025-2030 ($ million)
Data Table on Thailand - Market size and forecast 2025-2030 ($ million)
Chart on Thailand - Year-over-year growth 2025-2030 (%)
Data Table on Thailand - Year-over-year growth 2025-2030 (%)

12.6 Rest of World (ROW) - Market size and forecast 2025-2030

Chart on Rest of World (ROW) - Market size and forecast 2025-2030 ($ million)
Data Table on Rest of World (ROW) - Market size and forecast 2025-2030 ($ million)
Chart on Rest of World (ROW) - Year-over-year growth 2025-2030 (%)
Data Table on Rest of World (ROW) - Year-over-year growth 2025-2030 (%)
Chart on Regional Comparison - Rest of World (ROW)
Data Table on Regional Comparison - Rest of World (ROW)

12.6.1 Brazil - Market size and forecast 2025-2030

Chart on Brazil - Market size and forecast 2025-2030 ($ million)
Data Table on Brazil - Market size and forecast 2025-2030 ($ million)
Chart on Brazil - Year-over-year growth 2025-2030 (%)
Data Table on Brazil - Year-over-year growth 2025-2030 (%)

12.6.2 Saudi Arabia - Market size and forecast 2025-2030

Chart on Saudi Arabia - Market size and forecast 2025-2030 ($ million)
Data Table on Saudi Arabia - Market size and forecast 2025-2030 ($ million)
Chart on Saudi Arabia - Year-over-year growth 2025-2030 (%)
Data Table on Saudi Arabia - Year-over-year growth 2025-2030 (%)

12.6.3 UAE - Market size and forecast 2025-2030

Chart on UAE - Market size and forecast 2025-2030 ($ million)
Data Table on UAE - Market size and forecast 2025-2030 ($ million)
Chart on UAE - Year-over-year growth 2025-2030 (%)
Data Table on UAE - Year-over-year growth 2025-2030 (%)

12.6.4 Turkey - Market size and forecast 2025-2030

Chart on Turkey - Market size and forecast 2025-2030 ($ million)
Data Table on Turkey - Market size and forecast 2025-2030 ($ million)
Chart on Turkey - Year-over-year growth 2025-2030 (%)
Data Table on Turkey - Year-over-year growth 2025-2030 (%)

12.6.5 South Africa - Market size and forecast 2025-2030

Chart on South Africa - Market size and forecast 2025-2030 ($ million)
Data Table on South Africa - Market size and forecast 2025-2030 ($ million)
Chart on South Africa - Year-over-year growth 2025-2030 (%)
Data Table on South Africa - Year-over-year growth 2025-2030 (%)

12.6.6 Israel - Market size and forecast 2025-2030

Chart on Israel - Market size and forecast 2025-2030 ($ million)
Data Table on Israel - Market size and forecast 2025-2030 ($ million)
Chart on Israel - Year-over-year growth 2025-2030 (%)
Data Table on Israel - Year-over-year growth 2025-2030 (%)

12.6.7 Argentina - Market size and forecast 2025-2030

Chart on Argentina - Market size and forecast 2025-2030 ($ million)
Data Table on Argentina - Market size and forecast 2025-2030 ($ million)
Chart on Argentina - Year-over-year growth 2025-2030 (%)
Data Table on Argentina - Year-over-year growth 2025-2030 (%)

12.6.8 Colombia - Market size and forecast 2025-2030

Chart on Colombia - Market size and forecast 2025-2030 ($ million)
Data Table on Colombia - Market size and forecast 2025-2030 ($ million)
Chart on Colombia - Year-over-year growth 2025-2030 (%)
Data Table on Colombia - Year-over-year growth 2025-2030 (%)

12.7 Market opportunity by geography

Market opportunity by geography ($ million)
Data Tables on Market opportunity by geography ($ million)

13. Drivers, Challenges, and Opportunity

13.1 Market drivers

Rising global prevalence of kidney diseases
Technological advancements in discovery and diagnostics
Paradigm shift toward early detection and personalized medicine

13.2 Market challenges

High cost and reimbursement hurdles
Regulatory complexity and stringent validation requirements
Barriers to clinical adoption and integration

13.3 Impact of drivers and challenges

Impact of drivers and challenges in 2025 and 2030

13.4 Market opportunities

Increasing adoption of point-of-care testing
Emphasis on multiplex biomarker panels
Integration of AI and machine learning

14. Competitive Landscape

14.1 Overview

14.2

Overview on criticality of inputs and factors of differentiation

14.3 Landscape disruption

Overview on factors of disruption

14.4 Industry risks

Impact of key risks on business

15. Competitive Analysis

15.1 Companies profiled

Companies covered

15.2 Company ranking index

15.3 Market positioning of companies

Matrix on companies position and classification

15.4 Abbott Laboratories

Abbott Laboratories - Overview
Abbott Laboratories - Business segments
Abbott Laboratories - Key news
Abbott Laboratories - Key offerings
Abbott Laboratories - Segment focus
SWOT

15.5 Beckman Coulter Inc.

Beckman Coulter Inc. - Overview
Beckman Coulter Inc. - Product / Service
Beckman Coulter Inc. - Key offerings
SWOT

15.6 Bio Techne Corp.

Bio Techne Corp. - Overview
Bio Techne Corp. - Business segments
Bio Techne Corp. - Key news
Bio Techne Corp. - Key offerings
Bio Techne Corp. - Segment focus
SWOT

15.7 BioMerieux SA

BioMerieux SA - Overview
BioMerieux SA - Business segments
BioMerieux SA - Key offerings
BioMerieux SA - Segment focus
SWOT

15.8 BioVendor LM

BioVendor LM - Overview
BioVendor LM - Product / Service
BioVendor LM - Key offerings
SWOT

15.9 CUSABIO Technology LLC

CUSABIO Technology LLC - Overview
CUSABIO Technology LLC - Product / Service
CUSABIO Technology LLC - Key offerings
SWOT

15.10 Elabscience Biotechnology Inc.

Elabscience Biotechnology Inc. - Overview
Elabscience Biotechnology Inc. - Product / Service
Elabscience Biotechnology Inc. - Key offerings
SWOT

15.11 F. Hoffmann La Roche Ltd.

F. Hoffmann La Roche Ltd. - Overview
F. Hoffmann La Roche Ltd. - Business segments
F. Hoffmann La Roche Ltd. - Key news
F. Hoffmann La Roche Ltd. - Key offerings
F. Hoffmann La Roche Ltd. - Segment focus
SWOT

15.12 Getein Biotech Inc.

Getein Biotech Inc. - Overview
Getein Biotech Inc. - Product / Service
Getein Biotech Inc. - Key offerings
SWOT

15.13 Guangzhou Wondfo Biotech Co Ltd

Guangzhou Wondfo Biotech Co Ltd - Overview
Guangzhou Wondfo Biotech Co Ltd - Product / Service
Guangzhou Wondfo Biotech Co Ltd - Key offerings
SWOT

15.14 Randox Laboratories Ltd.

Randox Laboratories Ltd. - Overview
Randox Laboratories Ltd. - Product / Service
Randox Laboratories Ltd. - Key offerings
SWOT

15.15 Sekisui Diagnostics LLC

Sekisui Diagnostics LLC - Overview
Sekisui Diagnostics LLC - Product / Service
Sekisui Diagnostics LLC - Key offerings
SWOT

15.16 Shenzhen Mindray Co. Ltd.

Shenzhen Mindray Co. Ltd. - Overview
Shenzhen Mindray Co. Ltd. - Business segments
Shenzhen Mindray Co. Ltd. - Key offerings
Shenzhen Mindray Co. Ltd. - Segment focus
SWOT

15.17 Siemens Healthineers AG

Siemens Healthineers AG - Overview
Siemens Healthineers AG - Business segments
Siemens Healthineers AG - Key offerings
Siemens Healthineers AG - Segment focus
SWOT

15.18 Snibe Co.Ltd.

Snibe Co.Ltd. - Overview
Snibe Co.Ltd. - Product / Service
Snibe Co.Ltd. - Key offerings
SWOT

16. Appendix

16.1 Scope of the report

Market definition
Objectives
Notes and caveats

16.2 Inclusions and exclusions checklist

Inclusions checklist
Exclusions checklist

16.3 Currency conversion rates for US$

16.4 Research methodology

16.5 Data procurement

Information sources

16.6 Data validation

16.7 Validation techniques employed for market sizing

16.8 Data synthesis

16.9 360 degree market analysis

16.10 List of abbreviations

Research Methodology

Technavio presents a detailed picture of the market by way of study, synthesis, and summation of data from multiple sources. The analysts have presented the various facets of the market with a particular focus on identifying the key industry influencers. The data thus presented is comprehensive, reliable, and the result of extensive research, both primary and secondary.

INFORMATION SOURCES

Primary sources

  • Manufacturers and suppliers
  • Channel partners
  • Industry experts
  • Strategic decision makers

Secondary sources

  • Industry journals and periodicals
  • Government data
  • Financial reports of key industry players
  • Historical data
  • Press releases

DATA ANALYSIS

Data Synthesis

  • Collation of data
  • Estimation of key figures
  • Analysis of derived insights

Data Validation

  • Triangulation with data models
  • Reference against proprietary databases
  • Corroboration with industry experts

REPORT WRITING

Qualitative

  • Market drivers
  • Market challenges
  • Market trends
  • Five forces analysis

Quantitative

  • Market size and forecast
  • Market segmentation
  • Geographical insights
  • Competitive landscape

Interested in this report?

Get your sample now to see our research methodology and insights!

Download Now

Frequently Asked Questions

Renal Biomarkers market growth will increase by USD 1610.3 million during 2026-2030.

The Renal Biomarkers market is expected to grow at a CAGR of 13.7% during 2026-2030.

Renal Biomarkers market is segmented by End-user (Hospitals, Clinics and diagnostic laboratories, Research laboratories) Type (Functional biomarkers, Upregulated protein biomarkers, Others) Diagnostic methods (Enzyme-linked immunosorbent assay, Particle-enhanced turbidimetric immunoassay, Colorimetric assay, Chemiluminescent immunoassay, Others)

Abbott Laboratories, Beckman Coulter Inc., Bio Techne Corp., BioMerieux SA, BioPorto AS, BioVendor LM, CUSABIO Technology LLC, DiaSys Diagnostic Systems, Elabscience Biotechnology Inc., F. Hoffmann La Roche Ltd., Gentian Diagnostics ASA, Getein Biotech Inc., Guangzhou Wondfo Biotech Co Ltd, Hycult Biotech B.V., Randox Laboratories Ltd., Sekisui Diagnostics LLC, Shenzhen Mindray Co. Ltd., Siemens Healthineers AG, Snibe Co.Ltd. are a few of the key vendors in the Renal Biomarkers market.

North America will register the highest growth rate of 68.3% among the other regions. Therefore, the Renal Biomarkers market in North America is expected to garner significant business opportunities for the vendors during the forecast period.

US, Canada, Mexico, Germany, UK, France, Italy, Spain, The Netherlands, China, Japan, India, South Korea, Indonesia, Thailand, Brazil, Saudi Arabia, UAE, Turkey, South Africa, Israel, Argentina, Colombia

  • Rising global prevalence of kidney diseases is the driving factor this market.

The Renal Biomarkers market vendors should focus on grabbing business opportunities from the End-user segment as it accounted for the largest market share in the base year.
RIA - Research AI Assistant
Ask RIA
