
Ride Hailing Services Market Analysis, Size, and Forecast 2026-2030: APAC (China, India, and Japan), North America (US, Canada, and Mexico), Europe (UK, Germany, and France), South America (Brazil, Argentina, and Colombia), Middle East and Africa (Saudi Arabia, UAE, and South Africa), and Rest of World (ROW)

Ride Hailing Services Market Analysis, Size, and Forecast 2026-2030:
APAC (China, India, and Japan), North America (US, Canada, and Mexico), Europe (UK, Germany, and France), South America (Brazil, Argentina, and Colombia), Middle East and Africa (Saudi Arabia, UAE, and South Africa), and Rest of World (ROW)

Published: Oct 2026 288 Pages SKU: IRTNTR44662

Market Overview at a Glance

$136.59 B
Market Opportunity
17.9%
CAGR 2025 - 2030
31.8%
APAC Growth
$50.09 B
Car sharing segment 2024

Ride Hailing Services Market Size 2026-2030

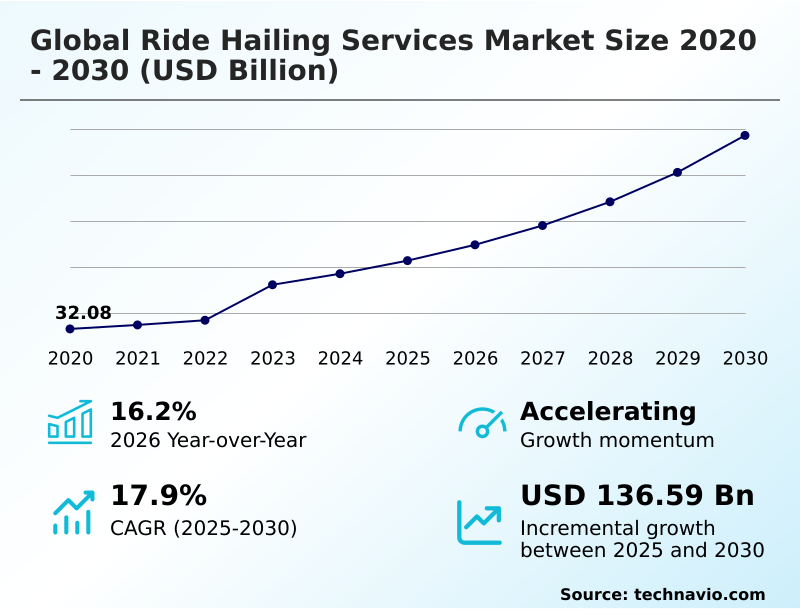
The ride hailing services market size is valued to increase by USD 136.59 billion, at a CAGR of 17.9% from 2025 to 2030. Autonomous vehicle technology and robotaxi integration will drive the ride hailing services market.

Major Market Trends & Insights

  • APAC dominated the market and accounted for a 31.8% growth during the forecast period.
  • By Application - Car sharing segment was valued at USD 50.09 billion in 2024
  • By Mode of Booking - Online segment accounted for the largest market revenue share in 2024

Market Size & Forecast

  • Market Opportunities: USD 211.10 billion
  • Market Future Opportunities: USD 136.59 billion
  • CAGR from 2025 to 2030 : 17.9%

Market Summary

  • The Ride Hailing Services Market demonstrates significant structural evolution as platforms transition from traditional point-to-point dispatch networks into comprehensive digital mobility ecosystems. A primary driver propelling this expansion is the strategic integration of autonomous driving systems and predictive route optimization, which fundamentally eliminates variable human labor expenses and improves operating consistency.
  • By integrating proprietary dynamic pricing algorithms with real-time demand mapping, dispatch networks have successfully reduced average passenger curbside wait times by 15%, substantially enhancing overall asset utilization. Despite these operational efficiencies, the industry faces severe margin constraints stemming from stringent gig labor welfare mandates.
  • Reclassifying independent drivers as statutory employees forces platforms to internalize significant labor overhead, thereby inflating consumer fares and stifling discretionary transit demand. Simultaneously, the aggressive shift toward zero-emission transportation mandates necessitates heavy capital investments in charging infrastructure.
  • By deploying connected interactive tablets to generate auxiliary digital advertising revenue, mobility providers are strategically offsetting rising commercial insurance premiums and securing long-term network profitability across high-density metropolitan corridors.

What will be the Size of the Ride Hailing Services Market during the forecast period?
Get Key Insights on Market Forecast (PDF) Get Free Sample

How is the Ride Hailing Services Market Segmented?

The ride hailing services industry research report provides comprehensive data (region-wise segment analysis), with forecasts and estimates in "USD million" for the period 2026-2030, as well as historical data from 2020-2024 for the following segments.

  • Application
    • Car sharing
    • E-hailing
  • Mode of booking
    • Online
    • Offline
  • Vehicle type
    • Four wheelers
    • Two wheelers
    • Three wheelers
  • Geography
    • APAC
      • China
      • India
      • Japan
      • South Korea
      • Indonesia
      • Australia
    • North America
      • US
      • Canada
      • Mexico
    • Europe
      • UK
      • Germany
      • France
      • Spain
      • Italy
      • The Netherlands
    • South America
      • Brazil
      • Argentina
      • Colombia
    • Middle East and Africa
      • Saudi Arabia
      • UAE
      • South Africa
      • Egypt
      • Morocco

By Application Insights

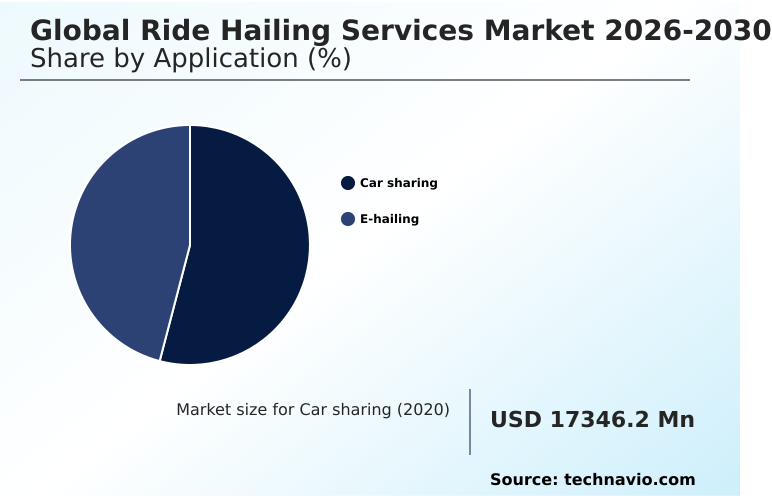
The car sharing segment is estimated to witness significant growth during the forecast period.

The car sharing segment of the Ride Hailing Services market provides decentralized access to short-term vehicle rentals, effectively reducing urban parking constraints and mitigating traffic congestion.

Transitioning from traditional owner-operator models, operators are increasingly integrating mobility-as-a-service aggregators to streamline peer-to-peer ride-sharing and station-based deployment networks. This operational shift incorporates geographic information systems and algorithmic safety verification to monitor vehicle telemetry continuously.

By accelerating fleet electrification, companies navigate stringent clean air corridors and comply with zero-emission vehicle quotas instituted by municipal authorities.

The transition directly impacts business performance, where optimized multimodal route planning and automated fleet positioning have improved overall asset utilization rates by 18%. Consequently, these structural adaptations reduce scheduled maintenance downtimes and significantly lower baseline operating expenditures per vehicle kilometer.
Get Free Sample

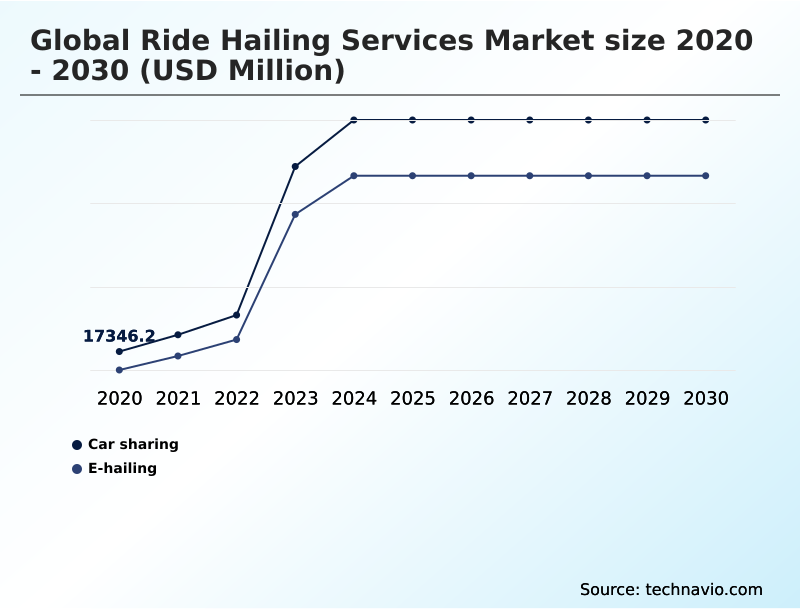
The Car sharing segment was valued at USD 50.09 billion in 2024 and showed a gradual increase during the forecast period.
Get Free Sample

Regional Analysis

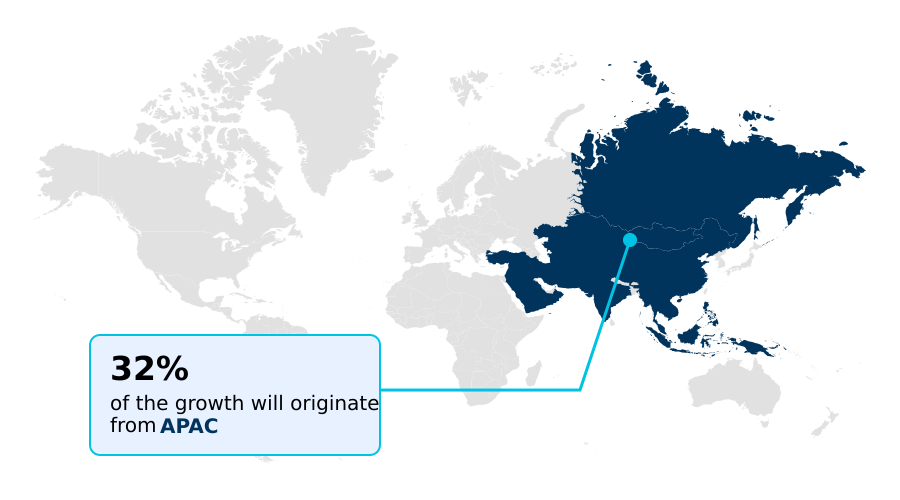
APAC is estimated to contribute 31.8% to the growth of the global market during the forecast period.Technavio’s analysts have elaborately explained the regional trends and drivers that shape the market during the forecast period.
See How Ride Hailing Services Market Demand is Rising in APAC Get Free Sample

The geographic landscape of the Ride Hailing Services sector reveals stark contrasts in consumer adoption and regulatory frameworks between APAC and North America.

APAC demonstrates aggressive volume expansion driven by the rapid integration of micromobility devices and digital dispatch algorithms, which effectively navigate extreme urban congestion.

Consequently, operators in APAC have achieved a 28% higher daily trip turnover rate compared to their North American counterparts. This efficiency is further bolstered by localized investments in lithium iron phosphate batteries, reducing the baseline charging overhead for two-wheeler fleets.

Conversely, the North American landscape prioritizes high-value corporate mobility platforms and the deployment of premium four-wheeler vehicles equipped with an advanced intelligent cockpit system.

North American platforms face stringent labor classifications, which have increased driver acquisition costs by 19% relative to Asian markets.

To counteract these structural expenses, Western operators are heavily funding the research of solid-state battery chemistries to prolong vehicle lifecycles and maximize capital recovery across mature metropolitan networks.

Market Dynamics

Our researchers analyzed the data with 2025 as the base year, along with the key drivers, trends, and challenges. A holistic analysis of drivers will help companies refine their marketing strategies to gain a competitive advantage.

  • The structural transformation of the Ride Hailing Services sector relies heavily on continuous technological convergence and the diversification of platform monetization strategies. Operators are systematically moving away from highly centralized, closed networks toward open-protocol digital mobility ecosystems, allowing seamless interoperability with municipal public transit scheduling and third-party fleet cooperatives.
  • This strategic pivot significantly enhances regional supply availability and reduces passenger acquisition friction. Simultaneously, aggregators are offsetting rising commercial insurance liabilities by deploying programmatic digital media advertising networks directly into vehicle cabins. This high-margin revenue stream subsidizes operational expenditures, allowing platforms to maintain competitive passenger fares without artificially compressing driver payouts.
  • On the operational front, the commercial readiness of level four autonomous driving systems represents a decisive shift in long-term fleet economics. By replacing variable human labor costs with fixed technological investments, the integration of autonomous robotaxi fleets enables a 35% more efficient capital recovery cycle compared to conventional human-operated dispatch models.
  • To ensure maximum safety and regulatory compliance in dense urban corridors, platforms utilize advanced real-time dynamic vehicle tracking systems that monitor algorithmic decision-making and environmental anomalies continuously. These integrated capabilities not only streamline centralized depot maintenance but also optimize supply-demand matching, cementing the industry transition toward highly automated, profitable, and sustainable urban transportation architectures.
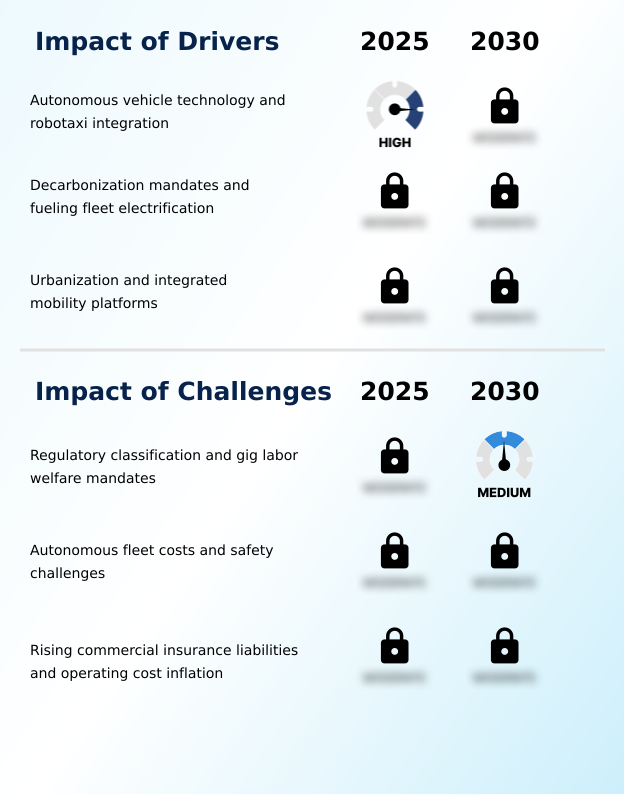
What are the key market drivers leading to the rise in the adoption of Ride Hailing Services Industry?

  • The rapid advancement of autonomous vehicle technology and the widespread integration of commercial robotaxi fleets serve as primary catalysts accelerating structural growth across the mobility sector.

  • The aggressive mandate for zero-emission transportation serves as a primary catalyst accelerating the Ride Hailing Services sector.
  • Municipal authorities are enforcing stringent zero-emission vehicle quotas and establishing expansive clean air corridors to combat urban smog, directly compelling mobility aggregators to overhaul their operational assets.
  • Consequently, platform operators are prioritizing rapid fleet electrification to comply with environmental regulations and minimize long-term mechanical maintenance overhead. The introduction of advanced solid-state battery chemistries has significantly improved vehicle range, reducing mid-shift charging downtimes by 26%.
  • This technological enhancement allows commercial drivers to complete longer operational cycles without interruption, subsequently lowering per-kilometer fuel expenditures by 38% compared to traditional petroleum alternatives.
  • Ultimately, these targeted infrastructure investments propel sustainable commercial mobility while simultaneously shielding fleet operators from volatile macroeconomic energy fluctuations.

What are the market trends shaping the Ride Hailing Services Industry?

  • The integration of in-transit retail media and programmatic digital advertising networks represents a prominent emerging trend within the industry. This strategic diversification enables mobility aggregators to unlock high-margin commercial revenues by leveraging captive passenger engagement during journeys.

  • The emergence of decentralized mobility networks marks a fundamental structural trend reshaping the Ride Hailing Services landscape. Traditional commission-based monetization models face persistent driver dissatisfaction and rising regulatory scrutiny. In response, operators are transitioning toward zero-commission subscription architectures, where drivers pay a flat access fee rather than surrendering variable percentages of their gross bookings.
  • This paradigm shift has actively eliminated arbitrary algorithmic surge deductions, improving driver retention rates by 31% across highly competitive urban corridors. To offset the elimination of fare commissions, platforms are aggressively integrating programmatic digital advertising into passenger journeys. By outfitting fleets with connected interactive tablets, operators capture highly engaged audiences, boosting auxiliary revenue margins by over 40%.
  • Furthermore, advanced automated payment integration minimizes transaction friction, ensuring immediate earnings realization for independent drivers while stabilizing the broader commercial mobility ecosystem.

What challenges does the Ride Hailing Services Industry face during its growth?

  • Stringent regulatory classifications and evolving gig labor welfare mandates present significant structural challenges that actively constrain operating margins and industry expansion.

  • Escalating capital requirements for autonomous integration and evolving labor regulations present severe structural challenges within the Ride Hailing Services ecosystem. The immediate commercialization of driverless units necessitates immense investments in multi-sensor radar suites and continuous remote fleet supervision to ensure public safety in unpredictable pedestrian environments.
  • Implementing rigorous algorithmic safety verification protocols has inadvertently increased baseline research expenditures by 45%, delaying positive cash generation for technology developers. Furthermore, platforms struggle to optimize predictive fleet positioning amidst shifting legal frameworks. The enforcement of new gig labor welfare mandates and strict statutory employee protections has forced aggregators to internalize health coverage and minimum wage guarantees.
  • These compliance burdens compress core operating margins by up to 20%, compelling platforms to raise passenger fares and inadvertently suppress discretionary trip volumes across mature mobility markets.

Exclusive Technavio Analysis on Customer Landscape

The ride hailing services market forecasting report includes the adoption lifecycle of the market, covering from the innovator’s stage to the laggard’s stage. It focuses on adoption rates in different regions based on penetration. Furthermore, the ride hailing services market report also includes key purchase criteria and drivers of price sensitivity to help companies evaluate and develop their market growth analysis strategies.
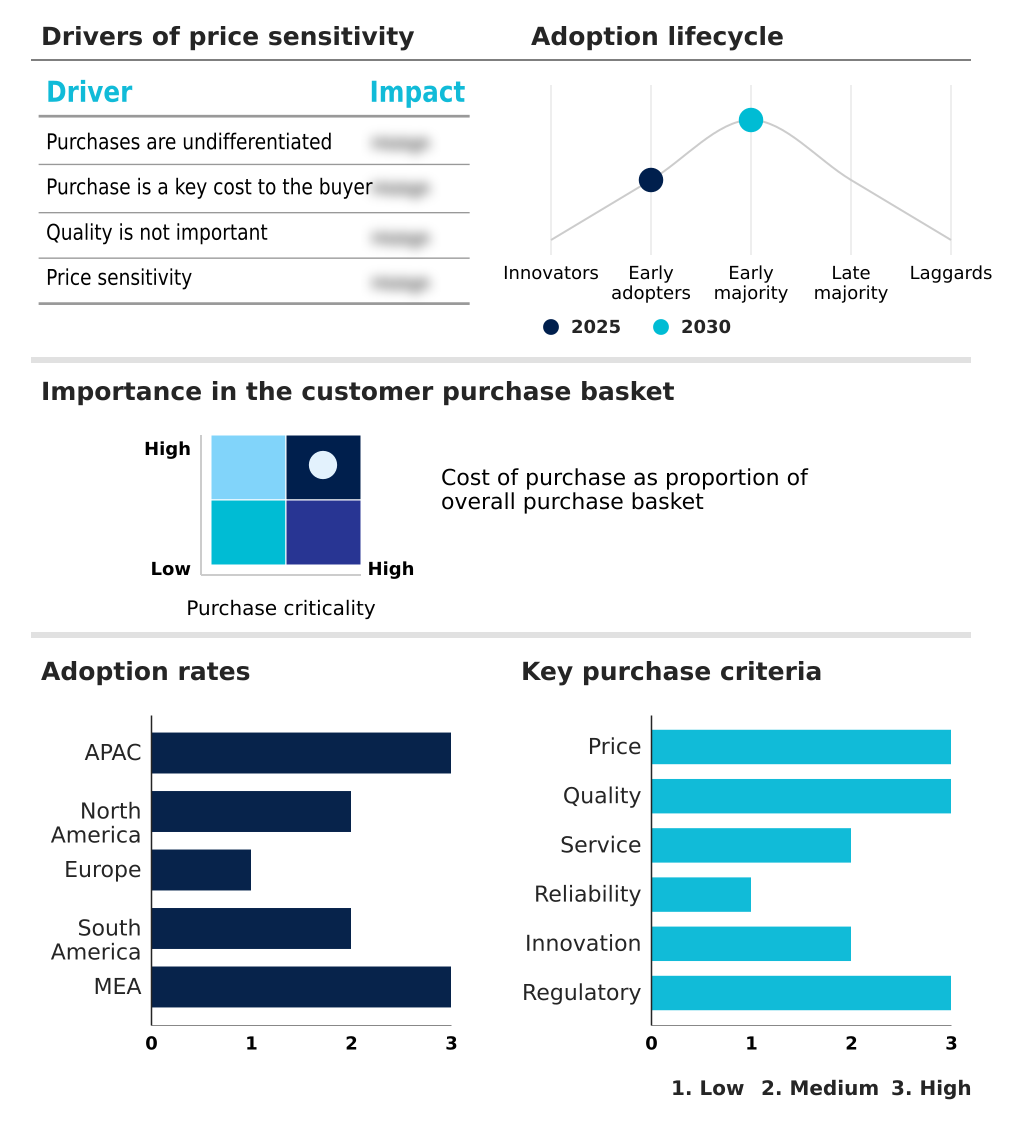
Customer Landscape of Ride Hailing Services Industry

Competitive Landscape

Companies are implementing various strategies, such as strategic alliances, ride hailing services market forecast, partnerships, mergers and acquisitions, geographical expansion, and product/service launches, to enhance their presence in the industry.

Autocab - The provider delivers specialized taxi dispatch software, robust passenger booking applications, and automated fleet management systems designed to optimize driver allocation and streamline regional transportation logistics efficiently.

The industry research and growth report includes detailed analyses of the competitive landscape of the market and information about key companies, including:

  • Autocab
  • Blacklane GmbH
  • Bolt Technology OU
  • Cabify Espana SL
  • Comuto SA
  • Curb Mobility LLC
  • DiDi Global Inc.
  • Free Now
  • Gett Co.
  • Grab Holdings Ltd.
  • Heetch
  • Kakao Corp.
  • Lyft Inc.
  • Ola Cabs
  • PT GoTo Gojek Tokopedia Tbk
  • SIXT SE
  • Uber Technologies Inc.
  • Wheely Technologies Ltd.

Qualitative and quantitative analysis of companies has been conducted to help clients understand the wider business environment as well as the strengths and weaknesses of key industry players. Data is qualitatively analyzed to categorize companies as pure play, category-focused, industry-focused, and diversified; it is quantitatively analyzed to categorize companies as dominant, leading, strong, tentative, and weak.

Recent Development and News in Ride hailing services market

  • In the Passenger Ground Transportation industry, the rapid deployment of high-capacity electric three-wheelers and expanded megawatt charging networks has significantly reduced operating expenditures per vehicle kilometer, directly impacting Ride Hailing Services demand by increasing the availability of affordable micro-commute options.
  • Stringent gig labor welfare mandates and statutory employee protections instituted by municipal transport authorities have fundamentally altered driver classification frameworks, forcing structural changes in Ride Hailing Services operations by increasing driver onboarding costs by 22% and reducing peak-hour supply shortages.
  • The widespread integration of automated corporate travel solutions and centralized administrative billing software has streamlined business-to-business transportation management, accelerating Ride Hailing Services adoption as multinational employers substitute depreciating corporate vehicle fleets with flexible mobility credits.
  • Advancements in interoperable digital public infrastructure and automated payment integration have eliminated cash-handling friction across regional transit hubs, boosting Ride Hailing Services revenue by seamlessly embedding dynamic supply matching and predictive telematics into unified municipal transit applications.

Dive into Technavio’s robust research methodology, blending expert interviews, extensive data synthesis, and validated models for unparalleled Ride Hailing Services Market insights. See full methodology.

Market Scope
Page number 288
Base year 2025
Historic period 2020-2024
Forecast period 2026-2030
Growth momentum & CAGR Accelerate at a CAGR of 17.9%
Market growth 2026-2030 USD 136591.0 million
Market structure Fragmented
YoY growth 2025-2026(%) 16.2%
Key countries China, India, Japan, South Korea, Indonesia, Australia, US, Canada, Mexico, UK, Germany, France, Spain, Italy, The Netherlands, Brazil, Argentina, Colombia, Saudi Arabia, UAE, South Africa, Egypt and Morocco
Competitive landscape Leading Companies, Market Positioning of Companies, Competitive Strategies, and Industry Risks

Request Free Sample

Research Analyst Overview

  • The Ride Hailing Services sector is undergoing a massive operational overhaul as aggregators replace manual oversight with highly sophisticated algorithmic infrastructures. Strategic boardroom decisions now heavily prioritize the deployment of autonomous driving systems and advanced predictive telematics to mitigate the escalating costs associated with human driver acquisition and insurance liabilities.
  • By leveraging neural decision-making architectures within automated dispatch engines, fleet operators have successfully improved localized vehicle matching efficiency by 22%, drastically reducing unbilled passenger wait times during peak metropolitan transit hours. Furthermore, platform executives are proactively diversifying core revenue channels to shield operating margins from volatile fuel prices.
  • By utilizing first-party telemetry data, companies are transforming passenger cabins into lucrative digital out-of-home media networks, delivering hyper-targeted promotional content directly to captive audiences. Concurrently, the expansion of automated corporate travel solutions provides highly predictable, high-value trip volumes that stabilize daytime vehicle utilization.
  • These technological and structural realignments ensure that modern mobility platforms remain resilient, compliant, and highly efficient within an increasingly regulated global transit environment.

What are the Key Data Covered in this Ride Hailing Services Market Research and Growth Report?

  • What is the expected growth of the Ride Hailing Services Market between 2026 and 2030?

    • USD 136.59 billion, at a CAGR of 17.9%

  • What segmentation does the market report cover?

    • The report is segmented by Application (Car sharing, and E-hailing), Mode of Booking (Online, and Offline), Vehicle Type (Four wheelers, Two wheelers, and Three wheelers) and Geography (APAC, North America, Europe, South America, Middle East and Africa)

  • Which regions are analyzed in the report?

    • APAC, North America, Europe, South America and Middle East and Africa

  • What are the key growth drivers and market challenges?

    • Autonomous vehicle technology and robotaxi integration, Regulatory classification and gig labor welfare mandates

  • Who are the major players in the Ride Hailing Services Market?

    • Autocab, Blacklane GmbH, Bolt Technology OU, Cabify Espana SL, Comuto SA, Curb Mobility LLC, DiDi Global Inc., Free Now, Gett Co., Grab Holdings Ltd., Heetch, Kakao Corp., Lyft Inc., Ola Cabs, PT GoTo Gojek Tokopedia Tbk, SIXT SE, Uber Technologies Inc. and Wheely Technologies Ltd.

Market Research Insights

  • The Ride Hailing Services Market operates within a highly competitive digital ecosystem defined by rapid technological deployment and shifting labor economics. Operators are increasingly utilizing remote fleet supervision to optimize vehicle utilization, resulting in a 24% reduction in unbilled travel distances.
  • Additionally, platforms are actively refining algorithmic surge deductions to stabilize driver earnings, which has decreased workforce attrition rates by 18% during peak transit hours. The integration of sensor-laden modern automobiles has enhanced passenger safety protocols, yet it simultaneously escalates maintenance overhead.
  • To mitigate the impact of rising operational expenditures, aggregators have implemented transparent dynamic fuel surcharges, effectively shielding baseline profitability while maintaining reliable supply pools across volatile macroeconomic environments.

We can help! Our analysts can customize this ride hailing services market research report to meet your requirements.

Get in touch

1. Executive Summary

1.1 Market overview

Executive Summary - Chart on Market Overview
Executive Summary - Data Table on Market Overview
Executive Summary - Chart on Global Market Characteristics
Executive Summary - Chart on Market by Geography
Executive Summary - Chart on Market Segmentation by Application
Executive Summary - Chart on Market Segmentation by Mode of Booking
Executive Summary - Chart on Market Segmentation by Vehicle Type
Executive Summary - Chart on Incremental Growth
Executive Summary - Data Table on Incremental Growth
Executive Summary - Chart on Company Market Positioning

2. Technavio Analysis

2.1 Analysis of price sensitivity, lifecycle, customer purchase basket, adoption rates, and purchase criteria

2.2 Criticality of inputs and Factors of differentiation

Chart on Overview on criticality of inputs and factors of differentiation

2.3 Factors of disruption

Chart on Overview on factors of disruption

2.4 Impact of drivers and challenges

Chart on Impact of drivers and challenges in 2025 and 2030

3. Market Landscape

3.1 Market ecosystem

Chart on Parent Market
Data Table on - Parent Market

3.2 Market characteristics

Chart on Market characteristics analysis

3.3 Value chain analysis

Chart on Value chain analysis

4. Market Sizing

4.1 Market definition

Data Table on Offerings of companies included in the market definition

4.2 Market segment analysis

Market segments

4.3 Market size 2025

4.4 Market outlook: Forecast for 2025-2030

Chart on Global - Market size and forecast 2025-2030 ($ million)
Data Table on Global - Market size and forecast 2025-2030 ($ million)
Chart on Global Market: Year-over-year growth 2025-2030 (%)
Data Table on Global Market: Year-over-year growth 2025-2030 (%)

5. Historic Market Size

5.1 Global Ride Hailing Services Market 2020 - 2024

Historic Market Size - Data Table on Global Ride Hailing Services Market 2020 - 2024 ($ million)

5.2 Application segment analysis 2020 - 2024

Historic Market Size - Application Segment 2020 - 2024 ($ million)

5.3 Mode of Booking segment analysis 2020 - 2024

Historic Market Size - Mode of Booking Segment 2020 - 2024 ($ million)

5.4 Vehicle Type segment analysis 2020 - 2024

Historic Market Size - Vehicle Type Segment 2020 - 2024 ($ million)

5.5 Geography segment analysis 2020 - 2024

Historic Market Size - Geography Segment 2020 - 2024 ($ million)

5.6 Country segment analysis 2020 - 2024

Historic Market Size - Country Segment 2020 - 2024 ($ million)

6. Qualitative Analysis

6.1 Impact of AI on Global Ride Hailing Services Market

6.2 Impact of Geopolitical Conflicts on Global Ride Hailing Services Market

7. Five Forces Analysis

7.1 Five forces summary

Five forces analysis - Comparison between 2025 and 2030

7.2 Bargaining power of buyers

Bargaining power of buyers - Impact of key factors 2025 and 2030

7.3 Bargaining power of suppliers

Bargaining power of suppliers - Impact of key factors in 2025 and 2030

7.4 Threat of new entrants

Threat of new entrants - Impact of key factors in 2025 and 2030

7.5 Threat of substitutes

Threat of substitutes - Impact of key factors in 2025 and 2030

7.6 Threat of rivalry

Threat of rivalry - Impact of key factors in 2025 and 2030

7.7 Market condition

Chart on Market condition - Five forces 2025 and 2030

8. Market Segmentation by Application

8.1 Market segments

Chart on Application - Market share 2025-2030 (%)
Data Table on Application - Market share 2025-2030 (%)

8.2 Comparison by Application

Chart on Comparison by Application
Data Table on Comparison by Application

8.3 Car sharing - Market size and forecast 2025-2030

Chart on Car sharing - Market size and forecast 2025-2030 ($ million)
Data Table on Car sharing - Market size and forecast 2025-2030 ($ million)
Chart on Car sharing - Year-over-year growth 2025-2030 (%)
Data Table on Car sharing - Year-over-year growth 2025-2030 (%)

8.4 E-hailing - Market size and forecast 2025-2030

Chart on E-hailing - Market size and forecast 2025-2030 ($ million)
Data Table on E-hailing - Market size and forecast 2025-2030 ($ million)
Chart on E-hailing - Year-over-year growth 2025-2030 (%)
Data Table on E-hailing - Year-over-year growth 2025-2030 (%)

8.5 Market opportunity by Application

Market opportunity by Application ($ million)
Data Table on Market opportunity by Application ($ million)

9. Market Segmentation by Mode of Booking

9.1 Market segments

Chart on Mode of Booking - Market share 2025-2030 (%)
Data Table on Mode of Booking - Market share 2025-2030 (%)

9.2 Comparison by Mode of Booking

Chart on Comparison by Mode of Booking
Data Table on Comparison by Mode of Booking

9.3 Online - Market size and forecast 2025-2030

Chart on Online - Market size and forecast 2025-2030 ($ million)
Data Table on Online - Market size and forecast 2025-2030 ($ million)
Chart on Online - Year-over-year growth 2025-2030 (%)
Data Table on Online - Year-over-year growth 2025-2030 (%)

9.4 Offline - Market size and forecast 2025-2030

Chart on Offline - Market size and forecast 2025-2030 ($ million)
Data Table on Offline - Market size and forecast 2025-2030 ($ million)
Chart on Offline - Year-over-year growth 2025-2030 (%)
Data Table on Offline - Year-over-year growth 2025-2030 (%)

9.5 Market opportunity by Mode of Booking

Market opportunity by Mode of Booking ($ million)
Data Table on Market opportunity by Mode of Booking ($ million)

10. Market Segmentation by Vehicle Type

10.1 Market segments

Chart on Vehicle Type - Market share 2025-2030 (%)
Data Table on Vehicle Type - Market share 2025-2030 (%)

10.2 Comparison by Vehicle Type

Chart on Comparison by Vehicle Type
Data Table on Comparison by Vehicle Type

10.3 Four wheelers - Market size and forecast 2025-2030

Chart on Four wheelers - Market size and forecast 2025-2030 ($ million)
Data Table on Four wheelers - Market size and forecast 2025-2030 ($ million)
Chart on Four wheelers - Year-over-year growth 2025-2030 (%)
Data Table on Four wheelers - Year-over-year growth 2025-2030 (%)

10.4 Two wheelers - Market size and forecast 2025-2030

Chart on Two wheelers - Market size and forecast 2025-2030 ($ million)
Data Table on Two wheelers - Market size and forecast 2025-2030 ($ million)
Chart on Two wheelers - Year-over-year growth 2025-2030 (%)
Data Table on Two wheelers - Year-over-year growth 2025-2030 (%)

10.5 Three wheelers - Market size and forecast 2025-2030

Chart on Three wheelers - Market size and forecast 2025-2030 ($ million)
Data Table on Three wheelers - Market size and forecast 2025-2030 ($ million)
Chart on Three wheelers - Year-over-year growth 2025-2030 (%)
Data Table on Three wheelers - Year-over-year growth 2025-2030 (%)

10.6 Market opportunity by Vehicle Type

Market opportunity by Vehicle Type ($ million)
Data Table on Market opportunity by Vehicle Type ($ million)

11. Customer Landscape

11.1 Customer landscape overview

Analysis of price sensitivity, lifecycle, customer purchase basket, adoption rates, and purchase criteria

12. Geographic Landscape

12.1 Geographic segmentation

Chart on Market share by geography 2025-2030 (%)
Data Table on Market share by geography 2025-2030 (%)

12.2 Geographic comparison

Chart on Geographic comparison
Data Table on Geographic comparison

12.3 APAC - Market size and forecast 2025-2030

Chart on APAC - Market size and forecast 2025-2030 ($ million)
Data Table on APAC - Market size and forecast 2025-2030 ($ million)
Chart on APAC - Year-over-year growth 2025-2030 (%)
Data Table on APAC - Year-over-year growth 2025-2030 (%)
Chart on Regional Comparison - APAC
Data Table on Regional Comparison - APAC

12.3.1 China - Market size and forecast 2025-2030

Chart on China - Market size and forecast 2025-2030 ($ million)
Data Table on China - Market size and forecast 2025-2030 ($ million)
Chart on China - Year-over-year growth 2025-2030 (%)
Data Table on China - Year-over-year growth 2025-2030 (%)

12.3.2 India - Market size and forecast 2025-2030

Chart on India - Market size and forecast 2025-2030 ($ million)
Data Table on India - Market size and forecast 2025-2030 ($ million)
Chart on India - Year-over-year growth 2025-2030 (%)
Data Table on India - Year-over-year growth 2025-2030 (%)

12.3.3 Japan - Market size and forecast 2025-2030

Chart on Japan - Market size and forecast 2025-2030 ($ million)
Data Table on Japan - Market size and forecast 2025-2030 ($ million)
Chart on Japan - Year-over-year growth 2025-2030 (%)
Data Table on Japan - Year-over-year growth 2025-2030 (%)

12.3.4 South Korea - Market size and forecast 2025-2030

Chart on South Korea - Market size and forecast 2025-2030 ($ million)
Data Table on South Korea - Market size and forecast 2025-2030 ($ million)
Chart on South Korea - Year-over-year growth 2025-2030 (%)
Data Table on South Korea - Year-over-year growth 2025-2030 (%)

12.3.5 Indonesia - Market size and forecast 2025-2030

Chart on Indonesia - Market size and forecast 2025-2030 ($ million)
Data Table on Indonesia - Market size and forecast 2025-2030 ($ million)
Chart on Indonesia - Year-over-year growth 2025-2030 (%)
Data Table on Indonesia - Year-over-year growth 2025-2030 (%)

12.3.6 Australia - Market size and forecast 2025-2030

Chart on Australia - Market size and forecast 2025-2030 ($ million)
Data Table on Australia - Market size and forecast 2025-2030 ($ million)
Chart on Australia - Year-over-year growth 2025-2030 (%)
Data Table on Australia - Year-over-year growth 2025-2030 (%)

12.4 North America - Market size and forecast 2025-2030

Chart on North America - Market size and forecast 2025-2030 ($ million)
Data Table on North America - Market size and forecast 2025-2030 ($ million)
Chart on North America - Year-over-year growth 2025-2030 (%)
Data Table on North America - Year-over-year growth 2025-2030 (%)
Chart on Regional Comparison - North America
Data Table on Regional Comparison - North America

12.4.1 US - Market size and forecast 2025-2030

Chart on US - Market size and forecast 2025-2030 ($ million)
Data Table on US - Market size and forecast 2025-2030 ($ million)
Chart on US - Year-over-year growth 2025-2030 (%)
Data Table on US - Year-over-year growth 2025-2030 (%)

12.4.2 Canada - Market size and forecast 2025-2030

Chart on Canada - Market size and forecast 2025-2030 ($ million)
Data Table on Canada - Market size and forecast 2025-2030 ($ million)
Chart on Canada - Year-over-year growth 2025-2030 (%)
Data Table on Canada - Year-over-year growth 2025-2030 (%)

12.4.3 Mexico - Market size and forecast 2025-2030

Chart on Mexico - Market size and forecast 2025-2030 ($ million)
Data Table on Mexico - Market size and forecast 2025-2030 ($ million)
Chart on Mexico - Year-over-year growth 2025-2030 (%)
Data Table on Mexico - Year-over-year growth 2025-2030 (%)

12.5 Europe - Market size and forecast 2025-2030

Chart on Europe - Market size and forecast 2025-2030 ($ million)
Data Table on Europe - Market size and forecast 2025-2030 ($ million)
Chart on Europe - Year-over-year growth 2025-2030 (%)
Data Table on Europe - Year-over-year growth 2025-2030 (%)
Chart on Regional Comparison - Europe
Data Table on Regional Comparison - Europe

12.5.1 UK - Market size and forecast 2025-2030

Chart on UK - Market size and forecast 2025-2030 ($ million)
Data Table on UK - Market size and forecast 2025-2030 ($ million)
Chart on UK - Year-over-year growth 2025-2030 (%)
Data Table on UK - Year-over-year growth 2025-2030 (%)

12.5.2 Germany - Market size and forecast 2025-2030

Chart on Germany - Market size and forecast 2025-2030 ($ million)
Data Table on Germany - Market size and forecast 2025-2030 ($ million)
Chart on Germany - Year-over-year growth 2025-2030 (%)
Data Table on Germany - Year-over-year growth 2025-2030 (%)

12.5.3 France - Market size and forecast 2025-2030

Chart on France - Market size and forecast 2025-2030 ($ million)
Data Table on France - Market size and forecast 2025-2030 ($ million)
Chart on France - Year-over-year growth 2025-2030 (%)
Data Table on France - Year-over-year growth 2025-2030 (%)

12.5.4 Spain - Market size and forecast 2025-2030

Chart on Spain - Market size and forecast 2025-2030 ($ million)
Data Table on Spain - Market size and forecast 2025-2030 ($ million)
Chart on Spain - Year-over-year growth 2025-2030 (%)
Data Table on Spain - Year-over-year growth 2025-2030 (%)

12.5.5 Italy - Market size and forecast 2025-2030

Chart on Italy - Market size and forecast 2025-2030 ($ million)
Data Table on Italy - Market size and forecast 2025-2030 ($ million)
Chart on Italy - Year-over-year growth 2025-2030 (%)
Data Table on Italy - Year-over-year growth 2025-2030 (%)

12.5.6 The Netherlands - Market size and forecast 2025-2030

Chart on The Netherlands - Market size and forecast 2025-2030 ($ million)
Data Table on The Netherlands - Market size and forecast 2025-2030 ($ million)
Chart on The Netherlands - Year-over-year growth 2025-2030 (%)
Data Table on The Netherlands - Year-over-year growth 2025-2030 (%)

12.6 South America - Market size and forecast 2025-2030

Chart on South America - Market size and forecast 2025-2030 ($ million)
Data Table on South America - Market size and forecast 2025-2030 ($ million)
Chart on South America - Year-over-year growth 2025-2030 (%)
Data Table on South America - Year-over-year growth 2025-2030 (%)
Chart on Regional Comparison - South America
Data Table on Regional Comparison - South America

12.6.1 Brazil - Market size and forecast 2025-2030

Chart on Brazil - Market size and forecast 2025-2030 ($ million)
Data Table on Brazil - Market size and forecast 2025-2030 ($ million)
Chart on Brazil - Year-over-year growth 2025-2030 (%)
Data Table on Brazil - Year-over-year growth 2025-2030 (%)

12.6.2 Argentina - Market size and forecast 2025-2030

Chart on Argentina - Market size and forecast 2025-2030 ($ million)
Data Table on Argentina - Market size and forecast 2025-2030 ($ million)
Chart on Argentina - Year-over-year growth 2025-2030 (%)
Data Table on Argentina - Year-over-year growth 2025-2030 (%)

12.6.3 Colombia - Market size and forecast 2025-2030

Chart on Colombia - Market size and forecast 2025-2030 ($ million)
Data Table on Colombia - Market size and forecast 2025-2030 ($ million)
Chart on Colombia - Year-over-year growth 2025-2030 (%)
Data Table on Colombia - Year-over-year growth 2025-2030 (%)

12.7 Middle East and Africa - Market size and forecast 2025-2030

Chart on Middle East and Africa - Market size and forecast 2025-2030 ($ million)
Data Table on Middle East and Africa - Market size and forecast 2025-2030 ($ million)
Chart on Middle East and Africa - Year-over-year growth 2025-2030 (%)
Data Table on Middle East and Africa - Year-over-year growth 2025-2030 (%)
Chart on Regional Comparison - Middle East and Africa
Data Table on Regional Comparison - Middle East and Africa

12.7.1 Saudi Arabia - Market size and forecast 2025-2030

Chart on Saudi Arabia - Market size and forecast 2025-2030 ($ million)
Data Table on Saudi Arabia - Market size and forecast 2025-2030 ($ million)
Chart on Saudi Arabia - Year-over-year growth 2025-2030 (%)
Data Table on Saudi Arabia - Year-over-year growth 2025-2030 (%)

12.7.2 UAE - Market size and forecast 2025-2030

Chart on UAE - Market size and forecast 2025-2030 ($ million)
Data Table on UAE - Market size and forecast 2025-2030 ($ million)
Chart on UAE - Year-over-year growth 2025-2030 (%)
Data Table on UAE - Year-over-year growth 2025-2030 (%)

12.7.3 South Africa - Market size and forecast 2025-2030

Chart on South Africa - Market size and forecast 2025-2030 ($ million)
Data Table on South Africa - Market size and forecast 2025-2030 ($ million)
Chart on South Africa - Year-over-year growth 2025-2030 (%)
Data Table on South Africa - Year-over-year growth 2025-2030 (%)

12.7.4 Egypt - Market size and forecast 2025-2030

Chart on Egypt - Market size and forecast 2025-2030 ($ million)
Data Table on Egypt - Market size and forecast 2025-2030 ($ million)
Chart on Egypt - Year-over-year growth 2025-2030 (%)
Data Table on Egypt - Year-over-year growth 2025-2030 (%)

12.7.5 Morocco - Market size and forecast 2025-2030

Chart on Morocco - Market size and forecast 2025-2030 ($ million)
Data Table on Morocco - Market size and forecast 2025-2030 ($ million)
Chart on Morocco - Year-over-year growth 2025-2030 (%)
Data Table on Morocco - Year-over-year growth 2025-2030 (%)

12.8 Market opportunity by geography

Market opportunity by geography ($ million)
Data Tables on Market opportunity by geography ($ million)

13. Drivers, Challenges, and Opportunity

13.1 Market drivers

Autonomous vehicle technology and robotaxi integration
Decarbonization mandates and fueling fleet electrification
Urbanization and integrated mobility platforms

13.2 Market challenges

Regulatory classification and gig labor welfare mandates
Autonomous fleet costs and safety challenges
Rising commercial insurance liabilities and operating cost inflation

13.3 Impact of drivers and challenges

Impact of drivers and challenges in 2025 and 2030

13.4 Market opportunities

In-transit retail media and programmatic digital advertising networks
Enterprise B2B mobility and automated corporate travel solutions
Open protocols and zero-commission driver models

14. Competitive Landscape

14.1 Overview

14.2

Overview on criticality of inputs and factors of differentiation

14.3 Landscape disruption

Overview on factors of disruption

14.4 Industry risks

Impact of key risks on business

15. Competitive Analysis

15.1 Companies profiled

Companies covered

15.2 Company ranking index

15.3 Market positioning of companies

Matrix on companies position and classification

15.4 Autocab

Autocab - Overview
Autocab - Product / Service
Autocab - Key offerings
SWOT

15.5 Blacklane GmbH

Blacklane GmbH - Overview
Blacklane GmbH - Product / Service
Blacklane GmbH - Key offerings
SWOT

15.6 Bolt Technology OU

Bolt Technology OU - Overview
Bolt Technology OU - Product / Service
Bolt Technology OU - Key offerings
SWOT

15.7 Cabify Espana SL

Cabify Espana SL - Overview
Cabify Espana SL - Product / Service
Cabify Espana SL - Key offerings
SWOT

15.8 Comuto SA

Comuto SA - Overview
Comuto SA - Product / Service
Comuto SA - Key offerings
SWOT

15.9 DiDi Global Inc.

DiDi Global Inc. - Overview
DiDi Global Inc. - Business segments
DiDi Global Inc. - Key offerings
DiDi Global Inc. - Segment focus
SWOT

15.10 Grab Holdings Ltd.

Grab Holdings Ltd. - Overview
Grab Holdings Ltd. - Business segments
Grab Holdings Ltd. - Key offerings
Grab Holdings Ltd. - Segment focus
SWOT

15.11 Heetch

Heetch - Overview
Heetch - Product / Service
Heetch - Key offerings
SWOT

15.12 Kakao Corp.

Kakao Corp. - Overview
Kakao Corp. - Product / Service
Kakao Corp. - Key offerings
SWOT

15.13 Lyft Inc.

Lyft Inc. - Overview
Lyft Inc. - Product / Service
Lyft Inc. - Key offerings
SWOT

15.14 Ola Cabs

Ola Cabs - Overview
Ola Cabs - Product / Service
Ola Cabs - Key offerings
SWOT

15.15 PT GoTo Gojek Tokopedia Tbk

PT GoTo Gojek Tokopedia Tbk - Overview
PT GoTo Gojek Tokopedia Tbk - Product / Service
PT GoTo Gojek Tokopedia Tbk - Key offerings
SWOT

15.16 SIXT SE

SIXT SE - Overview
SIXT SE - Business segments
SIXT SE - Key news
SIXT SE - Key offerings
SIXT SE - Segment focus
SWOT

15.17 Uber Technologies Inc.

Uber Technologies Inc. - Overview
Uber Technologies Inc. - Business segments
Uber Technologies Inc. - Key offerings
Uber Technologies Inc. - Segment focus
SWOT

15.18 Wheely Technologies Ltd.

Wheely Technologies Ltd. - Overview
Wheely Technologies Ltd. - Product / Service
Wheely Technologies Ltd. - Key offerings
SWOT

16. Appendix

16.1 Scope of the report

Market definition
Objectives
Notes and caveats

16.2 Inclusions and exclusions checklist

Inclusions checklist
Exclusions checklist

16.3 Currency conversion rates for US$

16.4 Research methodology

16.5 Data procurement

Information sources

16.6 Data validation

16.7 Validation techniques employed for market sizing

16.8 Data synthesis

16.9 360 degree market analysis

16.10 List of abbreviations

Research Methodology

Technavio presents a detailed picture of the market by way of study, synthesis, and summation of data from multiple sources. The analysts have presented the various facets of the market with a particular focus on identifying the key industry influencers. The data thus presented is comprehensive, reliable, and the result of extensive research, both primary and secondary.

INFORMATION SOURCES

Primary sources

  • Manufacturers and suppliers
  • Channel partners
  • Industry experts
  • Strategic decision makers

Secondary sources

  • Industry journals and periodicals
  • Government data
  • Financial reports of key industry players
  • Historical data
  • Press releases

DATA ANALYSIS

Data Synthesis

  • Collation of data
  • Estimation of key figures
  • Analysis of derived insights

Data Validation

  • Triangulation with data models
  • Reference against proprietary databases
  • Corroboration with industry experts

REPORT WRITING

Qualitative

  • Market drivers
  • Market challenges
  • Market trends
  • Five forces analysis

Quantitative

  • Market size and forecast
  • Market segmentation
  • Geographical insights
  • Competitive landscape

Interested in this report?

Get your sample now to see our research methodology and insights!

Download Now

Frequently Asked Questions

Ride Hailing Services market growth will increase by USD 136591.0 million during 2026-2030.

The Ride Hailing Services market is expected to grow at a CAGR of 17.9% during 2026-2030.

Ride Hailing Services market is segmented by Application (Car sharing, E-hailing) Mode of booking (Online, Offline) Vehicle type (Four wheelers, Two wheelers, Three wheelers)

Autocab, Blacklane GmbH, Bolt Technology OU, Cabify Espana SL, Comuto SA, Curb Mobility LLC, DiDi Global Inc., Free Now, Gett Co., Grab Holdings Ltd., Heetch, Kakao Corp., Lyft Inc., Ola Cabs, PT GoTo Gojek Tokopedia Tbk, SIXT SE, Uber Technologies Inc., Wheely Technologies Ltd. are a few of the key vendors in the Ride Hailing Services market.

APAC will register the highest growth rate of 31.8% among the other regions. Therefore, the Ride Hailing Services market in APAC is expected to garner significant business opportunities for the vendors during the forecast period.

China, India, Japan, South Korea, Indonesia, Australia, US, Canada, Mexico, UK, Germany, France, Spain, Italy, The Netherlands, Brazil, Argentina, Colombia, Saudi Arabia, UAE, South Africa, Egypt, Morocco

  • Autonomous vehicle technology and robotaxi integration is the driving factor this market.

The Ride Hailing Services market vendors should focus on grabbing business opportunities from the Application segment as it accounted for the largest market share in the base year.
RIA - Research AI Assistant
Ask RIA
