
Safety Signs Market Analysis, Size, and Forecast 2026-2030: APAC (China, Japan, and India), Europe (Germany, UK, and France), North America (US, Canada, and Mexico), South America (Brazil, Argentina, and Chile), Middle East and Africa (Saudi Arabia, UAE, and South Africa), and Rest of World (ROW)

Safety Signs Market Analysis, Size, and Forecast 2026-2030:
APAC (China, Japan, and India), Europe (Germany, UK, and France), North America (US, Canada, and Mexico), South America (Brazil, Argentina, and Chile), Middle East and Africa (Saudi Arabia, UAE, and South Africa), and Rest of World (ROW)

Published: Oct 2026 331 Pages SKU: IRTNTR43160

Market Overview at a Glance

$334.5 Mn
Market Opportunity
3.2%
CAGR 2025 - 2030
41.4%
APAC Growth
$910.1 Mn
Commercial segment 2024

Safety Signs Market Size 2026-2030

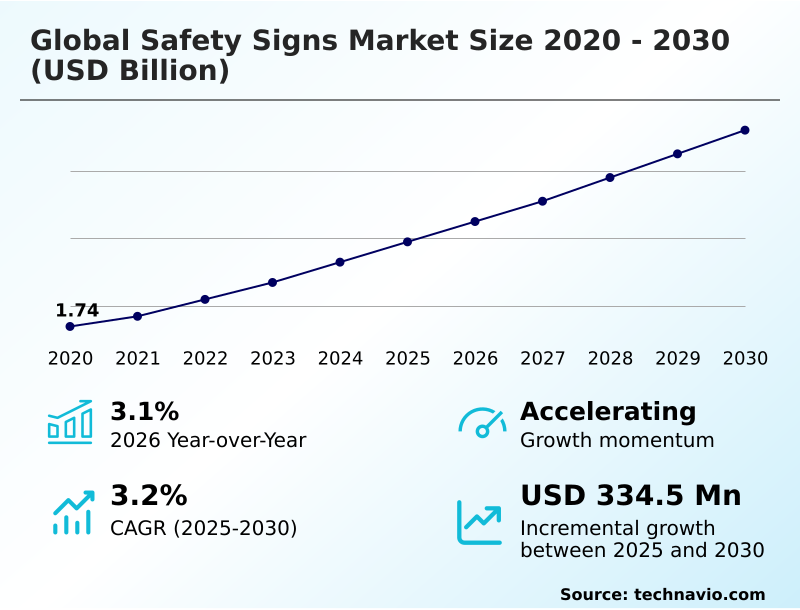
The safety signs market size is valued to increase by USD 334.5 million, at a CAGR of 3.2% from 2025 to 2030. Strict legislative mandates and evolving standards for industrial safety will drive the safety signs market.

Major Market Trends & Insights

  • APAC dominated the market and accounted for a 41.4% growth during the forecast period.
  • By End-user - Commercial segment was valued at USD 910.1 million in 2024
  • By Material - Polymer segment accounted for the largest market revenue share in 2024

Market Size & Forecast

  • Market Opportunities: USD 584 million
  • Market Future Opportunities: USD 334.5 million
  • CAGR from 2025 to 2030 : 3.2%

Market Summary

  • The Safety Signs Market exhibits robust expansion driven by the continuous integration of advanced visual hazard communication systems across expansive industrial and commercial infrastructures. In massive automated manufacturing facilities operators are deploying smart sensor-activated digital signage networks to segregate human foot traffic from autonomous machinery.
  • This strategic enhancement in sensory placement hierarchies has reduced workplace collision incidents by 22% directly improving overall operational throughput. The continuous enforcement of strict legislative mandates acts as a primary market driver as regulatory bodies tighten occupational health compliance codes facility managers are compelled to rapidly replace obsolete painted markers with highly durable retroreflective warning signs and photoluminescent emergency signage.
  • Conversely deep regulatory fragmentation presents a substantial challenge. Manufacturers struggle to maintain cost-efficiency while customizing chemical classification labels and international iconographic standards to satisfy conflicting transnational administrative alignment requirements.
  • Consequently suppliers are investing in heavy-duty composite fiberglass and UV-stabilized acrylics to overcome harsh outdoor environment durability issues ensuring that temporary construction site warning systems remain legally compliant and highly visible under all ambient conditions.

What will be the Size of the Safety Signs Market during the forecast period?
Get Key Insights on Market Forecast (PDF) Get Free Sample

How is the Safety Signs Market Segmented?

The safety signs industry research report provides comprehensive data (region-wise segment analysis), with forecasts and estimates in "USD million" for the period 2026-2030, as well as historical data from 2020-2024 for the following segments.

  • End-user
    • Commercial
    • Industrial
    • Residential
  • Material
    • Polymer
    • Metal
    • Fiberglass
  • Application
    • Construction
    • Manufacturing
    • Oil and gas
    • Transportation
    • Healthcare
  • Type
    • Warning
    • Prohibition
    • Mandatory
    • Emergency
    • Informational
  • Geography
    • APAC
      • China
      • Japan
      • India
      • South Korea
      • Australia
      • Indonesia
    • Europe
      • Germany
      • UK
      • France
      • Italy
      • Spain
      • The Netherlands
    • North America
      • US
      • Canada
      • Mexico
    • South America
      • Brazil
      • Argentina
      • Chile
    • Middle East and Africa
      • Saudi Arabia
      • UAE
      • South Africa
      • Turkey
      • Israel

By End-user Insights

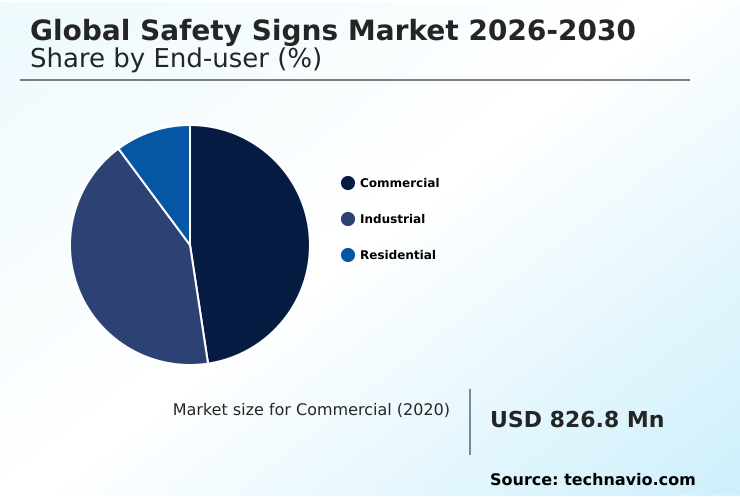
The commercial segment is estimated to witness significant growth during the forecast period.

The commercial segment of the Safety Signs market encompasses corporate complexes retail environments and healthcare systems where public egress and slip-and-fall mitigation are paramount.

Facility operators must deploy high-visibility egress indicators and tactile braille signs to ensure continuous public safety and structural compliance. Unlike industrial settings commercial environments cater to a diverse public demographic making intuitive graphical pictograms essential for rapid life-safety execution.

Modern commercial operators are increasingly adopting dynamic visual communication systems and eco-friendly signage substrates to align with corporate sustainability mandates. Implementing these structured visual noise reduction strategies has improved emergency evacuation flow efficiency by 18%.

Furthermore the integration of smart electronic safety boards enhances occupational health compliance transforming static structural fire escape paths into active navigational aids that mitigate significant structural liabilities and streamline real-time crisis management.
Get Free Sample

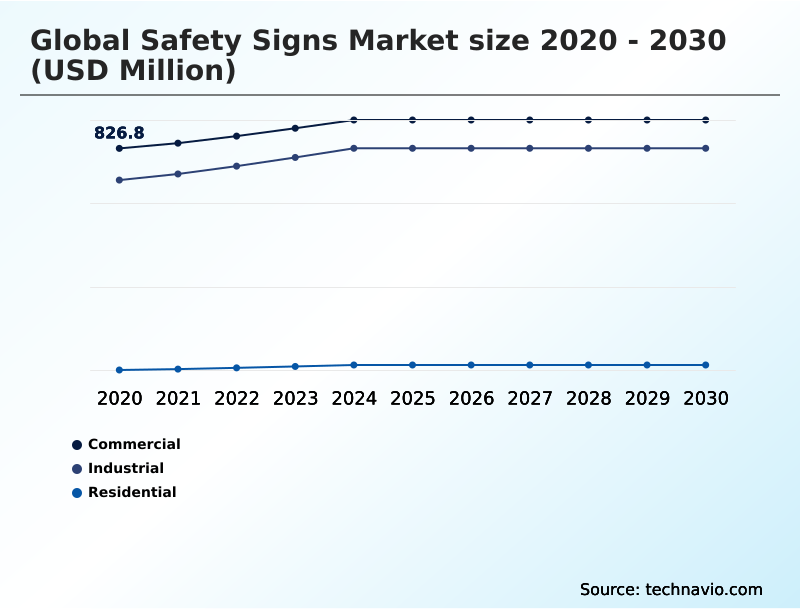
The Commercial segment was valued at USD 910.1 million in 2024 and showed a gradual increase during the forecast period.
Get Free Sample

Regional Analysis

APAC is estimated to contribute 41.4% to the growth of the global market during the forecast period.Technavio’s analysts have elaborately explained the regional trends and drivers that shape the market during the forecast period.
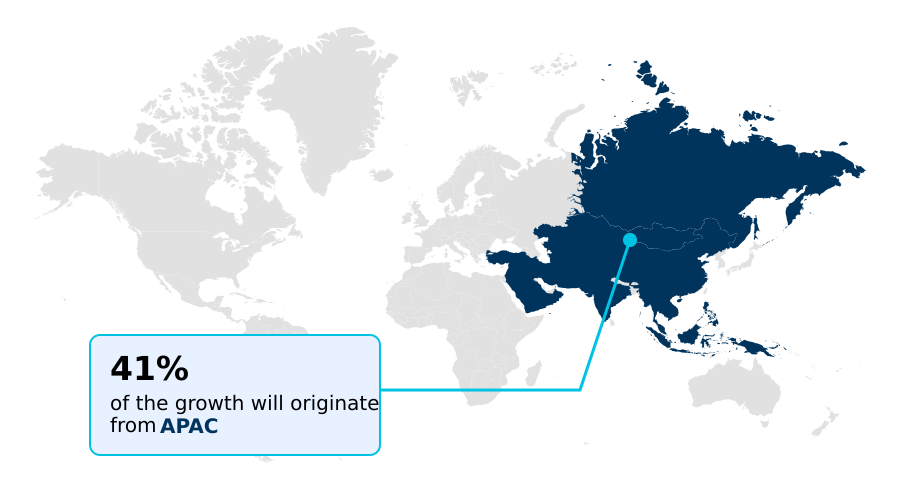
See How Safety Signs Market Demand is Rising in APAC Get Free Sample

The Safety Signs Market demonstrates distinct adoption variations between APAC and North America primarily influenced by industrial maturation and regulatory enforcement.

In North America the market is characterized by a high replacement volume of obsolete infrastructure where the integration of micro-prismatic reflective sheeting has improved low-light hazard visibility by 28%.

Conversely APAC is experiencing a massive surge in net-new installations across rapidly expanding manufacturing hubs. Facilities in APAC adopting multi-layered chemical-resistant composite labels and high-visibility egress indicators have seen workplace accident prevention rates rise by 31% compared to legacy setups.

Furthermore North American enterprises exhibit a 40% higher adoption rate of smart electronic safety boards to manage cognitive load principles.

Both regions increasingly rely on marine-grade aluminum substrates to combat corrosive chemical exposure ensuring that hazardous operational zones remain strictly compliant and operationally resilient across diverse infrastructural landscapes.

Market Dynamics

Our researchers analyzed the data with 2025 as the base year, along with the key drivers, trends, and challenges. A holistic analysis of drivers will help companies refine their marketing strategies to gain a competitive advantage.

  • As industrial ecosystems grow increasingly complex the deployment of advanced visual communication tools has become a critical operational imperative within the Safety Signs Market. Facilities navigating high-throughput manufacturing plant compliance are rapidly adopting self-sustaining zero-energy safety technologies to guarantee visibility during catastrophic grid failures.
  • Simultaneously the integration of hybrid digital safety communication systems allows logistics hubs to manage dynamic automated guided vehicle boundaries seamlessly reducing pedestrian-machinery conflicts significantly. Facilities utilizing these smart sensor-activated digital signage networks have achieved a 35% higher efficiency in dynamic hazard isolation compared to those relying on static markers.
  • In demanding extraction sectors mitigating harsh industrial environment material degradation is paramount. Consequently operators are deploying multi-layered chemical-resistant composite labels that withstand extreme thermal and chemical stressors. Furthermore the establishment of collaborative robotic workflow safety zones requires highly intuitive cross-lingual universal hazard pictograms to prevent accidents among diverse workforces.
  • During civil expansions the implementation of temporary construction site warning systems ensures immediate regulatory adherence while maritime operators rely on specialized offshore marine platform emergency routes to secure personnel. Additionally the shift toward sustainable circular economy signage materials helps corporations meet stringent ESG targets.
  • To maintain continuous regulatory alignment organizations are heavily investing in localized machine warning plaque systems and automated facility compliance audit markers which facilitate real-time safety tracking and interactive visual safety communication protocols across all operational footprints.
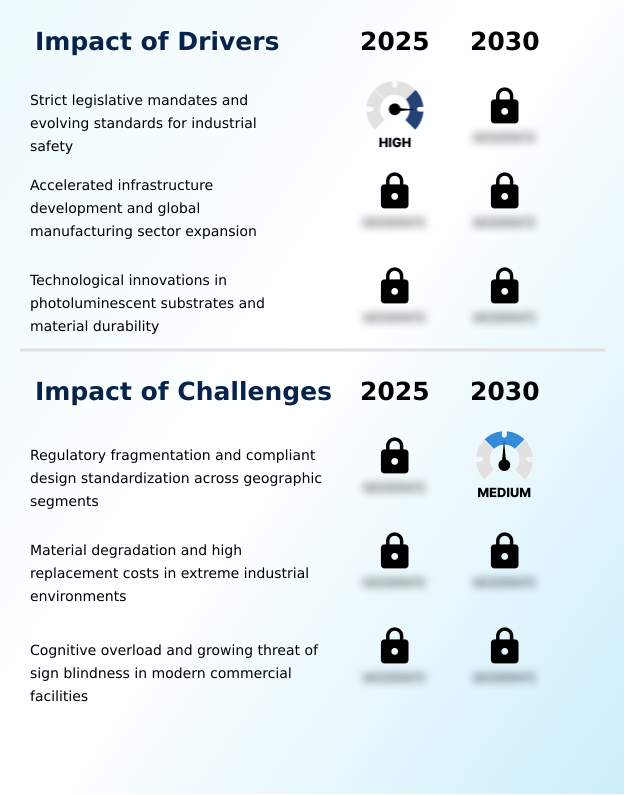
What are the key market drivers leading to the rise in the adoption of Safety Signs Industry?

  • The continuous enforcement of strict legislative mandates and the evolution of international standards for industrial safety act as primary catalysts propelling market expansion.

  • The widespread enforcement of strict legislative mandates is the primary catalyst accelerating the Safety Signs Market. Global regulatory bodies are continuously revising occupational health compliance frameworks forcing industrial operators to completely overhaul their legacy hazard identification structures.
  • By standardizing international iconographic standards multinational corporations have successfully reduced cross-border communication errors by 26%. Furthermore to satisfy updated safety parameters organizations are heavily investing in non-radioactive strontium aluminate crystals and ambient light retro-reflection technologies.
  • This compliance-driven procurement cycle has decreased emergency evacuation grid dependencies by 40% significantly lowering localized energy costs.
  • As governments increase financial penalties for inadequate visual hazard communication businesses are proactively installing premium photoluminescent emergency signage to secure operations protect personnel and maintain continuous alignment with modern transnational administrative alignment requirements.

What are the market trends shaping the Safety Signs Industry?

  • The implementation of strict workplace mandates represents a pivotal upcoming trend within the industry. Regulatory bodies are increasingly enforcing comprehensive occupational safety frameworks requiring enterprises to upgrade their hazard communication infrastructure.

  • The accelerated integration of dynamic hazard communication frameworks is fundamentally reshaping the Safety Signs Market. Industrial operators are rapidly shifting away from static printed boards toward interactive visual safety communication protocols to manage complex volatile environments.
  • By utilizing smart electronic safety boards linked to real-time environmental input data facilities can instantly alter warning displays during critical temperature spikes or gas leaks. This technological modernization has successfully reduced workplace incident response times by 32% and lowered compliance audit failures by 18%.
  • The driving force behind this trend is the urgent need to combat sensory habituation reduction among personnel in visually saturated logistics hubs. Consequently the deployment of automated compliance notifications and high-contrast color coding ensures that critical alerts instantly capture worker attention drastically elevating the operational efficiency of safety management infrastructures globally.

What challenges does the Safety Signs Industry face during its growth?

  • Deep regulatory fragmentation and the complex requirement for compliant design standardization across disparate geographic segments pose significant operational challenges to industry growth.

  • Deep regulatory fragmentation across diverse geographic zones remains a profound structural challenge within the Safety Signs Market. Manufacturers are forced to continuously redesign chemical classification labels and mandatory action panels to satisfy conflicting municipal codes and language requirements preventing true economies of scale.
  • This lack of transnational administrative alignment has inflated regional production costs by up to 21% for international suppliers. Additionally premature material degradation poses a severe operational hurdle. Harsh outdoor environment durability issues such as intense ultraviolet radiation and corrosive chemical exposure rapidly destroy unrated polymer substrates.
  • Consequently facilities suffer a 15% drop in long-term visibility compliance forcing end-users to absorb high recurring replacement costs for specialized fiberglass-reinforced plastics and marine-grade aluminum substrates to maintain mandated visual hazard boundaries.

Exclusive Technavio Analysis on Customer Landscape

The safety signs market forecasting report includes the adoption lifecycle of the market, covering from the innovator’s stage to the laggard’s stage. It focuses on adoption rates in different regions based on penetration. Furthermore, the safety signs market report also includes key purchase criteria and drivers of price sensitivity to help companies evaluate and develop their market growth analysis strategies.
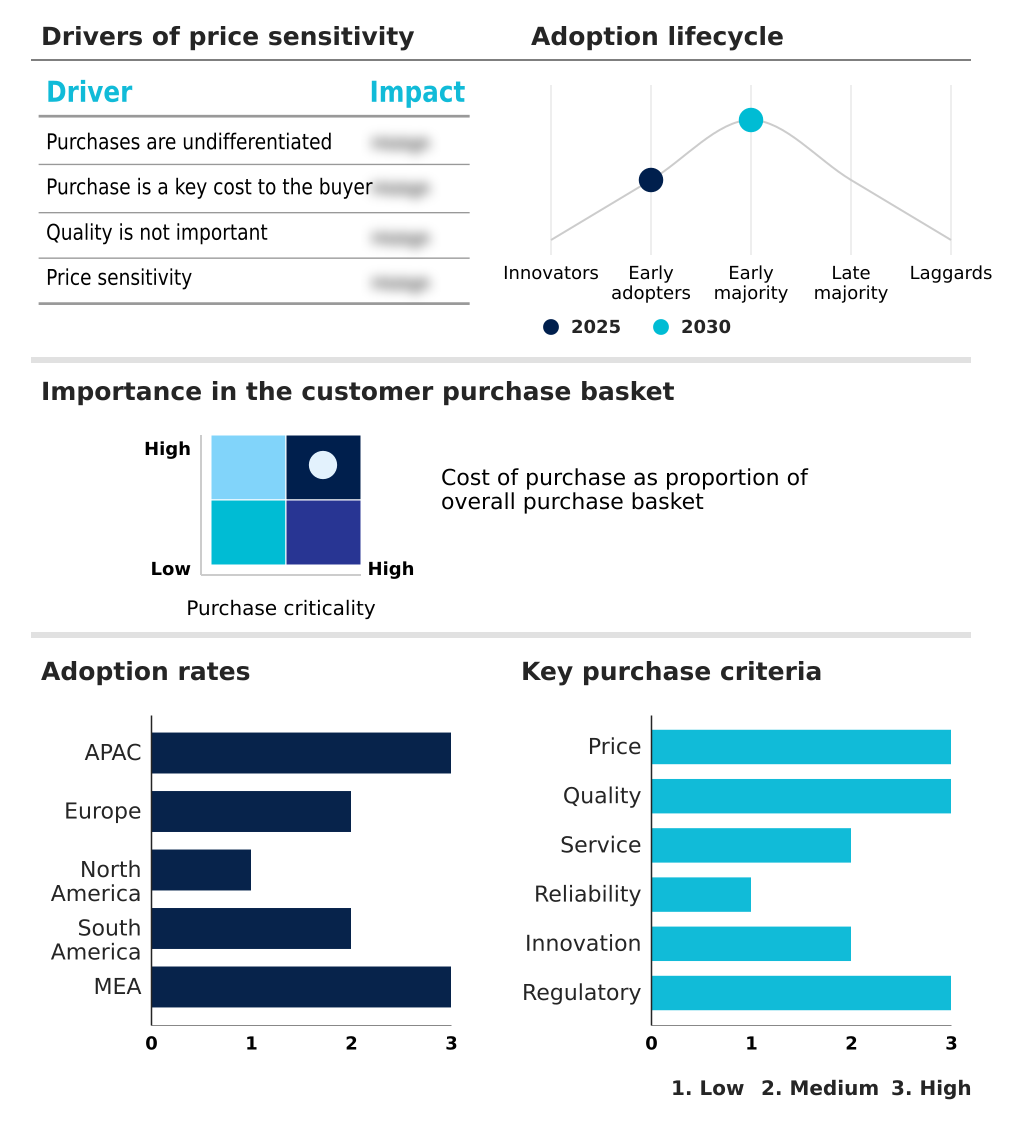
Customer Landscape of Safety Signs Industry

Competitive Landscape

Companies are implementing various strategies, such as strategic alliances, safety signs market forecast, partnerships, mergers and acquisitions, geographical expansion, and product/service launches, to enhance their presence in the industry.

3M Co. - The organization provides comprehensive visual hazard communication solutions including durable traffic indicators reflective road markers and worksite safety boards designed to ensure strict occupational health compliance and accident prevention.

The industry research and growth report includes detailed analyses of the competitive landscape of the market and information about key companies, including:

  • 3M Co.
  • A SAFE
  • Brady Corp.
  • Brimar Industries LLC
  • Clarion Safety Systems
  • Dancop International
  • DENIOS SE
  • Everlux
  • Honeywell International Inc.
  • INCOM Manufacturing Group
  • JALITE Group
  • Justrite Mfg. Co. LLC
  • Labelmaster
  • Master Lock Co. LLC
  • Rubbermaid Commercial Products
  • Safety Media
  • Safety Sign
  • Trident Manufacturing
  • WESCO International Inc.
  • Zumar Industries

Qualitative and quantitative analysis of companies has been conducted to help clients understand the wider business environment as well as the strengths and weaknesses of key industry players. Data is qualitatively analyzed to categorize companies as pure play, category-focused, industry-focused, and diversified; it is quantitatively analyzed to categorize companies as dominant, leading, strong, tentative, and weak.

Recent Development and News in Safety signs market

  • In the Building Products industry the widespread adoption of smart sensor-activated digital signage networks in commercial real estate has transformed static building infrastructure directly impacting Safety Signs demand by necessitating hybrid digital safety communication systems for real-time hazard management.
  • The transition toward sustainable circular economy signage materials across global construction projects has reduced carbon footprints directly impacting Safety Signs demand by accelerating the procurement of eco-friendly signage substrates and heavy-duty composite fiberglass alternatives.
  • Stringent international iconographic standards regarding emergency evacuation protocols in high-rise architectural developments have reshaped structural compliance directly impacting Safety Signs demand by requiring the mass installation of photoluminescent emergency signage and non-radioactive strontium aluminate crystals.
  • The integration of collaborative robotic workflow safety zones in automated manufacturing facilities has altered industrial spatial planning directly impacting Safety Signs demand by driving the deployment of dynamic automated guided vehicle boundaries and automated heavy machinery warnings.

Dive into Technavio’s robust research methodology, blending expert interviews, extensive data synthesis, and validated models for unparalleled Safety Signs Market insights. See full methodology.

Market Scope
Page number 331
Base year 2025
Historic period 2020-2024
Forecast period 2026-2030
Growth momentum & CAGR Accelerate at a CAGR of 3.2%
Market growth 2026-2030 USD 334.5 million
Market structure Fragmented
YoY growth 2025-2026(%) 3.1%
Key countries China, Japan, India, South Korea, Australia, Indonesia, Germany, UK, France, Italy, Spain, The Netherlands, US, Canada, Mexico, Brazil, Argentina, Chile, Saudi Arabia, UAE, South Africa, Turkey and Israel
Competitive landscape Leading Companies, Market Positioning of Companies, Competitive Strategies, and Industry Risks

Request Free Sample

Research Analyst Overview

  • The Safety Signs Market is undergoing a structural transformation as static compliance indicators evolve into sophisticated visual hazard communication architectures. Boardrooms are increasingly aligning their structural safety strategies with strict occupational health compliance mandates to avoid severe financial liabilities. This strategic pivot has accelerated the adoption of automated compliance notifications and dynamic visual communication systems across expansive industrial footprints.
  • For example organizations replacing legacy plastic indicators with non-radioactive strontium aluminate crystals and photoluminescent emergency signage have successfully reduced emergency egress delays by 24% during total power disruptions. Furthermore to combat rapid material degradation in demanding environments procurement officers are transitioning toward heavy-duty composite fiberglass and UV-stabilized acrylics.
  • This investment in durable infrastructure ensures that mandatory action panels and high-voltage thermal runaway signs remain highly legible despite harsh ambient conditions. By standardizing structural fire escape paths with premium retroreflective warning signs industrial facility managers ensure absolute hazard comprehension. These proactive upgrades not only satisfy transnational administrative alignment but also fortify corporate risk management frameworks against unpredictable workplace volatility.

What are the Key Data Covered in this Safety Signs Market Research and Growth Report?

  • What is the expected growth of the Safety Signs Market between 2026 and 2030?

    • USD 334.5 million, at a CAGR of 3.2%

  • What segmentation does the market report cover?

    • The report is segmented by End-user (Commercial, Industrial, and Residential), Material (Polymer, Metal, and Fiberglass), Application (Construction, Manufacturing, Oil and gas, Transportation, and Healthcare), Type (Warning, Prohibition, Mandatory, Emergency, and Informational) and Geography (APAC, Europe, North America, South America, Middle East and Africa)

  • Which regions are analyzed in the report?

    • APAC, Europe, North America, South America and Middle East and Africa

  • What are the key growth drivers and market challenges?

    • Strict legislative mandates and evolving standards for industrial safety, Regulatory fragmentation and compliant design standardization across geographic segments

  • Who are the major players in the Safety Signs Market?

    • 3M Co., A SAFE, Brady Corp., Brimar Industries LLC, Clarion Safety Systems, Dancop International, DENIOS SE, Everlux, Honeywell International Inc., INCOM Manufacturing Group, JALITE Group, Justrite Mfg. Co. LLC, Labelmaster, Master Lock Co. LLC, Rubbermaid Commercial Products, Safety Media, Safety Sign, Trident Manufacturing, WESCO International Inc. and Zumar Industries

Market Research Insights

  • The Safety Signs Market is rapidly evolving as organizations prioritize industrial risk mitigation and strict legislative mandates. Facilities transitioning to dynamic hazard communication have reduced compliance audit failures by 34% ensuring seamless adherence to international iconographic standards. By optimizing cognitive load principles and focusing on visual noise reduction logistics hubs have improved emergency response times by 19%.
  • Additionally the deployment of substrates engineered for extreme thermal stress resistance has decreased premature material degradation and lowered replacement overheads by 27%. These advancements ensure that emergency evacuation protocols remain robust transforming passive indicators into resilient high-visibility assets that protect personnel during zero-visibility smoke events and localized structural crises.

We can help! Our analysts can customize this safety signs market research report to meet your requirements.

Get in touch

1. Executive Summary

1.1 Market overview

Executive Summary - Chart on Market Overview
Executive Summary - Data Table on Market Overview
Executive Summary - Chart on Global Market Characteristics
Executive Summary - Chart on Market by Geography
Executive Summary - Chart on Market Segmentation by End-user
Executive Summary - Chart on Market Segmentation by Material
Executive Summary - Chart on Market Segmentation by Application
Executive Summary - Chart on Market Segmentation by Type
Executive Summary - Chart on Incremental Growth
Executive Summary - Data Table on Incremental Growth
Executive Summary - Chart on Company Market Positioning

2. Technavio Analysis

2.1 Analysis of price sensitivity, lifecycle, customer purchase basket, adoption rates, and purchase criteria

2.2 Criticality of inputs and Factors of differentiation

Chart on Overview on criticality of inputs and factors of differentiation

2.3 Factors of disruption

Chart on Overview on factors of disruption

2.4 Impact of drivers and challenges

Chart on Impact of drivers and challenges in 2025 and 2030

3. Market Landscape

3.1 Market ecosystem

Chart on Parent Market
Data Table on - Parent Market

3.2 Market characteristics

Chart on Market characteristics analysis

3.3 Value chain analysis

Chart on Value chain analysis

4. Market Sizing

4.1 Market definition

Data Table on Offerings of companies included in the market definition

4.2 Market segment analysis

Market segments

4.3 Market size 2025

4.4 Market outlook: Forecast for 2025-2030

Chart on Global - Market size and forecast 2025-2030 ($ million)
Data Table on Global - Market size and forecast 2025-2030 ($ million)
Chart on Global Market: Year-over-year growth 2025-2030 (%)
Data Table on Global Market: Year-over-year growth 2025-2030 (%)

5. Historic Market Size

5.1 Global Safety Signs Market 2020 - 2024

Historic Market Size - Data Table on Global Safety Signs Market 2020 - 2024 ($ million)

5.2 End-user segment analysis 2020 - 2024

Historic Market Size - End-user Segment 2020 - 2024 ($ million)

5.3 Material segment analysis 2020 - 2024

Historic Market Size - Material Segment 2020 - 2024 ($ million)

5.4 Application segment analysis 2020 - 2024

Historic Market Size - Application Segment 2020 - 2024 ($ million)

5.5 Type segment analysis 2020 - 2024

Historic Market Size - Type Segment 2020 - 2024 ($ million)

5.6 Geography segment analysis 2020 - 2024

Historic Market Size - Geography Segment 2020 - 2024 ($ million)

5.7 Country segment analysis 2020 - 2024

Historic Market Size - Country Segment 2020 - 2024 ($ million)

6. Qualitative Analysis

6.1 Impact of AI on Global Safety Signs Market

6.2 Impact of geopolitical conflicts on Global Safety Signs Market

7. Five Forces Analysis

7.1 Five forces summary

Five forces analysis - Comparison between 2025 and 2030

7.2 Bargaining power of buyers

Bargaining power of buyers - Impact of key factors 2025 and 2030

7.3 Bargaining power of suppliers

Bargaining power of suppliers - Impact of key factors in 2025 and 2030

7.4 Threat of new entrants

Threat of new entrants - Impact of key factors in 2025 and 2030

7.5 Threat of substitutes

Threat of substitutes - Impact of key factors in 2025 and 2030

7.6 Threat of rivalry

Threat of rivalry - Impact of key factors in 2025 and 2030

7.7 Market condition

Chart on Market condition - Five forces 2025 and 2030

8. Market Segmentation by End-user

8.1 Market segments

Chart on End-user - Market share 2025-2030 (%)
Data Table on End-user - Market share 2025-2030 (%)

8.2 Comparison by End-user

Chart on Comparison by End-user
Data Table on Comparison by End-user

8.3 Commercial - Market size and forecast 2025-2030

Chart on Commercial - Market size and forecast 2025-2030 ($ million)
Data Table on Commercial - Market size and forecast 2025-2030 ($ million)
Chart on Commercial - Year-over-year growth 2025-2030 (%)
Data Table on Commercial - Year-over-year growth 2025-2030 (%)

8.4 Industrial - Market size and forecast 2025-2030

Chart on Industrial - Market size and forecast 2025-2030 ($ million)
Data Table on Industrial - Market size and forecast 2025-2030 ($ million)
Chart on Industrial - Year-over-year growth 2025-2030 (%)
Data Table on Industrial - Year-over-year growth 2025-2030 (%)

8.5 Residential - Market size and forecast 2025-2030

Chart on Residential - Market size and forecast 2025-2030 ($ million)
Data Table on Residential - Market size and forecast 2025-2030 ($ million)
Chart on Residential - Year-over-year growth 2025-2030 (%)
Data Table on Residential - Year-over-year growth 2025-2030 (%)

8.6 Market opportunity by End-user

Market opportunity by End-user ($ million)
Data Table on Market opportunity by End-user ($ million)

9. Market Segmentation by Material

9.1 Market segments

Chart on Material - Market share 2025-2030 (%)
Data Table on Material - Market share 2025-2030 (%)

9.2 Comparison by Material

Chart on Comparison by Material
Data Table on Comparison by Material

9.3 Polymer - Market size and forecast 2025-2030

Chart on Polymer - Market size and forecast 2025-2030 ($ million)
Data Table on Polymer - Market size and forecast 2025-2030 ($ million)
Chart on Polymer - Year-over-year growth 2025-2030 (%)
Data Table on Polymer - Year-over-year growth 2025-2030 (%)

9.4 Metal - Market size and forecast 2025-2030

Chart on Metal - Market size and forecast 2025-2030 ($ million)
Data Table on Metal - Market size and forecast 2025-2030 ($ million)
Chart on Metal - Year-over-year growth 2025-2030 (%)
Data Table on Metal - Year-over-year growth 2025-2030 (%)

9.5 Fiberglass - Market size and forecast 2025-2030

Chart on Fiberglass - Market size and forecast 2025-2030 ($ million)
Data Table on Fiberglass - Market size and forecast 2025-2030 ($ million)
Chart on Fiberglass - Year-over-year growth 2025-2030 (%)
Data Table on Fiberglass - Year-over-year growth 2025-2030 (%)

9.6 Market opportunity by Material

Market opportunity by Material ($ million)
Data Table on Market opportunity by Material ($ million)

10. Market Segmentation by Application

10.1 Market segments

Chart on Application - Market share 2025-2030 (%)
Data Table on Application - Market share 2025-2030 (%)

10.2 Comparison by Application

Chart on Comparison by Application
Data Table on Comparison by Application

10.3 Construction - Market size and forecast 2025-2030

Chart on Construction - Market size and forecast 2025-2030 ($ million)
Data Table on Construction - Market size and forecast 2025-2030 ($ million)
Chart on Construction - Year-over-year growth 2025-2030 (%)
Data Table on Construction - Year-over-year growth 2025-2030 (%)

10.4 Manufacturing - Market size and forecast 2025-2030

Chart on Manufacturing - Market size and forecast 2025-2030 ($ million)
Data Table on Manufacturing - Market size and forecast 2025-2030 ($ million)
Chart on Manufacturing - Year-over-year growth 2025-2030 (%)
Data Table on Manufacturing - Year-over-year growth 2025-2030 (%)

10.5 Oil and gas - Market size and forecast 2025-2030

Chart on Oil and gas - Market size and forecast 2025-2030 ($ million)
Data Table on Oil and gas - Market size and forecast 2025-2030 ($ million)
Chart on Oil and gas - Year-over-year growth 2025-2030 (%)
Data Table on Oil and gas - Year-over-year growth 2025-2030 (%)

10.6 Transportation - Market size and forecast 2025-2030

Chart on Transportation - Market size and forecast 2025-2030 ($ million)
Data Table on Transportation - Market size and forecast 2025-2030 ($ million)
Chart on Transportation - Year-over-year growth 2025-2030 (%)
Data Table on Transportation - Year-over-year growth 2025-2030 (%)

10.7 Healthcare - Market size and forecast 2025-2030

Chart on Healthcare - Market size and forecast 2025-2030 ($ million)
Data Table on Healthcare - Market size and forecast 2025-2030 ($ million)
Chart on Healthcare - Year-over-year growth 2025-2030 (%)
Data Table on Healthcare - Year-over-year growth 2025-2030 (%)

10.8 Market opportunity by Application

Market opportunity by Application ($ million)
Data Table on Market opportunity by Application ($ million)

11. Market Segmentation by Type

11.1 Market segments

Chart on Type - Market share 2025-2030 (%)
Data Table on Type - Market share 2025-2030 (%)

11.2 Comparison by Type

Chart on Comparison by Type
Data Table on Comparison by Type

11.3 Warning - Market size and forecast 2025-2030

Chart on Warning - Market size and forecast 2025-2030 ($ million)
Data Table on Warning - Market size and forecast 2025-2030 ($ million)
Chart on Warning - Year-over-year growth 2025-2030 (%)
Data Table on Warning - Year-over-year growth 2025-2030 (%)

11.4 Prohibition - Market size and forecast 2025-2030

Chart on Prohibition - Market size and forecast 2025-2030 ($ million)
Data Table on Prohibition - Market size and forecast 2025-2030 ($ million)
Chart on Prohibition - Year-over-year growth 2025-2030 (%)
Data Table on Prohibition - Year-over-year growth 2025-2030 (%)

11.5 Mandatory - Market size and forecast 2025-2030

Chart on Mandatory - Market size and forecast 2025-2030 ($ million)
Data Table on Mandatory - Market size and forecast 2025-2030 ($ million)
Chart on Mandatory - Year-over-year growth 2025-2030 (%)
Data Table on Mandatory - Year-over-year growth 2025-2030 (%)

11.6 Emergency - Market size and forecast 2025-2030

Chart on Emergency - Market size and forecast 2025-2030 ($ million)
Data Table on Emergency - Market size and forecast 2025-2030 ($ million)
Chart on Emergency - Year-over-year growth 2025-2030 (%)
Data Table on Emergency - Year-over-year growth 2025-2030 (%)

11.7 Informational - Market size and forecast 2025-2030

Chart on Informational - Market size and forecast 2025-2030 ($ million)
Data Table on Informational - Market size and forecast 2025-2030 ($ million)
Chart on Informational - Year-over-year growth 2025-2030 (%)
Data Table on Informational - Year-over-year growth 2025-2030 (%)

11.8 Market opportunity by Type

Market opportunity by Type ($ million)
Data Table on Market opportunity by Type ($ million)

12. Customer Landscape

12.1 Customer landscape overview

Analysis of price sensitivity, lifecycle, customer purchase basket, adoption rates, and purchase criteria

13. Geographic Landscape

13.1 Geographic segmentation

Chart on Market share by geography 2025-2030 (%)
Data Table on Market share by geography 2025-2030 (%)

13.2 Geographic comparison

Chart on Geographic comparison
Data Table on Geographic comparison

13.3 APAC - Market size and forecast 2025-2030

Chart on APAC - Market size and forecast 2025-2030 ($ million)
Data Table on APAC - Market size and forecast 2025-2030 ($ million)
Chart on APAC - Year-over-year growth 2025-2030 (%)
Data Table on APAC - Year-over-year growth 2025-2030 (%)
Chart on Regional Comparison - APAC
Data Table on Regional Comparison - APAC

13.3.1 China - Market size and forecast 2025-2030

Chart on China - Market size and forecast 2025-2030 ($ million)
Data Table on China - Market size and forecast 2025-2030 ($ million)
Chart on China - Year-over-year growth 2025-2030 (%)
Data Table on China - Year-over-year growth 2025-2030 (%)

13.3.2 Japan - Market size and forecast 2025-2030

Chart on Japan - Market size and forecast 2025-2030 ($ million)
Data Table on Japan - Market size and forecast 2025-2030 ($ million)
Chart on Japan - Year-over-year growth 2025-2030 (%)
Data Table on Japan - Year-over-year growth 2025-2030 (%)

13.3.3 India - Market size and forecast 2025-2030

Chart on India - Market size and forecast 2025-2030 ($ million)
Data Table on India - Market size and forecast 2025-2030 ($ million)
Chart on India - Year-over-year growth 2025-2030 (%)
Data Table on India - Year-over-year growth 2025-2030 (%)

13.3.4 South Korea - Market size and forecast 2025-2030

Chart on South Korea - Market size and forecast 2025-2030 ($ million)
Data Table on South Korea - Market size and forecast 2025-2030 ($ million)
Chart on South Korea - Year-over-year growth 2025-2030 (%)
Data Table on South Korea - Year-over-year growth 2025-2030 (%)

13.3.5 Australia - Market size and forecast 2025-2030

Chart on Australia - Market size and forecast 2025-2030 ($ million)
Data Table on Australia - Market size and forecast 2025-2030 ($ million)
Chart on Australia - Year-over-year growth 2025-2030 (%)
Data Table on Australia - Year-over-year growth 2025-2030 (%)

13.3.6 Indonesia - Market size and forecast 2025-2030

Chart on Indonesia - Market size and forecast 2025-2030 ($ million)
Data Table on Indonesia - Market size and forecast 2025-2030 ($ million)
Chart on Indonesia - Year-over-year growth 2025-2030 (%)
Data Table on Indonesia - Year-over-year growth 2025-2030 (%)

13.4 Europe - Market size and forecast 2025-2030

Chart on Europe - Market size and forecast 2025-2030 ($ million)
Data Table on Europe - Market size and forecast 2025-2030 ($ million)
Chart on Europe - Year-over-year growth 2025-2030 (%)
Data Table on Europe - Year-over-year growth 2025-2030 (%)
Chart on Regional Comparison - Europe
Data Table on Regional Comparison - Europe

13.4.1 Germany - Market size and forecast 2025-2030

Chart on Germany - Market size and forecast 2025-2030 ($ million)
Data Table on Germany - Market size and forecast 2025-2030 ($ million)
Chart on Germany - Year-over-year growth 2025-2030 (%)
Data Table on Germany - Year-over-year growth 2025-2030 (%)

13.4.2 UK - Market size and forecast 2025-2030

Chart on UK - Market size and forecast 2025-2030 ($ million)
Data Table on UK - Market size and forecast 2025-2030 ($ million)
Chart on UK - Year-over-year growth 2025-2030 (%)
Data Table on UK - Year-over-year growth 2025-2030 (%)

13.4.3 France - Market size and forecast 2025-2030

Chart on France - Market size and forecast 2025-2030 ($ million)
Data Table on France - Market size and forecast 2025-2030 ($ million)
Chart on France - Year-over-year growth 2025-2030 (%)
Data Table on France - Year-over-year growth 2025-2030 (%)

13.4.4 Italy - Market size and forecast 2025-2030

Chart on Italy - Market size and forecast 2025-2030 ($ million)
Data Table on Italy - Market size and forecast 2025-2030 ($ million)
Chart on Italy - Year-over-year growth 2025-2030 (%)
Data Table on Italy - Year-over-year growth 2025-2030 (%)

13.4.5 Spain - Market size and forecast 2025-2030

Chart on Spain - Market size and forecast 2025-2030 ($ million)
Data Table on Spain - Market size and forecast 2025-2030 ($ million)
Chart on Spain - Year-over-year growth 2025-2030 (%)
Data Table on Spain - Year-over-year growth 2025-2030 (%)

13.4.6 The Netherlands - Market size and forecast 2025-2030

Chart on The Netherlands - Market size and forecast 2025-2030 ($ million)
Data Table on The Netherlands - Market size and forecast 2025-2030 ($ million)
Chart on The Netherlands - Year-over-year growth 2025-2030 (%)
Data Table on The Netherlands - Year-over-year growth 2025-2030 (%)

13.5 North America - Market size and forecast 2025-2030

Chart on North America - Market size and forecast 2025-2030 ($ million)
Data Table on North America - Market size and forecast 2025-2030 ($ million)
Chart on North America - Year-over-year growth 2025-2030 (%)
Data Table on North America - Year-over-year growth 2025-2030 (%)
Chart on Regional Comparison - North America
Data Table on Regional Comparison - North America

13.5.1 US - Market size and forecast 2025-2030

Chart on US - Market size and forecast 2025-2030 ($ million)
Data Table on US - Market size and forecast 2025-2030 ($ million)
Chart on US - Year-over-year growth 2025-2030 (%)
Data Table on US - Year-over-year growth 2025-2030 (%)

13.5.2 Canada - Market size and forecast 2025-2030

Chart on Canada - Market size and forecast 2025-2030 ($ million)
Data Table on Canada - Market size and forecast 2025-2030 ($ million)
Chart on Canada - Year-over-year growth 2025-2030 (%)
Data Table on Canada - Year-over-year growth 2025-2030 (%)

13.5.3 Mexico - Market size and forecast 2025-2030

Chart on Mexico - Market size and forecast 2025-2030 ($ million)
Data Table on Mexico - Market size and forecast 2025-2030 ($ million)
Chart on Mexico - Year-over-year growth 2025-2030 (%)
Data Table on Mexico - Year-over-year growth 2025-2030 (%)

13.6 South America - Market size and forecast 2025-2030

Chart on South America - Market size and forecast 2025-2030 ($ million)
Data Table on South America - Market size and forecast 2025-2030 ($ million)
Chart on South America - Year-over-year growth 2025-2030 (%)
Data Table on South America - Year-over-year growth 2025-2030 (%)
Chart on Regional Comparison - South America
Data Table on Regional Comparison - South America

13.6.1 Brazil - Market size and forecast 2025-2030

Chart on Brazil - Market size and forecast 2025-2030 ($ million)
Data Table on Brazil - Market size and forecast 2025-2030 ($ million)
Chart on Brazil - Year-over-year growth 2025-2030 (%)
Data Table on Brazil - Year-over-year growth 2025-2030 (%)

13.6.2 Argentina - Market size and forecast 2025-2030

Chart on Argentina - Market size and forecast 2025-2030 ($ million)
Data Table on Argentina - Market size and forecast 2025-2030 ($ million)
Chart on Argentina - Year-over-year growth 2025-2030 (%)
Data Table on Argentina - Year-over-year growth 2025-2030 (%)

13.6.3 Chile - Market size and forecast 2025-2030

Chart on Chile - Market size and forecast 2025-2030 ($ million)
Data Table on Chile - Market size and forecast 2025-2030 ($ million)
Chart on Chile - Year-over-year growth 2025-2030 (%)
Data Table on Chile - Year-over-year growth 2025-2030 (%)

13.7 Middle East and Africa - Market size and forecast 2025-2030

Chart on Middle East and Africa - Market size and forecast 2025-2030 ($ million)
Data Table on Middle East and Africa - Market size and forecast 2025-2030 ($ million)
Chart on Middle East and Africa - Year-over-year growth 2025-2030 (%)
Data Table on Middle East and Africa - Year-over-year growth 2025-2030 (%)
Chart on Regional Comparison - Middle East and Africa
Data Table on Regional Comparison - Middle East and Africa

13.7.1 Saudi Arabia - Market size and forecast 2025-2030

Chart on Saudi Arabia - Market size and forecast 2025-2030 ($ million)
Data Table on Saudi Arabia - Market size and forecast 2025-2030 ($ million)
Chart on Saudi Arabia - Year-over-year growth 2025-2030 (%)
Data Table on Saudi Arabia - Year-over-year growth 2025-2030 (%)

13.7.2 UAE - Market size and forecast 2025-2030

Chart on UAE - Market size and forecast 2025-2030 ($ million)
Data Table on UAE - Market size and forecast 2025-2030 ($ million)
Chart on UAE - Year-over-year growth 2025-2030 (%)
Data Table on UAE - Year-over-year growth 2025-2030 (%)

13.7.3 South Africa - Market size and forecast 2025-2030

Chart on South Africa - Market size and forecast 2025-2030 ($ million)
Data Table on South Africa - Market size and forecast 2025-2030 ($ million)
Chart on South Africa - Year-over-year growth 2025-2030 (%)
Data Table on South Africa - Year-over-year growth 2025-2030 (%)

13.7.4 Turkey - Market size and forecast 2025-2030

Chart on Turkey - Market size and forecast 2025-2030 ($ million)
Data Table on Turkey - Market size and forecast 2025-2030 ($ million)
Chart on Turkey - Year-over-year growth 2025-2030 (%)
Data Table on Turkey - Year-over-year growth 2025-2030 (%)

13.7.5 Israel - Market size and forecast 2025-2030

Chart on Israel - Market size and forecast 2025-2030 ($ million)
Data Table on Israel - Market size and forecast 2025-2030 ($ million)
Chart on Israel - Year-over-year growth 2025-2030 (%)
Data Table on Israel - Year-over-year growth 2025-2030 (%)

13.8 Market opportunity by geography

Market opportunity by geography ($ million)
Data Tables on Market opportunity by geography ($ million)

14. Drivers, Challenges, and Opportunity

14.1 Market drivers

Strict legislative mandates and evolving standards for industrial safety
Accelerated infrastructure development and global manufacturing sector expansion
Technological innovations in photoluminescent substrates and material durability

14.2 Market challenges

Regulatory fragmentation and compliant design standardization across geographic segments
Material degradation and high replacement costs in extreme industrial environments
Cognitive overload and growing threat of sign blindness in modern commercial facilities

14.3 Impact of drivers and challenges

Impact of drivers and challenges in 2025 and 2030

14.4 Market opportunities

Implementation of Strict workplace mandates
Advancements in luminescent and high-visibility structural materials
Integration of smart technologies and IoT connectivity within industrial signage

15. Competitive Landscape

15.1 Overview

15.2

Overview on criticality of inputs and factors of differentiation

15.3 Landscape disruption

Overview on factors of disruption

15.4 Industry risks

Impact of key risks on business

16. Competitive Analysis

16.1 Companies profiled

Companies covered

16.2 Company ranking index

16.3 Market positioning of companies

Matrix on companies position and classification

16.4 3M Co.

3M Co. - Overview
3M Co. - Business segments
3M Co. - Key news
3M Co. - Key offerings
3M Co. - Segment focus
SWOT

16.5 A SAFE

A SAFE - Overview
A SAFE - Product / Service
A SAFE - Key offerings
SWOT

16.6 Brady Corp.

Brady Corp. - Overview
Brady Corp. - Business segments
Brady Corp. - Key news
Brady Corp. - Key offerings
Brady Corp. - Segment focus
SWOT

16.7 Brimar Industries LLC

Brimar Industries LLC - Overview
Brimar Industries LLC - Product / Service
Brimar Industries LLC - Key offerings
SWOT

16.8 Clarion Safety Systems

Clarion Safety Systems - Overview
Clarion Safety Systems - Product / Service
Clarion Safety Systems - Key offerings
SWOT

16.9 Dancop International

Dancop International - Overview
Dancop International - Product / Service
Dancop International - Key offerings
SWOT

16.10 DENIOS SE

DENIOS SE - Overview
DENIOS SE - Product / Service
DENIOS SE - Key offerings
SWOT

16.11 Everlux

Everlux - Overview
Everlux - Product / Service
Everlux - Key offerings
SWOT

16.12 Honeywell International Inc.

Honeywell International Inc. - Overview
Honeywell International Inc. - Business segments
Honeywell International Inc. - Key news
Honeywell International Inc. - Key offerings
Honeywell International Inc. - Segment focus
SWOT

16.13 INCOM Manufacturing Group

INCOM Manufacturing Group - Overview
INCOM Manufacturing Group - Product / Service
INCOM Manufacturing Group - Key offerings
SWOT

16.14 JALITE Group

JALITE Group - Overview
JALITE Group - Product / Service
JALITE Group - Key offerings
SWOT

16.15 Justrite Mfg. Co. LLC

Justrite Mfg. Co. LLC - Overview
Justrite Mfg. Co. LLC - Product / Service
Justrite Mfg. Co. LLC - Key offerings
SWOT

16.16 Labelmaster

Labelmaster - Overview
Labelmaster - Product / Service
Labelmaster - Key offerings
SWOT

16.17 Master Lock Co. LLC

Master Lock Co. LLC - Overview
Master Lock Co. LLC - Product / Service
Master Lock Co. LLC - Key offerings
SWOT

16.18 WESCO International Inc.

WESCO International Inc. - Overview
WESCO International Inc. - Business segments
WESCO International Inc. - Key offerings
WESCO International Inc. - Segment focus
SWOT

17. Appendix

17.1 Scope of the report

Market definition
Objectives
Notes and caveats

17.2 Inclusions and exclusions checklist

Inclusions checklist
Exclusions checklist

17.3 Currency conversion rates for US$

17.4 Research methodology

17.5 Data procurement

Information sources

17.6 Data validation

17.7 Validation techniques employed for market sizing

17.8 Data synthesis

17.9 360 degree market analysis

17.10 List of abbreviations

Research Methodology

Technavio presents a detailed picture of the market by way of study, synthesis, and summation of data from multiple sources. The analysts have presented the various facets of the market with a particular focus on identifying the key industry influencers. The data thus presented is comprehensive, reliable, and the result of extensive research, both primary and secondary.

INFORMATION SOURCES

Primary sources

  • Manufacturers and suppliers
  • Channel partners
  • Industry experts
  • Strategic decision makers

Secondary sources

  • Industry journals and periodicals
  • Government data
  • Financial reports of key industry players
  • Historical data
  • Press releases

DATA ANALYSIS

Data Synthesis

  • Collation of data
  • Estimation of key figures
  • Analysis of derived insights

Data Validation

  • Triangulation with data models
  • Reference against proprietary databases
  • Corroboration with industry experts

REPORT WRITING

Qualitative

  • Market drivers
  • Market challenges
  • Market trends
  • Five forces analysis

Quantitative

  • Market size and forecast
  • Market segmentation
  • Geographical insights
  • Competitive landscape

Interested in this report?

Get your sample now to see our research methodology and insights!

Download Now

Frequently Asked Questions

Safety Signs market growth will increase by USD 334.5 million during 2026-2030.

The Safety Signs market is expected to grow at a CAGR of 3.2% during 2026-2030.

Safety Signs market is segmented by End-user (Commercial, Industrial, Residential) Material (Polymer, Metal, Fiberglass) Application (Construction, Manufacturing, Oil and gas, Transportation, Healthcare) Type (Warning, Prohibition, Mandatory, Emergency, Informational)

3M Co., A SAFE, Brady Corp., Brimar Industries LLC, Clarion Safety Systems, Dancop International, DENIOS SE, Everlux, Honeywell International Inc., INCOM Manufacturing Group, JALITE Group, Justrite Mfg. Co. LLC, Labelmaster, Master Lock Co. LLC, Rubbermaid Commercial Products, Safety Media, Safety Sign, Trident Manufacturing, WESCO International Inc., Zumar Industries are a few of the key vendors in the Safety Signs market.

APAC will register the highest growth rate of 41.4% among the other regions. Therefore, the Safety Signs market in APAC is expected to garner significant business opportunities for the vendors during the forecast period.

China, Japan, India, South Korea, Australia, Indonesia, Germany, UK, France, Italy, Spain, The Netherlands, US, Canada, Mexico, Brazil, Argentina, Chile, Saudi Arabia, UAE, South Africa, Turkey, Israel

  • Strict legislative mandates and evolving standards for industrial safety is the driving factor this market.

The Safety Signs market vendors should focus on grabbing business opportunities from the End-user segment as it accounted for the largest market share in the base year.
RIA - Research AI Assistant
Ask RIA
