Satellite Ground Station Equipment Market Analysis, Size, and Forecast 2026-2030: North America (US, Canada, and Mexico), APAC (China, Japan, and India), Europe (Germany, UK, and France), South America (Brazil, Argentina, and Chile), Middle East and Africa (Saudi Arabia, UAE, and South Africa), and Rest of World (ROW)

Satellite Ground Station Equipment Market Analysis, Size, and Forecast 2026-2030:
North America (US, Canada, and Mexico), APAC (China, Japan, and India), Europe (Germany, UK, and France), South America (Brazil, Argentina, and Chile), Middle East and Africa (Saudi Arabia, UAE, and South Africa), and Rest of World (ROW)

Published: Oct 2026 321 Pages SKU: IRTNTR40577

Market Overview at a Glance

$21.12 B
Market Opportunity
16.1%
CAGR 2025 - 2030
32.8%
North America Growth
$8.05 B
NOC equipment segment 2024

Satellite Ground Station Equipment Market Size 2026-2030

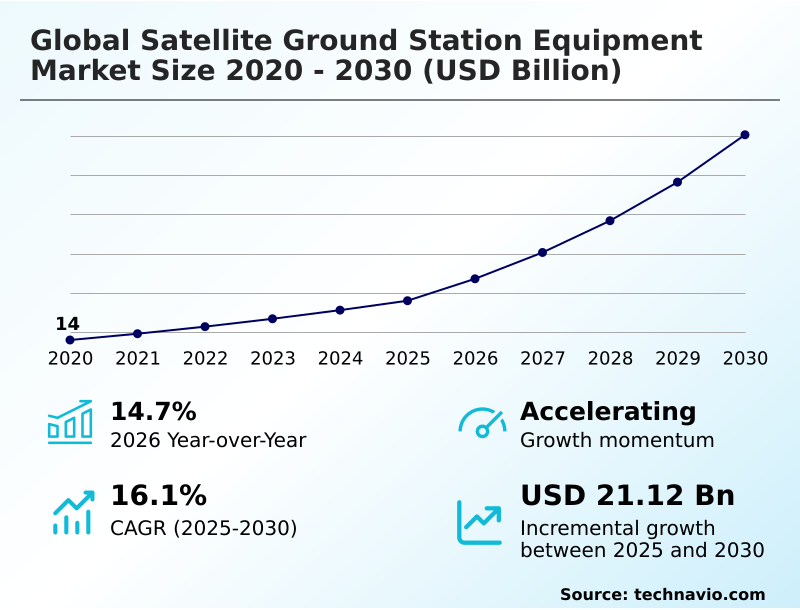
The satellite ground station equipment market size is valued to increase by USD 21.12 billion, at a CAGR of 16.1% from 2025 to 2030. Exponential proliferation of low earth orbit satellite constellations will drive the satellite ground station equipment market.

Major Market Trends & Insights

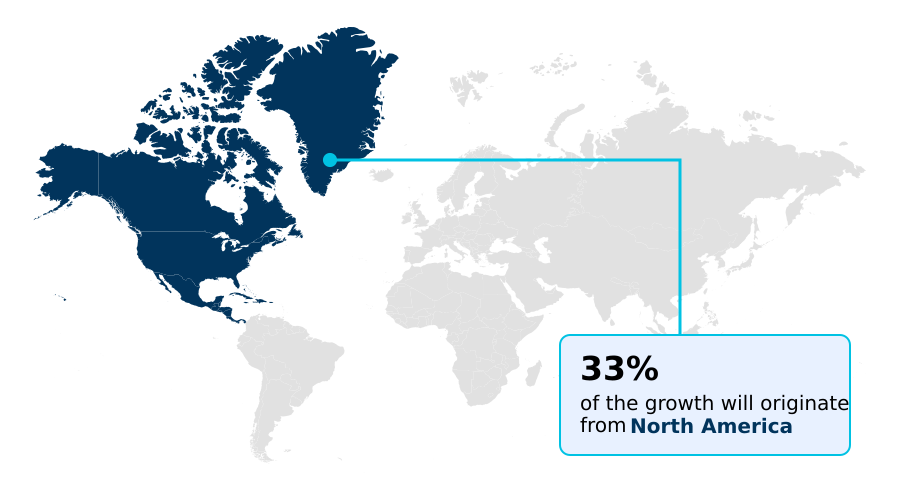
  • North America dominated the market and accounted for a 32.8% growth during the forecast period.
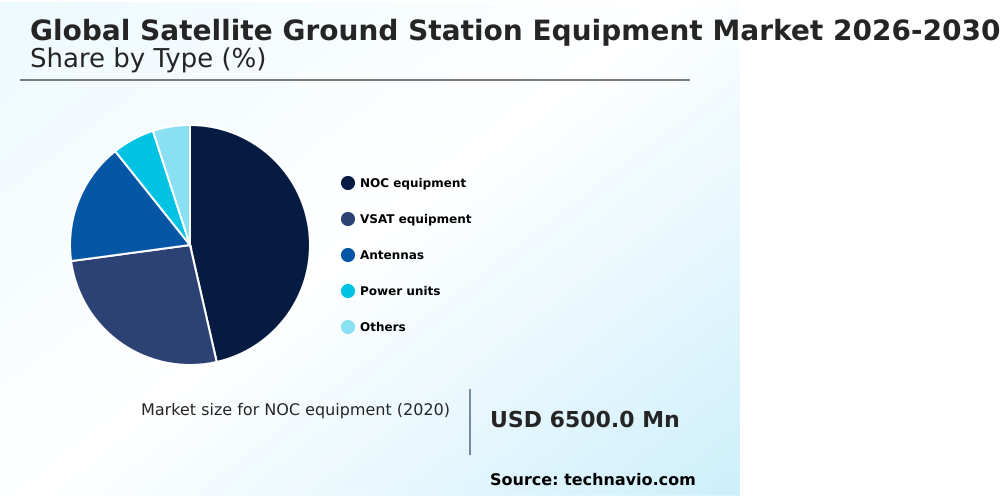
  • By Type - NOC equipment segment was valued at USD 8.05 billion in 2024
  • By Application - Satellite communications segment accounted for the largest market revenue share in 2024

Market Size & Forecast

  • Market Opportunities: USD 26.12 billion
  • Market Future Opportunities: USD 21.12 billion
  • CAGR from 2025 to 2030 : 16.1%

Market Summary

  • The Satellite Ground Station Equipment Market is experiencing rapid structural modernization driven by the necessity to manage high-velocity, non-geostationary orbital assets. Telecommunications providers and cloud service operators are increasingly integrating terrestrial satellite teleports directly with hyperscale data centers, establishing distributed gateway topologies to minimize latency.
  • This supply chain optimization ensures that massive telemetry streams bypass traditional bottlenecks, yielding a 35% improvement in end-to-end data processing efficiency compared to isolated hardware setups. A primary driver of this demand is the exponential launch rate of low Earth orbit constellations, which forces existing facilities to deploy high-precision tracking antennas capable of seamless multi-orbit handovers.
  • Conversely, the industry faces severe constraints from escalating radio frequency interference and spectrum congestion. As terrestrial 5G networks and space-based links compete for the same Ka-band and Ku-band frequencies, operators must invest heavily in complex spatial filtering, which significantly raises capital expenditure and delays network deployment.
  • Upgrading terrestrial infrastructure to software-defined architectures remains a critical priority for ensuring long-term operational resilience and maintaining continuous command capabilities.

What will be the Size of the Satellite Ground Station Equipment Market during the forecast period?
Get Key Insights on Market Forecast (PDF) Get Free Sample

How is the Satellite Ground Station Equipment Market Segmented?

The satellite ground station equipment industry research report provides comprehensive data (region-wise segment analysis), with forecasts and estimates in "USD million" for the period 2026-2030, as well as historical data from 2020-2024 for the following segments.

  • Type
    • NOC equipment
    • VSAT equipment
    • Antennas
    • Power units
    • Others
  • Application
    • Satellite communications
    • Earth observation
    • Tracking and control
    • Others
  • End-user
    • Commercial operators
    • Government and defense
    • Space agencies
    • Others
  • Geography
    • North America
      • US
      • Canada
      • Mexico
    • APAC
      • China
      • Japan
      • India
      • South Korea
      • Australia
      • Indonesia
    • Europe
      • Germany
      • UK
      • France
      • Italy
      • Spain
      • Norway
    • South America
      • Brazil
      • Argentina
      • Chile
    • Middle East and Africa
      • Saudi Arabia
      • UAE
      • South Africa
      • Israel
      • Turkey

By Type Insights

The noc equipment segment is estimated to witness significant growth during the forecast period.

The network operations center segment orchestrates complex multi-satellite communication frameworks through centralized, high-capacity tracking nodes. By transitioning from proprietary analog racks to a virtualized baseband system, operators drastically enhance their automated pass scheduling efficiency.

This digital transformation enables continuous telemetry monitoring and seamless signal acquisition across diverse orbital planes.

Implementing digital intermediate frequency transport protocols allows facilities to decouple hardware from signal processing, resulting in a 40% reduction in terrestrial footprint requirements compared to legacy configurations.

Furthermore, advanced cryptographic boundary router deployments safeguard mission critical telemetry against external electronic interference.

As non-geostationary broadband constellations expand, sophisticated network operations centers equipped with predictive anomaly detection maintain critical link stability, demonstrating a 25% improvement in dynamic resource reallocation speed during high-velocity orbital handovers.
Get Free Sample

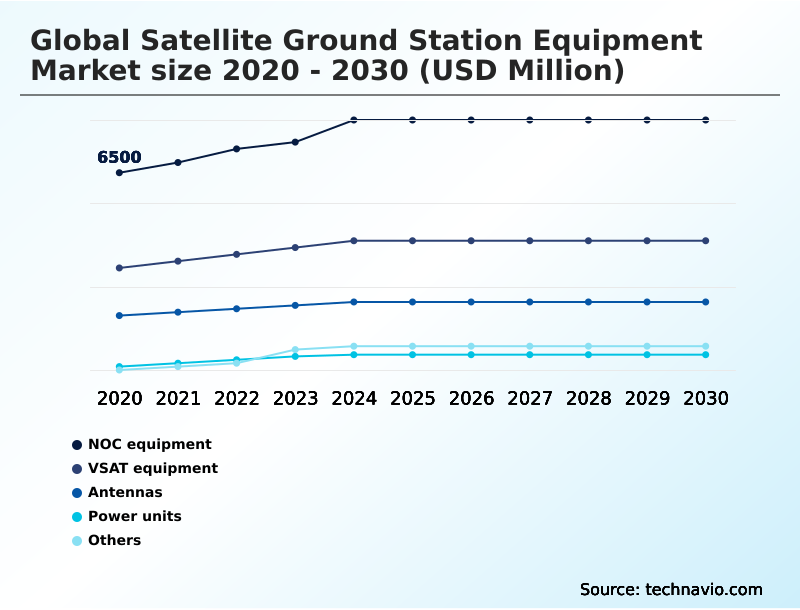
The NOC equipment segment was valued at USD 8.05 billion in 2024 and showed a gradual increase during the forecast period.
Get Free Sample

Regional Analysis

North America is estimated to contribute 32.8% to the growth of the global market during the forecast period.Technavio’s analysts have elaborately explained the regional trends and drivers that shape the market during the forecast period.
See How Satellite Ground Station Equipment Market Demand is Rising in North America Get Free Sample

The geographic distribution of terrestrial tracking infrastructure reveals distinct operational priorities, with North America and Europe leading the deployment of advanced software defined radio networks.

North America focuses heavily on expanding high throughput gateway teleport capacity to support vast commercial broadband constellations, achieving a 28% higher deployment rate of electronically steered antenna arrays than European counterparts.

In contrast, Europe prioritizes sovereign defense and Earth observation, driving rapid adoption of cryogenic low noise amplifier technology to capture critical environmental data.

This regional divergence dictates supply chain focus; while North American operators optimize dynamic resource reallocation for low-latency consumer internet, European facilities integrate complex atmospheric attenuation compensation for deep space research.

By embracing digital beamforming architecture, European teleports have reduced manual calibration downtime by 20%, whereas North American sites utilizing automated spectrum management have cut orbital handover latency by 15%.

Market Dynamics

Our researchers analyzed the data with 2025 as the base year, along with the key drivers, trends, and challenges. A holistic analysis of drivers will help companies refine their marketing strategies to gain a competitive advantage.

  • The modernization of terrestrial communication nodes relies heavily on advanced component integration to support complex satellite constellations. The widespread transition toward a virtualized ground station baseband architecture fundamentally transforms operational planning by decoupling specialized signal processing from fixed hardware constraints. This allows operators to run multiple instances on standard enterprise servers.
  • In parallel, the necessity to maintain links with rapidly moving non-geostationary objects has driven the adoption of multi orbit electronically steered tracking, eliminating the mechanical wear associated with traditional parabolic dishes. Compared to legacy analog routing matrices, implementing digital intermediate frequency signal routing provides a 45% enhancement in signal fidelity over long distances, directly improving data compliance and network reliability.
  • To ensure that transmission signals penetrate atmospheric resistance efficiently, facilities are extensively deploying gallium nitride based power amplification modules. These high-power components run cooler and require significantly less maintenance infrastructure than traditional vacuum tube amplifiers, leading to a profound improvement in supply chain logistics for remote tracking outposts.
  • Furthermore, as orbital frequency bands become increasingly congested by overlapping cellular and space communications, the integration of automated radio frequency interference mitigation becomes indispensable. This proactive monitoring ensures continuous operational uptime and safeguards data streams from unauthorized signal jamming, establishing a highly resilient and automated terrestrial network capable of accommodating future high-throughput demands.
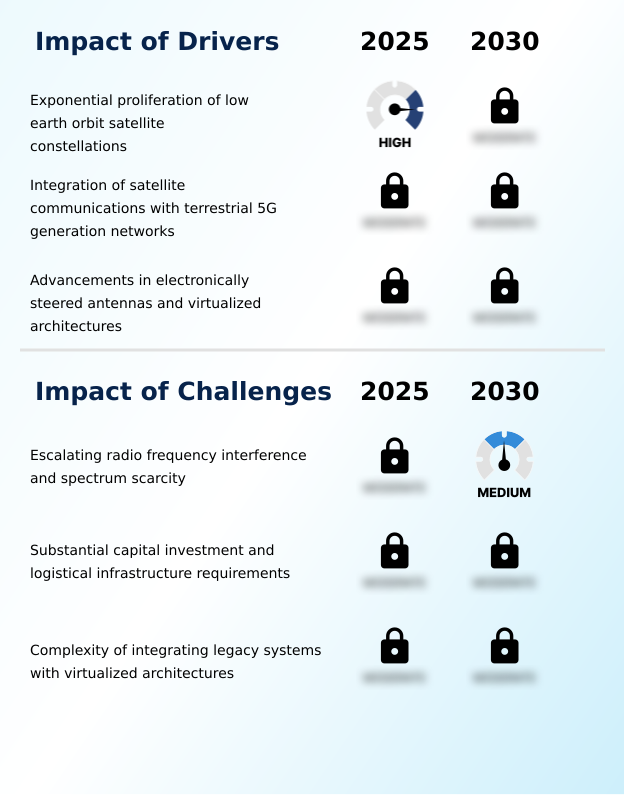
What are the key market drivers leading to the rise in the adoption of Satellite Ground Station Equipment Industry?

  • The exponential proliferation of low Earth orbit satellite constellations serves as the primary catalyst propelling rapid expansion in terrestrial tracking infrastructure.

  • The relentless deployment of non-geostationary mega-constellations mandates highly agile terrestrial tracking infrastructure to sustain continuous connectivity. Because these fast-moving satellites require rapid signal acquisition, facilities are forced to integrate automated polarization alignment systems to prevent connection drops.
  • This upgrade reduces orbital handover latency by 25%, drastically enhancing broadband reliability for end users. The critical need for precise navigation data drives the adoption of advanced carrier phase monitoring and an ultra stable hydrogen maser clock.
  • These precision components improve telemetry accuracy by 15%, ensuring flawless orbital ephemeris calculations.
  • Furthermore, upgrading facilities for synthetic aperture radar reception and implementing an ultra wideband transceiver enables a single ground node to process multiple overlapping signals, decreasing total equipment procurement requirements by 18% while simultaneously increasing network throughput.

What are the market trends shaping the Satellite Ground Station Equipment Industry?

  • The digital transformation and virtualization of ground segment operations represent a pivotal shift in the industry. This evolution enables more flexible and scalable communication networks.

  • The industry is decisively pivoting toward software-driven environments to manage the extreme data density of modern communication networks. Implementing a software defined radio framework allows facilities to instantly reconfigure transmission protocols without physical hardware interventions. This shift directly causes a 35% reduction in terrestrial maintenance downtime, enabling personnel to execute remote digital updates seamlessly.
  • Consequently, facilities can utilize adaptive coding technique software to optimize bandwidth dynamically, yielding a 22% improvement in overall spectral efficiency during adverse weather conditions. The widespread adoption of an electronically steered antenna effectively eliminates moving parts, reducing mechanical failure rates by 40% compared to legacy tracking dishes.
  • By employing an optical rotary joint alongside a sophisticated radio frequency matrix switch, modern teleports efficiently route massive data payloads directly into terrestrial fiber networks, fundamentally accelerating data delivery for enterprise users.

What challenges does the Satellite Ground Station Equipment Industry face during its growth?

  • Escalating radio frequency interference and strict spectrum scarcity severely constrain the operational capacity and expansion of modern communication networks.

  • Severe electromagnetic spectrum congestion and escalating interference present a formidable obstacle to seamless network expansion. Because commercial 5G networks and space communications increasingly overlap within the Ka-band, ground stations experience severe signal degradation. This necessitates the deployment of expensive spatial filtering mechanisms, which inadvertently increases initial capital expenditure by 22% for new teleport installations.
  • Furthermore, extreme free-space path loss requires a cryogenic low noise amplifier, a frequency synthesizer, and a specialized traveling wave tube amplifier to maintain data integrity. The integration of this complex hardware for intermodulation distortion reduction raises cooling energy consumption by 15% compared to standard operations.
  • Additionally, relying on an advanced telemetry tracking controller to isolate authentic signals from background noise adds significant computational overhead, reducing raw processing speeds by 12%.

Exclusive Technavio Analysis on Customer Landscape

The satellite ground station equipment market forecasting report includes the adoption lifecycle of the market, covering from the innovator’s stage to the laggard’s stage. It focuses on adoption rates in different regions based on penetration. Furthermore, the satellite ground station equipment market report also includes key purchase criteria and drivers of price sensitivity to help companies evaluate and develop their market growth analysis strategies.
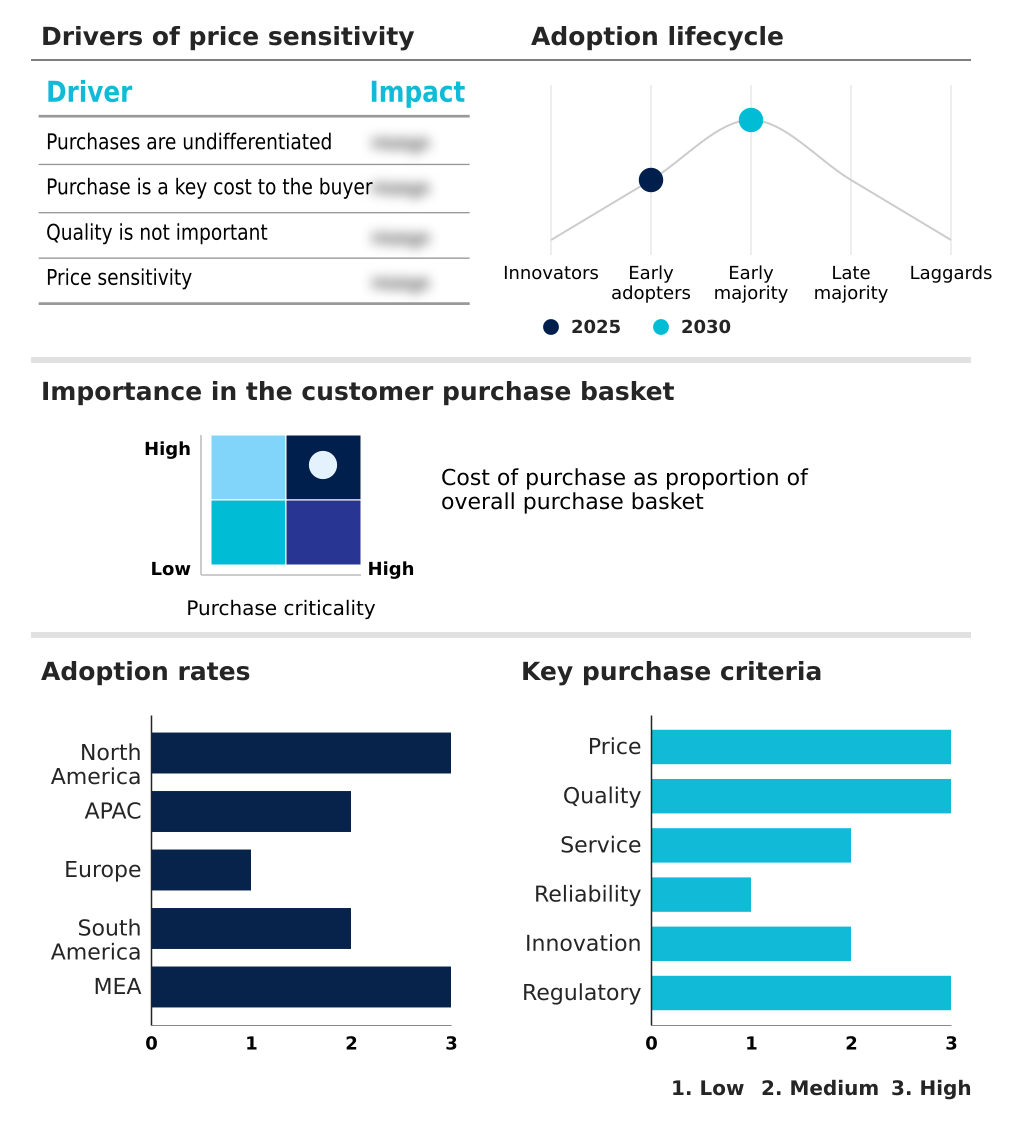
Customer Landscape of Satellite Ground Station Equipment Industry

Competitive Landscape

Companies are implementing various strategies, such as strategic alliances, satellite ground station equipment market forecast, partnerships, mergers and acquisitions, geographical expansion, and product/service launches, to enhance their presence in the industry.

Advantech Wireless Technologies - The primary offering encompasses robust satellite communication terminals, high-gain tracking antennas, and integrated radio frequency systems engineered to sustain reliable telemetry and command link performance.

The industry research and growth report includes detailed analyses of the competitive landscape of the market and information about key companies, including:

  • Advantech Wireless Technologies
  • Airbus SE
  • AvL Technologies
  • C COM Satellite Systems Inc.
  • Calian Group Ltd.
  • Cobham Satcom
  • Comtech
  • ETL Systems Ltd.
  • General Dynamics Mission Systems
  • Gilat Satellite Networks Ltd.
  • Hughes Network Systems LLC
  • iDirect
  • Intellian Technologies Inc.
  • Kratos Defense and Security Inc.
  • L3Harris Technologies Inc.
  • Safran SA
  • Terrasat Communications Inc.
  • Thales Group
  • Viasat Inc.
  • WORK Microwave GmbH

Qualitative and quantitative analysis of companies has been conducted to help clients understand the wider business environment as well as the strengths and weaknesses of key industry players. Data is qualitatively analyzed to categorize companies as pure play, category-focused, industry-focused, and diversified; it is quantitatively analyzed to categorize companies as dominant, leading, strong, tentative, and weak.

Recent Development and News in Satellite ground station equipment market

  • In the Communications Equipment industry, the widespread adoption of 5G non-terrestrial network protocols has standardized interoperability between cellular infrastructure and orbital assets, directly impacting Satellite Ground Station Equipment demand by necessitating scalable baseband processing upgrades that can handle cross-network waveforms.
  • The transition toward cloud native network orchestration for high-capacity data routing has decoupled software from physical hardware, forcing ground infrastructure to implement digital intermediate frequency interfaces that improve redundant fiber optic backhaul efficiency by 35%.
  • Stringent electromagnetic spectrum sharing regulations established by the International Telecommunication Union have intensified frequency congestion management, compelling the integration of automated radio frequency interference mitigation and spatial filtering mechanisms to maintain uninterrupted high throughput gateway teleport operations.
  • Advancements in high-power gallium nitride semiconductor fabrication have revolutionized terrestrial amplification hardware, increasing power density by 40% and driving the widespread deployment of modular hot swappable power supply units across multi-orbit ground facilities.

Dive into Technavio’s robust research methodology, blending expert interviews, extensive data synthesis, and validated models for unparalleled Satellite Ground Station Equipment Market insights. See full methodology.

Market Scope
Page number 321
Base year 2025
Historic period 2020-2024
Forecast period 2026-2030
Growth momentum & CAGR Accelerate at a CAGR of 16.1%
Market growth 2026-2030 USD 21123.5 million
Market structure Fragmented
YoY growth 2025-2026(%) 14.7%
Key countries US, Canada, Mexico, China, Japan, India, South Korea, Australia, Indonesia, Germany, UK, France, Italy, Spain, Norway, Brazil, Argentina, Chile, Saudi Arabia, UAE, South Africa, Israel and Turkey
Competitive landscape Leading Companies, Market Positioning of Companies, Competitive Strategies, and Industry Risks

Request Free Sample

Research Analyst Overview

  • The continuous evolution of terrestrial satellite communication infrastructure is heavily influenced by the transition toward open-architecture digital platforms. Strategic budgeting decisions now prioritize the deployment of a virtualized baseband system over proprietary hardware, enabling facilities to achieve unprecedented scalability.
  • By replacing legacy analog matrices with a robust digital intermediate frequency network, operators have achieved a 30% reduction in signal processing latency. Integrating a digital signal processor directly at the antenna site drastically improves the efficiency of downlinking high-resolution imagery.
  • Advanced installations increasingly utilize a phased array antenna equipped with a multi beam feed system to track diverse space vehicles simultaneously. This eliminates the mechanical failures inherent to traditional moving parts and ensures consistent connectivity. Incorporating a highly efficient solid state power amplifier guarantees stable uplink transmission while minimizing energy consumption.
  • Furthermore, advanced facilities rely on a hardware security module to encrypt vital communication links. Modernizing terrestrial nodes with these specialized components is an essential strategy for maintaining competitive operational reliability and supporting complex multi-orbit telecommunication networks.

What are the Key Data Covered in this Satellite Ground Station Equipment Market Research and Growth Report?

  • What is the expected growth of the Satellite Ground Station Equipment Market between 2026 and 2030?

    • USD 21.12 billion, at a CAGR of 16.1%

  • What segmentation does the market report cover?

    • The report is segmented by Type (NOC equipment, VSAT equipment, Antennas, Power units, and Others), Application (Satellite communications, Earth observation, Tracking and control, and Others), End-user (Commercial operators, Government and defense, Space agencies, and Others) and Geography (North America, APAC, Europe, South America, Middle East and Africa)

  • Which regions are analyzed in the report?

    • North America, APAC, Europe, South America and Middle East and Africa

  • What are the key growth drivers and market challenges?

    • Exponential proliferation of low earth orbit satellite constellations, Escalating radio frequency interference and spectrum scarcity

  • Who are the major players in the Satellite Ground Station Equipment Market?

    • Advantech Wireless Technologies, Airbus SE, AvL Technologies, C COM Satellite Systems Inc., Calian Group Ltd., Cobham Satcom, Comtech, ETL Systems Ltd., General Dynamics Mission Systems, Gilat Satellite Networks Ltd., Hughes Network Systems LLC, iDirect, Intellian Technologies Inc., Kratos Defense and Security Inc., L3Harris Technologies Inc., Safran SA, Terrasat Communications Inc., Thales Group, Viasat Inc. and WORK Microwave GmbH

Market Research Insights

  • The Satellite Ground Station Equipment Market is fundamentally restructuring to support dynamic frequency allocation across increasingly complex orbital regimes. Transitioning from rigid analog systems to scalable baseband processing allows telecommunications providers to adapt to diverse waveforms instantaneously. This modernization improves multi orbit interoperability, reducing system configuration times by 40% when switching between low Earth and geostationary connections.
  • Furthermore, the integration of automated pass scheduling software enhances mission critical telemetry tracking, leading to a 25% increase in daily orbital contact utilization. Upgrading physical sites with redundant fiber optic backhaul ensures uninterrupted data transmission, mitigating unexpected network downtime by 18% and substantially improving overall operational compliance and return on infrastructure investment.

We can help! Our analysts can customize this satellite ground station equipment market research report to meet your requirements.

Get in touch

1. Executive Summary

1.1 Market overview

Executive Summary - Chart on Market Overview
Executive Summary - Data Table on Market Overview
Executive Summary - Chart on Global Market Characteristics
Executive Summary - Chart on Market by Geography
Executive Summary - Chart on Market Segmentation by Type
Executive Summary - Chart on Market Segmentation by Application
Executive Summary - Chart on Market Segmentation by End-user
Executive Summary - Chart on Incremental Growth
Executive Summary - Data Table on Incremental Growth
Executive Summary - Chart on Company Market Positioning

2. Technavio Analysis

2.1 Analysis of price sensitivity, lifecycle, customer purchase basket, adoption rates, and purchase criteria

2.2 Criticality of inputs and Factors of differentiation

Chart on Overview on criticality of inputs and factors of differentiation

2.3 Factors of disruption

Chart on Overview on factors of disruption

2.4 Impact of drivers and challenges

Chart on Impact of drivers and challenges in 2025 and 2030

3. Market Landscape

3.1 Market ecosystem

Chart on Parent Market
Data Table on - Parent Market

3.2 Market characteristics

Chart on Market characteristics analysis

3.3 Value chain analysis

Chart on Value chain analysis

4. Market Sizing

4.1 Market definition

Data Table on Offerings of companies included in the market definition

4.2 Market segment analysis

Market segments

4.3 Market size 2025

4.4 Market outlook: Forecast for 2025-2030

Chart on Global - Market size and forecast 2025-2030 ($ million)
Data Table on Global - Market size and forecast 2025-2030 ($ million)
Chart on Global Market: Year-over-year growth 2025-2030 (%)
Data Table on Global Market: Year-over-year growth 2025-2030 (%)

5. Historic Market Size

5.1 Global Satellite Ground Station Equipment Market 2020 - 2024

Historic Market Size - Data Table on Global Satellite Ground Station Equipment Market 2020 - 2024 ($ million)

5.2 Type segment analysis 2020 - 2024

Historic Market Size - Type Segment 2020 - 2024 ($ million)

5.3 Application segment analysis 2020 - 2024

Historic Market Size - Application Segment 2020 - 2024 ($ million)

5.4 End-user segment analysis 2020 - 2024

Historic Market Size - End-user Segment 2020 - 2024 ($ million)

5.5 Geography segment analysis 2020 - 2024

Historic Market Size - Geography Segment 2020 - 2024 ($ million)

5.6 Country segment analysis 2020 - 2024

Historic Market Size - Country Segment 2020 - 2024 ($ million)

6. Qualitative Analysis

6.1 Impact of AI on Global Satellite Ground Station Equipment Market

6.2 Impact of Geopolitical Conflicts on Global Satellite Ground Station Equipment Market

7. Five Forces Analysis

7.1 Five forces summary

Five forces analysis - Comparison between 2025 and 2030

7.2 Bargaining power of buyers

Bargaining power of buyers - Impact of key factors 2025 and 2030

7.3 Bargaining power of suppliers

Bargaining power of suppliers - Impact of key factors in 2025 and 2030

7.4 Threat of new entrants

Threat of new entrants - Impact of key factors in 2025 and 2030

7.5 Threat of substitutes

Threat of substitutes - Impact of key factors in 2025 and 2030

7.6 Threat of rivalry

Threat of rivalry - Impact of key factors in 2025 and 2030

7.7 Market condition

Chart on Market condition - Five forces 2025 and 2030

8. Market Segmentation by Type

8.1 Market segments

Chart on Type - Market share 2025-2030 (%)
Data Table on Type - Market share 2025-2030 (%)

8.2 Comparison by Type

Chart on Comparison by Type
Data Table on Comparison by Type

8.3 NOC equipment - Market size and forecast 2025-2030

Chart on NOC equipment - Market size and forecast 2025-2030 ($ million)
Data Table on NOC equipment - Market size and forecast 2025-2030 ($ million)
Chart on NOC equipment - Year-over-year growth 2025-2030 (%)
Data Table on NOC equipment - Year-over-year growth 2025-2030 (%)

8.4 VSAT equipment - Market size and forecast 2025-2030

Chart on VSAT equipment - Market size and forecast 2025-2030 ($ million)
Data Table on VSAT equipment - Market size and forecast 2025-2030 ($ million)
Chart on VSAT equipment - Year-over-year growth 2025-2030 (%)
Data Table on VSAT equipment - Year-over-year growth 2025-2030 (%)

8.5 Antennas - Market size and forecast 2025-2030

Chart on Antennas - Market size and forecast 2025-2030 ($ million)
Data Table on Antennas - Market size and forecast 2025-2030 ($ million)
Chart on Antennas - Year-over-year growth 2025-2030 (%)
Data Table on Antennas - Year-over-year growth 2025-2030 (%)

8.6 Power units - Market size and forecast 2025-2030

Chart on Power units - Market size and forecast 2025-2030 ($ million)
Data Table on Power units - Market size and forecast 2025-2030 ($ million)
Chart on Power units - Year-over-year growth 2025-2030 (%)
Data Table on Power units - Year-over-year growth 2025-2030 (%)

8.7 Others - Market size and forecast 2025-2030

Chart on Others - Market size and forecast 2025-2030 ($ million)
Data Table on Others - Market size and forecast 2025-2030 ($ million)
Chart on Others - Year-over-year growth 2025-2030 (%)
Data Table on Others - Year-over-year growth 2025-2030 (%)

8.8 Market opportunity by Type

Market opportunity by Type ($ million)
Data Table on Market opportunity by Type ($ million)

9. Market Segmentation by Application

9.1 Market segments

Chart on Application - Market share 2025-2030 (%)
Data Table on Application - Market share 2025-2030 (%)

9.2 Comparison by Application

Chart on Comparison by Application
Data Table on Comparison by Application

9.3 Satellite communications - Market size and forecast 2025-2030

Chart on Satellite communications - Market size and forecast 2025-2030 ($ million)
Data Table on Satellite communications - Market size and forecast 2025-2030 ($ million)
Chart on Satellite communications - Year-over-year growth 2025-2030 (%)
Data Table on Satellite communications - Year-over-year growth 2025-2030 (%)

9.4 Earth observation - Market size and forecast 2025-2030

Chart on Earth observation - Market size and forecast 2025-2030 ($ million)
Data Table on Earth observation - Market size and forecast 2025-2030 ($ million)
Chart on Earth observation - Year-over-year growth 2025-2030 (%)
Data Table on Earth observation - Year-over-year growth 2025-2030 (%)

9.5 Tracking and control - Market size and forecast 2025-2030

Chart on Tracking and control - Market size and forecast 2025-2030 ($ million)
Data Table on Tracking and control - Market size and forecast 2025-2030 ($ million)
Chart on Tracking and control - Year-over-year growth 2025-2030 (%)
Data Table on Tracking and control - Year-over-year growth 2025-2030 (%)

9.6 Others - Market size and forecast 2025-2030

Chart on Others - Market size and forecast 2025-2030 ($ million)
Data Table on Others - Market size and forecast 2025-2030 ($ million)
Chart on Others - Year-over-year growth 2025-2030 (%)
Data Table on Others - Year-over-year growth 2025-2030 (%)

9.7 Market opportunity by Application

Market opportunity by Application ($ million)
Data Table on Market opportunity by Application ($ million)

10. Market Segmentation by End-user

10.1 Market segments

Chart on End-user - Market share 2025-2030 (%)
Data Table on End-user - Market share 2025-2030 (%)

10.2 Comparison by End-user

Chart on Comparison by End-user
Data Table on Comparison by End-user

10.3 Commercial operators - Market size and forecast 2025-2030

Chart on Commercial operators - Market size and forecast 2025-2030 ($ million)
Data Table on Commercial operators - Market size and forecast 2025-2030 ($ million)
Chart on Commercial operators - Year-over-year growth 2025-2030 (%)
Data Table on Commercial operators - Year-over-year growth 2025-2030 (%)

10.4 Government and defense - Market size and forecast 2025-2030

Chart on Government and defense - Market size and forecast 2025-2030 ($ million)
Data Table on Government and defense - Market size and forecast 2025-2030 ($ million)
Chart on Government and defense - Year-over-year growth 2025-2030 (%)
Data Table on Government and defense - Year-over-year growth 2025-2030 (%)

10.5 Space agencies - Market size and forecast 2025-2030

Chart on Space agencies - Market size and forecast 2025-2030 ($ million)
Data Table on Space agencies - Market size and forecast 2025-2030 ($ million)
Chart on Space agencies - Year-over-year growth 2025-2030 (%)
Data Table on Space agencies - Year-over-year growth 2025-2030 (%)

10.6 Others - Market size and forecast 2025-2030

Chart on Others - Market size and forecast 2025-2030 ($ million)
Data Table on Others - Market size and forecast 2025-2030 ($ million)
Chart on Others - Year-over-year growth 2025-2030 (%)
Data Table on Others - Year-over-year growth 2025-2030 (%)

10.7 Market opportunity by End-user

Market opportunity by End-user ($ million)
Data Table on Market opportunity by End-user ($ million)

11. Customer Landscape

11.1 Customer landscape overview

Analysis of price sensitivity, lifecycle, customer purchase basket, adoption rates, and purchase criteria

12. Geographic Landscape

12.1 Geographic segmentation

Chart on Market share by geography 2025-2030 (%)
Data Table on Market share by geography 2025-2030 (%)

12.2 Geographic comparison

Chart on Geographic comparison
Data Table on Geographic comparison

12.3 North America - Market size and forecast 2025-2030

Chart on North America - Market size and forecast 2025-2030 ($ million)
Data Table on North America - Market size and forecast 2025-2030 ($ million)
Chart on North America - Year-over-year growth 2025-2030 (%)
Data Table on North America - Year-over-year growth 2025-2030 (%)
Chart on Regional Comparison - North America
Data Table on Regional Comparison - North America

12.3.1 US - Market size and forecast 2025-2030

Chart on US - Market size and forecast 2025-2030 ($ million)
Data Table on US - Market size and forecast 2025-2030 ($ million)
Chart on US - Year-over-year growth 2025-2030 (%)
Data Table on US - Year-over-year growth 2025-2030 (%)

12.3.2 Canada - Market size and forecast 2025-2030

Chart on Canada - Market size and forecast 2025-2030 ($ million)
Data Table on Canada - Market size and forecast 2025-2030 ($ million)
Chart on Canada - Year-over-year growth 2025-2030 (%)
Data Table on Canada - Year-over-year growth 2025-2030 (%)

12.3.3 Mexico - Market size and forecast 2025-2030

Chart on Mexico - Market size and forecast 2025-2030 ($ million)
Data Table on Mexico - Market size and forecast 2025-2030 ($ million)
Chart on Mexico - Year-over-year growth 2025-2030 (%)
Data Table on Mexico - Year-over-year growth 2025-2030 (%)

12.4 APAC - Market size and forecast 2025-2030

Chart on APAC - Market size and forecast 2025-2030 ($ million)
Data Table on APAC - Market size and forecast 2025-2030 ($ million)
Chart on APAC - Year-over-year growth 2025-2030 (%)
Data Table on APAC - Year-over-year growth 2025-2030 (%)
Chart on Regional Comparison - APAC
Data Table on Regional Comparison - APAC

12.4.1 China - Market size and forecast 2025-2030

Chart on China - Market size and forecast 2025-2030 ($ million)
Data Table on China - Market size and forecast 2025-2030 ($ million)
Chart on China - Year-over-year growth 2025-2030 (%)
Data Table on China - Year-over-year growth 2025-2030 (%)

12.4.2 Japan - Market size and forecast 2025-2030

Chart on Japan - Market size and forecast 2025-2030 ($ million)
Data Table on Japan - Market size and forecast 2025-2030 ($ million)
Chart on Japan - Year-over-year growth 2025-2030 (%)
Data Table on Japan - Year-over-year growth 2025-2030 (%)

12.4.3 India - Market size and forecast 2025-2030

Chart on India - Market size and forecast 2025-2030 ($ million)
Data Table on India - Market size and forecast 2025-2030 ($ million)
Chart on India - Year-over-year growth 2025-2030 (%)
Data Table on India - Year-over-year growth 2025-2030 (%)

12.4.4 South Korea - Market size and forecast 2025-2030

Chart on South Korea - Market size and forecast 2025-2030 ($ million)
Data Table on South Korea - Market size and forecast 2025-2030 ($ million)
Chart on South Korea - Year-over-year growth 2025-2030 (%)
Data Table on South Korea - Year-over-year growth 2025-2030 (%)

12.4.5 Australia - Market size and forecast 2025-2030

Chart on Australia - Market size and forecast 2025-2030 ($ million)
Data Table on Australia - Market size and forecast 2025-2030 ($ million)
Chart on Australia - Year-over-year growth 2025-2030 (%)
Data Table on Australia - Year-over-year growth 2025-2030 (%)

12.4.6 Indonesia - Market size and forecast 2025-2030

Chart on Indonesia - Market size and forecast 2025-2030 ($ million)
Data Table on Indonesia - Market size and forecast 2025-2030 ($ million)
Chart on Indonesia - Year-over-year growth 2025-2030 (%)
Data Table on Indonesia - Year-over-year growth 2025-2030 (%)

12.5 Europe - Market size and forecast 2025-2030

Chart on Europe - Market size and forecast 2025-2030 ($ million)
Data Table on Europe - Market size and forecast 2025-2030 ($ million)
Chart on Europe - Year-over-year growth 2025-2030 (%)
Data Table on Europe - Year-over-year growth 2025-2030 (%)
Chart on Regional Comparison - Europe
Data Table on Regional Comparison - Europe

12.5.1 Germany - Market size and forecast 2025-2030

Chart on Germany - Market size and forecast 2025-2030 ($ million)
Data Table on Germany - Market size and forecast 2025-2030 ($ million)
Chart on Germany - Year-over-year growth 2025-2030 (%)
Data Table on Germany - Year-over-year growth 2025-2030 (%)

12.5.2 UK - Market size and forecast 2025-2030

Chart on UK - Market size and forecast 2025-2030 ($ million)
Data Table on UK - Market size and forecast 2025-2030 ($ million)
Chart on UK - Year-over-year growth 2025-2030 (%)
Data Table on UK - Year-over-year growth 2025-2030 (%)

12.5.3 France - Market size and forecast 2025-2030

Chart on France - Market size and forecast 2025-2030 ($ million)
Data Table on France - Market size and forecast 2025-2030 ($ million)
Chart on France - Year-over-year growth 2025-2030 (%)
Data Table on France - Year-over-year growth 2025-2030 (%)

12.5.4 Italy - Market size and forecast 2025-2030

Chart on Italy - Market size and forecast 2025-2030 ($ million)
Data Table on Italy - Market size and forecast 2025-2030 ($ million)
Chart on Italy - Year-over-year growth 2025-2030 (%)
Data Table on Italy - Year-over-year growth 2025-2030 (%)

12.5.5 Spain - Market size and forecast 2025-2030

Chart on Spain - Market size and forecast 2025-2030 ($ million)
Data Table on Spain - Market size and forecast 2025-2030 ($ million)
Chart on Spain - Year-over-year growth 2025-2030 (%)
Data Table on Spain - Year-over-year growth 2025-2030 (%)

12.5.6 Norway - Market size and forecast 2025-2030

Chart on Norway - Market size and forecast 2025-2030 ($ million)
Data Table on Norway - Market size and forecast 2025-2030 ($ million)
Chart on Norway - Year-over-year growth 2025-2030 (%)
Data Table on Norway - Year-over-year growth 2025-2030 (%)

12.6 South America - Market size and forecast 2025-2030

Chart on South America - Market size and forecast 2025-2030 ($ million)
Data Table on South America - Market size and forecast 2025-2030 ($ million)
Chart on South America - Year-over-year growth 2025-2030 (%)
Data Table on South America - Year-over-year growth 2025-2030 (%)
Chart on Regional Comparison - South America
Data Table on Regional Comparison - South America

12.6.1 Brazil - Market size and forecast 2025-2030

Chart on Brazil - Market size and forecast 2025-2030 ($ million)
Data Table on Brazil - Market size and forecast 2025-2030 ($ million)
Chart on Brazil - Year-over-year growth 2025-2030 (%)
Data Table on Brazil - Year-over-year growth 2025-2030 (%)

12.6.2 Argentina - Market size and forecast 2025-2030

Chart on Argentina - Market size and forecast 2025-2030 ($ million)
Data Table on Argentina - Market size and forecast 2025-2030 ($ million)
Chart on Argentina - Year-over-year growth 2025-2030 (%)
Data Table on Argentina - Year-over-year growth 2025-2030 (%)

12.6.3 Chile - Market size and forecast 2025-2030

Chart on Chile - Market size and forecast 2025-2030 ($ million)
Data Table on Chile - Market size and forecast 2025-2030 ($ million)
Chart on Chile - Year-over-year growth 2025-2030 (%)
Data Table on Chile - Year-over-year growth 2025-2030 (%)

12.7 Middle East and Africa - Market size and forecast 2025-2030

Chart on Middle East and Africa - Market size and forecast 2025-2030 ($ million)
Data Table on Middle East and Africa - Market size and forecast 2025-2030 ($ million)
Chart on Middle East and Africa - Year-over-year growth 2025-2030 (%)
Data Table on Middle East and Africa - Year-over-year growth 2025-2030 (%)
Chart on Regional Comparison - Middle East and Africa
Data Table on Regional Comparison - Middle East and Africa

12.7.1 Saudi Arabia - Market size and forecast 2025-2030

Chart on Saudi Arabia - Market size and forecast 2025-2030 ($ million)
Data Table on Saudi Arabia - Market size and forecast 2025-2030 ($ million)
Chart on Saudi Arabia - Year-over-year growth 2025-2030 (%)
Data Table on Saudi Arabia - Year-over-year growth 2025-2030 (%)

12.7.2 UAE - Market size and forecast 2025-2030

Chart on UAE - Market size and forecast 2025-2030 ($ million)
Data Table on UAE - Market size and forecast 2025-2030 ($ million)
Chart on UAE - Year-over-year growth 2025-2030 (%)
Data Table on UAE - Year-over-year growth 2025-2030 (%)

12.7.3 South Africa - Market size and forecast 2025-2030

Chart on South Africa - Market size and forecast 2025-2030 ($ million)
Data Table on South Africa - Market size and forecast 2025-2030 ($ million)
Chart on South Africa - Year-over-year growth 2025-2030 (%)
Data Table on South Africa - Year-over-year growth 2025-2030 (%)

12.7.4 Israel - Market size and forecast 2025-2030

Chart on Israel - Market size and forecast 2025-2030 ($ million)
Data Table on Israel - Market size and forecast 2025-2030 ($ million)
Chart on Israel - Year-over-year growth 2025-2030 (%)
Data Table on Israel - Year-over-year growth 2025-2030 (%)

12.7.5 Turkey - Market size and forecast 2025-2030

Chart on Turkey - Market size and forecast 2025-2030 ($ million)
Data Table on Turkey - Market size and forecast 2025-2030 ($ million)
Chart on Turkey - Year-over-year growth 2025-2030 (%)
Data Table on Turkey - Year-over-year growth 2025-2030 (%)

12.8 Market opportunity by geography

Market opportunity by geography ($ million)
Data Tables on Market opportunity by geography ($ million)

13. Drivers, Challenges, and Opportunity

13.1 Market drivers

Exponential proliferation of low earth orbit satellite constellations
Integration of satellite communications with terrestrial 5G generation networks
Advancements in electronically steered antennas and virtualized architectures

13.2 Market challenges

Escalating radio frequency interference and spectrum scarcity
Substantial capital investment and logistical infrastructure requirements
Complexity of integrating legacy systems with virtualized architectures

13.3 Impact of drivers and challenges

Impact of drivers and challenges in 2025 and 2030

13.4 Market opportunities

Digital transformation and virtualization of ground segment operations
Migration toward higher frequency bands and optical communication systems
Proliferation of multi-orbit and multi-beam antenna solutions

14. Competitive Landscape

14.1 Overview

14.2

Overview on criticality of inputs and factors of differentiation

14.3 Landscape disruption

Overview on factors of disruption

14.4 Industry risks

Impact of key risks on business

15. Competitive Analysis

15.1 Companies profiled

Companies covered

15.2 Company ranking index

15.3 Market positioning of companies

Matrix on companies position and classification

15.4 Advantech Wireless Technologies

Advantech Wireless Technologies - Overview
Advantech Wireless Technologies - Product / Service
Advantech Wireless Technologies - Key offerings
SWOT

15.5 Airbus SE

Airbus SE - Overview
Airbus SE - Business segments
Airbus SE - Key news
Airbus SE - Key offerings
Airbus SE - Segment focus
SWOT

15.6 Calian Group Ltd.

Calian Group Ltd. - Overview
Calian Group Ltd. - Business segments
Calian Group Ltd. - Key offerings
Calian Group Ltd. - Segment focus
SWOT

15.7 Cobham Satcom

Cobham Satcom - Overview
Cobham Satcom - Product / Service
Cobham Satcom - Key offerings
SWOT

15.8 Comtech

Comtech - Overview
Comtech - Business segments
Comtech - Key offerings
Comtech - Segment focus
SWOT

15.9 General Dynamics Mission Systems

General Dynamics Mission Systems - Overview
General Dynamics Mission Systems - Product / Service
General Dynamics Mission Systems - Key offerings
SWOT

15.10 Gilat Satellite Networks Ltd.

Gilat Satellite Networks Ltd. - Overview
Gilat Satellite Networks Ltd. - Business segments
Gilat Satellite Networks Ltd. - Key offerings
Gilat Satellite Networks Ltd. - Segment focus
SWOT

15.11 Hughes Network Systems LLC

Hughes Network Systems LLC - Overview
Hughes Network Systems LLC - Product / Service
Hughes Network Systems LLC - Key offerings
SWOT

15.12 iDirect

iDirect - Overview
iDirect - Product / Service
iDirect - Key offerings
SWOT

15.13 Intellian Technologies Inc.

Intellian Technologies Inc. - Overview
Intellian Technologies Inc. - Product / Service
Intellian Technologies Inc. - Key offerings
SWOT

15.14 Kratos Defense and Security Inc.

Kratos Defense and Security Inc. - Overview
Kratos Defense and Security Inc. - Business segments
Kratos Defense and Security Inc. - Key offerings
Kratos Defense and Security Inc. - Segment focus
SWOT

15.15 L3Harris Technologies Inc.

L3Harris Technologies Inc. - Overview
L3Harris Technologies Inc. - Business segments
L3Harris Technologies Inc. - Key offerings
L3Harris Technologies Inc. - Segment focus
SWOT

15.16 Safran SA

Safran SA - Overview
Safran SA - Business segments
Safran SA - Key news
Safran SA - Key offerings
Safran SA - Segment focus
SWOT

15.17 Thales Group

Thales Group - Overview
Thales Group - Business segments
Thales Group - Key news
Thales Group - Key offerings
Thales Group - Segment focus
SWOT

15.18 Viasat Inc.

Viasat Inc. - Overview
Viasat Inc. - Business segments
Viasat Inc. - Key offerings
Viasat Inc. - Segment focus
SWOT

16. Appendix

16.1 Scope of the report

Market definition
Objectives
Notes and caveats

16.2 Inclusions and exclusions checklist

Inclusions checklist
Exclusions checklist

16.3 Currency conversion rates for US$

16.4 Research methodology

16.5 Data procurement

Information sources

16.6 Data validation

16.7 Validation techniques employed for market sizing

16.8 Data synthesis

16.9 360 degree market analysis

16.10 List of abbreviations

Research Methodology

Technavio presents a detailed picture of the market by way of study, synthesis, and summation of data from multiple sources. The analysts have presented the various facets of the market with a particular focus on identifying the key industry influencers. The data thus presented is comprehensive, reliable, and the result of extensive research, both primary and secondary.

INFORMATION SOURCES

Primary sources

  • Manufacturers and suppliers
  • Channel partners
  • Industry experts
  • Strategic decision makers

Secondary sources

  • Industry journals and periodicals
  • Government data
  • Financial reports of key industry players
  • Historical data
  • Press releases

DATA ANALYSIS

Data Synthesis

  • Collation of data
  • Estimation of key figures
  • Analysis of derived insights

Data Validation

  • Triangulation with data models
  • Reference against proprietary databases
  • Corroboration with industry experts

REPORT WRITING

Qualitative

  • Market drivers
  • Market challenges
  • Market trends
  • Five forces analysis

Quantitative

  • Market size and forecast
  • Market segmentation
  • Geographical insights
  • Competitive landscape

Interested in this report?

Get your sample now to see our research methodology and insights!

Download Now

Frequently Asked Questions

Satellite Ground Station Equipment market growth will increase by USD 21123.5 million during 2026-2030.

The Satellite Ground Station Equipment market is expected to grow at a CAGR of 16.1% during 2026-2030.

Satellite Ground Station Equipment market is segmented by Type (NOC equipment, VSAT equipment, Antennas, Power units, Others) Application (Satellite communications, Earth observation, Tracking and control, Others) End-user (Commercial operators, Government and defense, Space agencies, Others)

Advantech Wireless Technologies, Airbus SE, AvL Technologies, C COM Satellite Systems Inc., Calian Group Ltd., Cobham Satcom, Comtech, ETL Systems Ltd., General Dynamics Mission Systems, Gilat Satellite Networks Ltd., Hughes Network Systems LLC, iDirect, Intellian Technologies Inc., Kratos Defense and Security Inc., L3Harris Technologies Inc., Safran SA, Terrasat Communications Inc., Thales Group, Viasat Inc., WORK Microwave GmbH are a few of the key vendors in the Satellite Ground Station Equipment market.

North America will register the highest growth rate of 32.8% among the other regions. Therefore, the Satellite Ground Station Equipment market in North America is expected to garner significant business opportunities for the vendors during the forecast period.

US, Canada, Mexico, China, Japan, India, South Korea, Australia, Indonesia, Germany, UK, France, Italy, Spain, Norway, Brazil, Argentina, Chile, Saudi Arabia, UAE, South Africa, Israel, Turkey

  • Exponential proliferation of low earth orbit satellite constellations is the driving factor this market.

The Satellite Ground Station Equipment market vendors should focus on grabbing business opportunities from the Type segment as it accounted for the largest market share in the base year.
RIA - Research AI Assistant
Ask RIA
