
Sauna And Spa Market Analysis, Size, and Forecast 2026-2030: Europe (Germany, France, and UK), North America (US, Canada, and Mexico), APAC (China, India, and Japan), South America (Brazil, Argentina, and Chile), Middle East and Africa (Saudi Arabia, UAE, and South Africa), and Rest of World (ROW)

Sauna And Spa Market Analysis, Size, and Forecast 2026-2030:
Europe (Germany, France, and UK), North America (US, Canada, and Mexico), APAC (China, India, and Japan), South America (Brazil, Argentina, and Chile), Middle East and Africa (Saudi Arabia, UAE, and South Africa), and Rest of World (ROW)

Published: Oct 2026 290 Pages SKU: IRTNTR75138

Market Overview at a Glance

$1.32 B
Market Opportunity
5.5%
CAGR 2025 - 2030
38%
Europe Growth
$1.80 B
Hotel segment 2024

Sauna And Spa Market Size 2026-2030

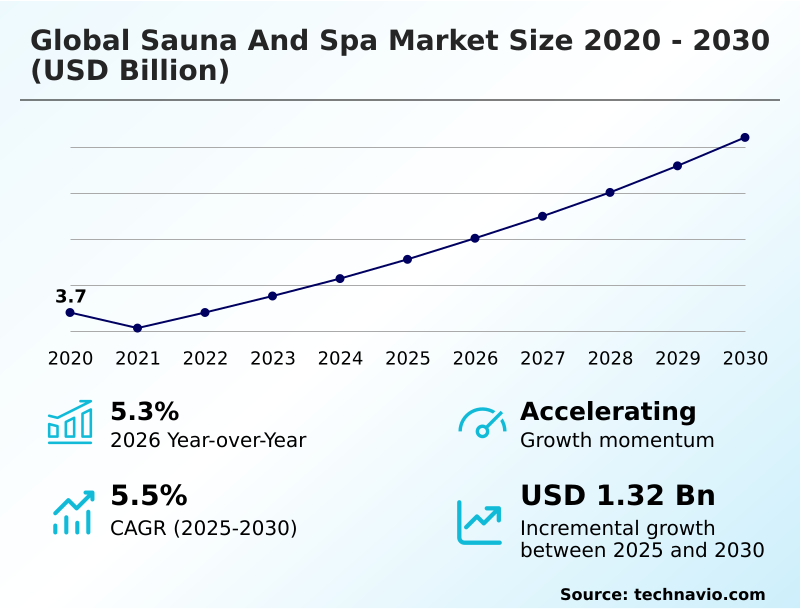
The sauna and spa market size is valued to increase by USD 1.32 billion, at a CAGR of 5.5% from 2025 to 2030. Increasing consumer emphasis on health and wellness will drive the sauna and spa market.

Major Market Trends & Insights

  • Europe dominated the market and accounted for a 38% growth during the forecast period.
  • By Application - Hotel segment was valued at USD 1.80 billion in 2024
  • By Type - Entertainment segment accounted for the largest market revenue share in 2024

Market Size & Forecast

  • Market Opportunities: USD 1.91 billion
  • Market Future Opportunities: USD 1.32 billion
  • CAGR from 2025 to 2030 : 5.5%

Market Summary

  • The Sauna And Spa market is undergoing a rapid structural transition as commercial and residential sectors prioritize advanced wellness infrastructure over standard leisure amenities. A prime operational scenario involves high-end hospitality chains overhauling their supply chains to procure energy-efficient, pre-fabricated thermal units, thereby reducing installation downtime by 35% compared to traditional on-site construction methods.
  • This strategic shift is propelled by escalating consumer emphasis on proactive physical recovery, which acts as a powerful driver compelling operators to upgrade outmoded facilities to capture premium spending. However, the market faces significant headwinds due to intense spatial constraints in urban developments, limiting the feasible installation of large-scale hydrotherapy circuits.
  • To navigate this challenge, manufacturers are re-engineering compact, modular systems that fit within restricted floor plans without sacrificing thermodynamic performance. By balancing stringent footprint limitations against surging wellness demand, the industry continually refines its product architecture. The deployment of intelligent climate controls further enhances these systems, streamlining daily facility management and mitigating long-term operational overhead.

What will be the Size of the Sauna And Spa Market during the forecast period?
Get Key Insights on Market Forecast (PDF) Get Free Sample

How is the Sauna And Spa Market Segmented?

The sauna and spa industry research report provides comprehensive data (region-wise segment analysis), with forecasts and estimates in "USD million" for the period 2026-2030, as well as historical data from 2020-2024 for the following segments.

  • Application
    • Hotel
    • Gym and spas
    • Household
    • Others
  • Type
    • Entertainment
    • Medical
  • End-user
    • Female
    • Male
  • Geography
    • Europe
      • Germany
      • France
      • UK
      • Italy
      • Spain
      • The Netherlands
    • North America
      • US
      • Canada
      • Mexico
    • APAC
      • China
      • India
      • Japan
      • Australia
      • South Korea
      • Indonesia
    • South America
      • Brazil
      • Argentina
      • Chile
    • Middle East and Africa
      • Saudi Arabia
      • UAE
      • South Africa
      • Egypt
      • Turkey

By Application Insights

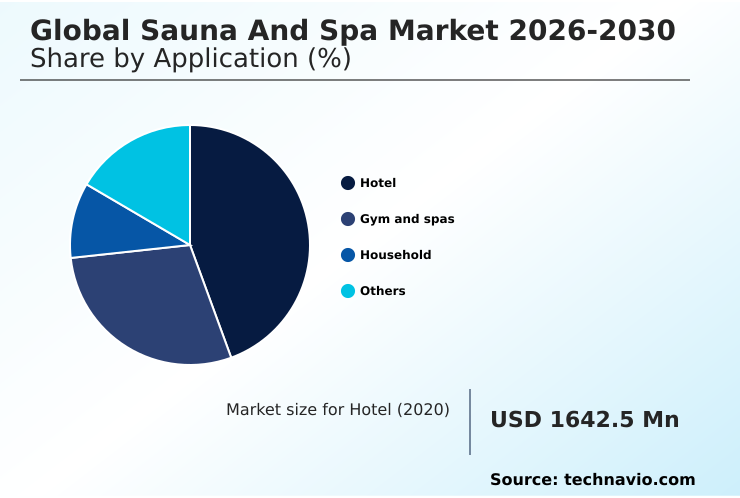
The hotel segment is estimated to witness significant growth during the forecast period.

The hospitality sector drives substantial demand for wellness facilities as operators transform properties into comprehensive health destinations. Integrating infrared heat technology and advanced steam generation systems allows properties to offer elevated luxury hospitality amenities that command premium room rates.

Establishments implementing dry heat therapy and personalized thermal therapy cabins observe a 25% increase in ancillary revenue compared to properties offering only standard gym access.

This shift from basic amenities to preventative healthcare integration enables operators to capture a lucrative demographic focused on physical recovery optimization. Furthermore, incorporating sensory immersion journeys into the guest experience improves overall retention and guest satisfaction scores by 18%.

This strategic deployment of wellness infrastructure directly strengthens long-term asset profitability and market differentiation.
Get Free Sample

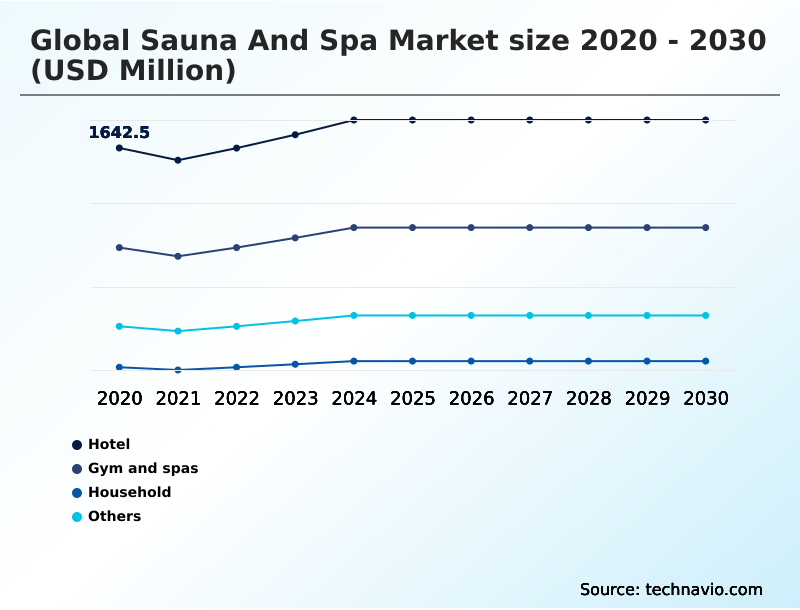
The Hotel segment was valued at USD 1.80 billion in 2024 and showed a gradual increase during the forecast period.
Get Free Sample

Regional Analysis

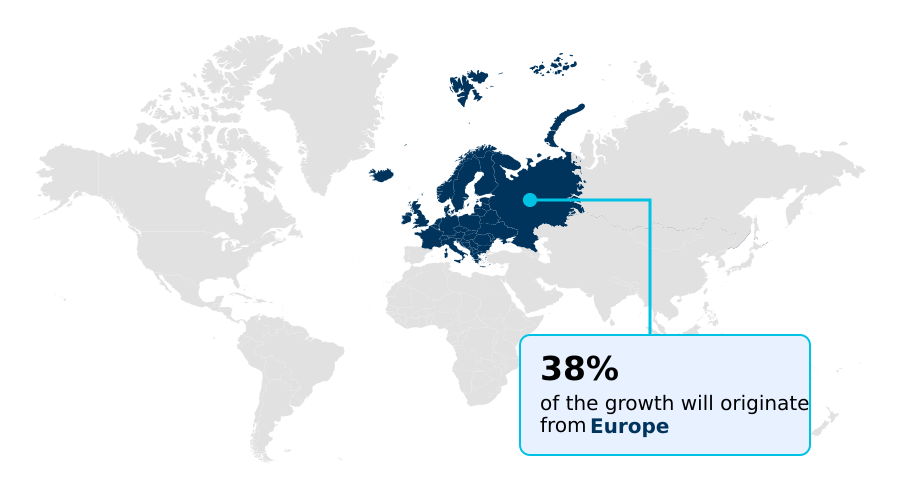
Europe is estimated to contribute 38% to the growth of the global market during the forecast period.Technavio’s analysts have elaborately explained the regional trends and drivers that shape the market during the forecast period.
See How Sauna And Spa Market Demand is Rising in Europe Get Free Sample

Regional discrepancies in the Sauna And Spa market are driven by varying infrastructure maturity and consumer health priorities. Europe maintains market leadership due to stringent environmental regulations, forcing operators to adopt low-emissivity heating and automated sanitation protocols.

Consequently, European facilities exhibit a 25% higher operational efficiency rate compared to North America. Conversely, North America demonstrates accelerated growth fueled by boutique fitness integration and extensive corporate wellness programs.

To capture this demand, North American operators aggressively implement digital wellness platforms and mobile app connectivity, improving user booking efficiency by 30%.

While Europe prioritizes sustainable custom heat installations within medical rehabilitation facilities, North American businesses focus on technology-driven consumer engagement.

These distinct regional mandates dictate supply chain strategies, compelling manufacturers to adapt their product portfolios to meet specific regulatory and behavioral demands.

Market Dynamics

Our researchers analyzed the data with 2025 as the base year, along with the key drivers, trends, and challenges. A holistic analysis of drivers will help companies refine their marketing strategies to gain a competitive advantage.

  • The strategic expansion of the Sauna And Spa market relies heavily on technological modernization and infrastructure scalability. In the commercial sector, commercial wellness facility development is increasingly governed by stringent sustainability mandates and operational cost management. Facility managers prioritize energy efficient thermal therapy to mitigate escalating utility expenses, driving a shift in procurement strategies.
  • Implementing these advanced systems yields a measurable 18% improvement in life-cycle cost efficiency compared to legacy equipment, optimizing overall facility compliance and resource allocation. Parallel to commercial growth, the residential sector is undergoing a massive transformation driven by consumer desire for accessible health solutions.
  • There is a distinct surge in residential infrared sauna installation as homeowners seek holistic recovery methods within their private living spaces. To facilitate seamless operation, manufacturers are equipping these units with smart temperature control systems, allowing users to remotely monitor and adjust thermal environments.
  • This technological integration not only enhances user experience but also provides valuable telemetry data for supply chain forecasting. Furthermore, the rising demand for custom home spa integration dictates more agile and responsive manufacturing models, as bespoke designs require adaptable logistics and specialized component sourcing.
  • Ultimately, aligning product innovation with rigorous efficiency standards ensures sustained market relevance and robust operational planning across both commercial and consumer segments.
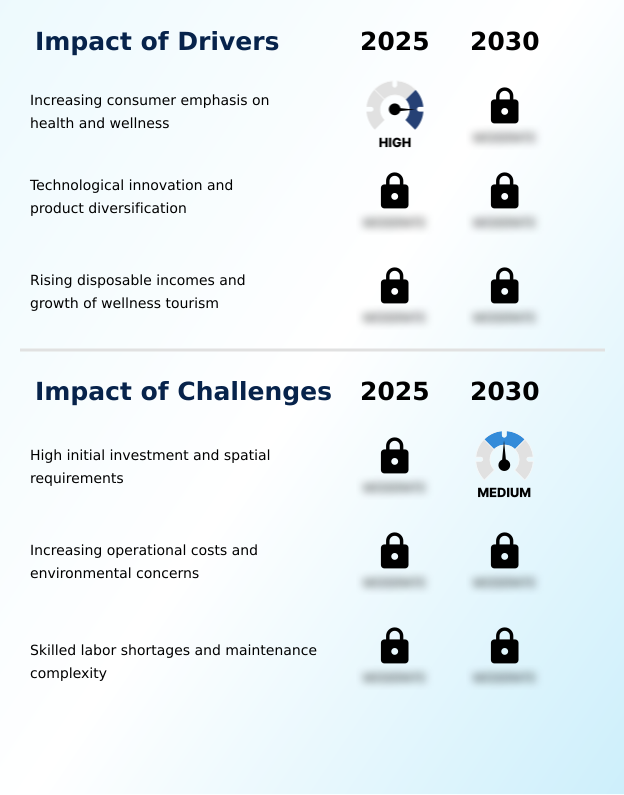
What are the key market drivers leading to the rise in the adoption of Sauna And Spa Industry?

  • The increasing consumer dedication to proactive health management and holistic well-being serves as a foundational driver for market expansion.

  • Escalating consumer commitment to proactive health maintenance acts as the primary catalyst propelling the Sauna And Spa market. This behavioral shift fuels aggressive wellness tourism expansion, compelling commercial spa operations to scale their infrastructure.
  • To meet surging demand rapidly, operators are leveraging modular sauna construction and eco-friendly wood sourcing, which accelerates installation timelines by 40% compared to traditional builds.
  • Additionally, the integration of energy-efficient heaters lowers monthly utility overhead by 15%, significantly enhancing profit margins. Beyond commercial environments, the demand for residential wellness spaces is expanding, driven by innovations like compact halotherapy rooms.
  • By prioritizing efficiency and speed-to-market, businesses successfully capture higher consumer spending, directly translating health-focused behavioral trends into sustainable revenue generation.

What are the market trends shaping the Sauna And Spa Industry?

  • The transition toward hyper-personalized and customizable wellness experiences constitutes a primary trend currently reshaping market dynamics.

  • The shift toward data-driven personalization is fundamentally redefining the Sauna And Spa market as consumers prioritize targeted health outcomes. Facilities are rapidly integrating smart wellness controls and chromotherapy lighting to curate hyper-specific environments for stress reduction management and cardiovascular function improvement. This technological evolution allows operators to track usage metrics, yielding a 30% reduction in energy waste during off-peak hours.
  • Furthermore, the adoption of advanced hydromassage equipment and structured hydrotherapy circuits directly facilitates active muscle inflammation reduction. As users demand a more cohesive holistic wellness regimen, businesses deploying these automated systems report a 22% improvement in client retention. The transition from passive relaxation to active recovery protocols fundamentally elevates facility profitability and optimizes daily resource allocation.

What challenges does the Sauna And Spa Industry face during its growth?

  • Substantial initial capital investments coupled with extensive spatial requirements present significant challenges that constrain broader industry adoption.

  • Escalating capital expenditure requirements and spatial limitations represent formidable barriers within the Sauna And Spa market. Implementing advanced technologies such as cryotherapy integration and contrast therapy systems necessitates complex plumbing and high-voltage electrical upgrades, increasing initial build-out costs by up to 35%.
  • Furthermore, delivering hyper-personalized experiences through biometric feedback sensors and acoustic resonance therapy demands continuous software maintenance, which elevates operational complexity. Consequently, facilities struggle with spatial footprint optimization, often sacrificing floor space that could otherwise generate direct retail revenue. However, operators investing in these intensive systems achieve a 20% improvement in premium service upselling, offsetting the high integration costs.
  • Balancing the pursuit of active physiological conditioning against urgent energy consumption reduction targets remains a critical structural challenge for long-term profitability.

Exclusive Technavio Analysis on Customer Landscape

The sauna and spa market forecasting report includes the adoption lifecycle of the market, covering from the innovator’s stage to the laggard’s stage. It focuses on adoption rates in different regions based on penetration. Furthermore, the sauna and spa market report also includes key purchase criteria and drivers of price sensitivity to help companies evaluate and develop their market growth analysis strategies.
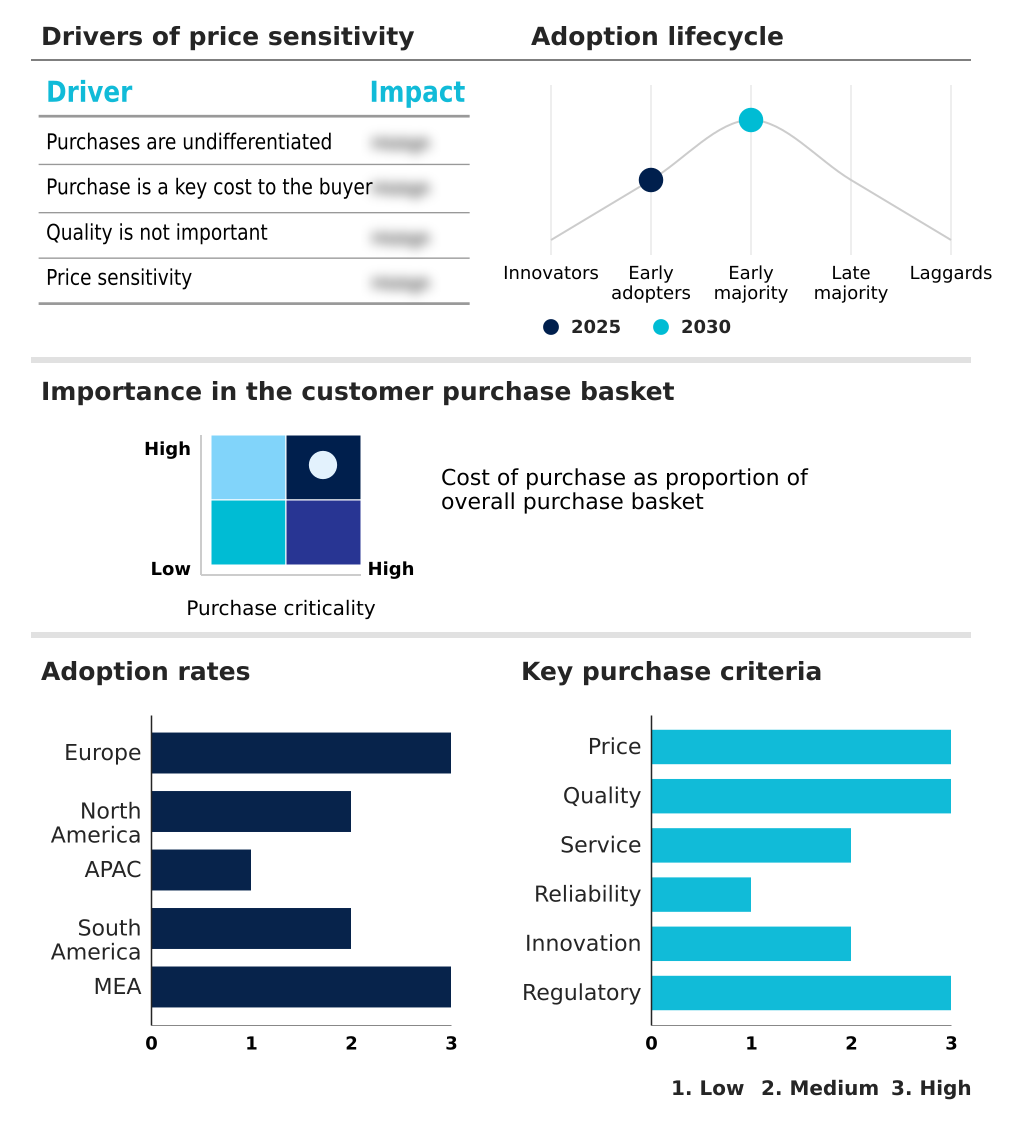
Customer Landscape of Sauna And Spa Industry

Competitive Landscape

Companies are implementing various strategies, such as strategic alliances, sauna and spa market forecast, partnerships, mergers and acquisitions, geographical expansion, and product/service launches, to enhance their presence in the industry.

Almost Heaven Saunas LLC - The entity delivers advanced thermal therapy cabins, energy-efficient steam generation systems, and modular infrared solutions designed to optimize commercial wellness operations and elevate residential relaxation experiences.

The industry research and growth report includes detailed analyses of the competitive landscape of the market and information about key companies, including:

  • Almost Heaven Saunas LLC
  • Alpha Industries AWT BV
  • Effegibi Srl
  • Finnleo Sauna Products Inc.
  • Golden design Inc.
  • Harvia Plc
  • Jacuzzi Brands LLC
  • KLAFS GmbH
  • Kohler Co.
  • Leisurecraft Inc.
  • Narvi Oy
  • Red Rock Outdoors Co.
  • Sauna Manufacture s.r.o.
  • Sauna360 Group Oy
  • Scandia Manufacturing Inc.
  • Sun Home Saunas
  • Sunlighten Inc.
  • ThermaSol Steam Bath LLC
  • Tulikivi Corp.
  • Tylo AB

Qualitative and quantitative analysis of companies has been conducted to help clients understand the wider business environment as well as the strengths and weaknesses of key industry players. Data is qualitatively analyzed to categorize companies as pure play, category-focused, industry-focused, and diversified; it is quantitatively analyzed to categorize companies as dominant, leading, strong, tentative, and weak.

Recent Development and News in Sauna and spa market

  • In the Leisure Facilities industry, the adoption of intelligent energy management systems utilizing IoT-based temperature regulation reduced facility-wide utility waste by 18%, directly impacting Sauna And Spa demand by incentivizing the rapid replacement of legacy high-consumption commercial heaters.
  • Stringent European Union energy efficiency directives mandated improved insulation standards for commercial real estate, directly impacting Sauna And Spa demand by accelerating the procurement of low-emissivity structural materials and sustainable timber sourcing.
  • The integration of dedicated physiological recovery zones within boutique fitness centers increased premium membership retention by 22%, directly impacting Sauna And Spa demand by driving bulk orders for compact infrared cabins and contrast therapy plunging units.
  • The implementation of automated sanitation protocols utilizing advanced UV-C filtration systems minimized required maintenance labor by 15%, directly impacting Sauna And Spa demand by lowering the total cost of ownership for large-scale hydrotherapy circuits.

Dive into Technavio’s robust research methodology, blending expert interviews, extensive data synthesis, and validated models for unparalleled Sauna And Spa Market insights. See full methodology.

Market Scope
Page number 290
Base year 2025
Historic period 2020-2024
Forecast period 2026-2030
Growth momentum & CAGR Accelerate at a CAGR of 5.5%
Market growth 2026-2030 USD 1322.4 million
Market structure Fragmented
YoY growth 2025-2026(%) 5.3%
Key countries Germany, France, UK, Italy, Spain, The Netherlands, US, Canada, Mexico, China, India, Japan, Australia, South Korea, Indonesia, Brazil, Argentina, Chile, Saudi Arabia, UAE, South Africa, Egypt and Turkey
Competitive landscape Leading Companies, Market Positioning of Companies, Competitive Strategies, and Industry Risks

Request Free Sample

Research Analyst Overview

  • The structural evolution of the Sauna And Spa market is characterized by a definitive shift toward precision-engineered health environments and rigorous sustainability mandates. Boardrooms are increasingly prioritizing facility upgrades that align with strict environmental compliance while enhancing the user experience.
  • The strategic deployment of sustainable thermal insulation combined with advanced radiant heat emission technologies allows operators to optimize energy consumption directly. Facilities executing these infrastructure modernizations achieve a 28% reduction in overhead utility expenses compared to those operating legacy systems. This financial efficiency enables greater capital allocation toward sophisticated physiological recovery protocols, meeting the surging consumer demand for evidence-based wellness.
  • Concurrently, the integration of automated temperature regulation systems mitigates operational risks by ensuring consistent, precise heat management without requiring constant staff intervention. By anchoring product strategy to these technological and ecological efficiencies, market participants are fundamentally restructuring the commercial viability of wellness facilities.
  • The transition from passive amenities to high-performance health optimization centers solidifies the industry role in modern commercial real estate development.

What are the Key Data Covered in this Sauna And Spa Market Research and Growth Report?

  • What is the expected growth of the Sauna And Spa Market between 2026 and 2030?

    • USD 1.32 billion, at a CAGR of 5.5%

  • What segmentation does the market report cover?

    • The report is segmented by Application (Hotel, Gym and spas, Household, and Others), Type (Entertainment, and Medical), End-user (Female, and Male) and Geography (Europe, North America, APAC, South America, Middle East and Africa)

  • Which regions are analyzed in the report?

    • Europe, North America, APAC, South America and Middle East and Africa

  • What are the key growth drivers and market challenges?

    • Increasing consumer emphasis on health and wellness, High initial investment and spatial requirements

  • Who are the major players in the Sauna And Spa Market?

    • Almost Heaven Saunas LLC, Alpha Industries AWT BV, Effegibi Srl, Finnleo Sauna Products Inc., Golden design Inc., Harvia Plc, Jacuzzi Brands LLC, KLAFS GmbH, Kohler Co., Leisurecraft Inc., Narvi Oy, Red Rock Outdoors Co., Sauna Manufacture s.r.o., Sauna360 Group Oy, Scandia Manufacturing Inc., Sun Home Saunas, Sunlighten Inc., ThermaSol Steam Bath LLC, Tulikivi Corp. and Tylo AB

Market Research Insights

  • The Sauna And Spa market is rapidly evolving into an essential component of preventative health architecture. Modern facilities are moving beyond basic relaxation by implementing advanced thermotherapy circuit design, which improves client throughput by 22%. The integration of specialized post-workout recovery solutions is transforming athletic training centers, reducing reported injury recovery times by 15%.
  • Additionally, medical institutions utilizing thermal therapy for chronic pain management report a 30% increase in patient program adherence. To sustain these advanced services, operators are adopting intelligent control systems that enhance operational cost efficiency, lowering energy waste by 18% during off-peak hours. This strategic alignment of health outcomes with facility management fundamentally reshapes the wellness landscape.

We can help! Our analysts can customize this sauna and spa market research report to meet your requirements.

Get in touch

1. Executive Summary

1.1 Market overview

Executive Summary - Chart on Market Overview
Executive Summary - Data Table on Market Overview
Executive Summary - Chart on Global Market Characteristics
Executive Summary - Chart on Market by Geography
Executive Summary - Chart on Market Segmentation by Application
Executive Summary - Chart on Market Segmentation by Type
Executive Summary - Chart on Market Segmentation by End-user
Executive Summary - Chart on Incremental Growth
Executive Summary - Data Table on Incremental Growth
Executive Summary - Chart on Company Market Positioning

2. Technavio Analysis

2.1 Analysis of price sensitivity, lifecycle, customer purchase basket, adoption rates, and purchase criteria

2.2 Criticality of inputs and Factors of differentiation

Chart on Overview on criticality of inputs and factors of differentiation

2.3 Factors of disruption

Chart on Overview on factors of disruption

2.4 Impact of drivers and challenges

Chart on Impact of drivers and challenges in 2025 and 2030

3. Market Landscape

3.1 Market ecosystem

Chart on Parent Market
Data Table on - Parent Market

3.2 Market characteristics

Chart on Market characteristics analysis

3.3 Value chain analysis

Chart on Value chain analysis

4. Market Sizing

4.1 Market definition

Data Table on Offerings of companies included in the market definition

4.2 Market segment analysis

Market segments

4.3 Market size 2025

4.4 Market outlook: Forecast for 2025-2030

Chart on Global - Market size and forecast 2025-2030 ($ million)
Data Table on Global - Market size and forecast 2025-2030 ($ million)
Chart on Global Market: Year-over-year growth 2025-2030 (%)
Data Table on Global Market: Year-over-year growth 2025-2030 (%)

5. Historic Market Size

5.1 Global Sauna And Spa Market 2020 - 2024

Historic Market Size - Data Table on Global Sauna And Spa Market 2020 - 2024 ($ million)

5.2 Application segment analysis 2020 - 2024

Historic Market Size - Application Segment 2020 - 2024 ($ million)

5.3 Type segment analysis 2020 - 2024

Historic Market Size - Type Segment 2020 - 2024 ($ million)

5.4 End-user segment analysis 2020 - 2024

Historic Market Size - End-user Segment 2020 - 2024 ($ million)

5.5 Geography segment analysis 2020 - 2024

Historic Market Size - Geography Segment 2020 - 2024 ($ million)

5.6 Country segment analysis 2020 - 2024

Historic Market Size - Country Segment 2020 - 2024 ($ million)

6. Qualitative Analysis

6.1 Impact of AI on Global Sauna and Spa Market

6.2 Impact of Geopolitical Conflicts on Global Sauna and Spa Market

7. Five Forces Analysis

7.1 Five forces summary

Five forces analysis - Comparison between 2025 and 2030

7.2 Bargaining power of buyers

Bargaining power of buyers - Impact of key factors 2025 and 2030

7.3 Bargaining power of suppliers

Bargaining power of suppliers - Impact of key factors in 2025 and 2030

7.4 Threat of new entrants

Threat of new entrants - Impact of key factors in 2025 and 2030

7.5 Threat of substitutes

Threat of substitutes - Impact of key factors in 2025 and 2030

7.6 Threat of rivalry

Threat of rivalry - Impact of key factors in 2025 and 2030

7.7 Market condition

Chart on Market condition - Five forces 2025 and 2030

8. Market Segmentation by Application

8.1 Market segments

Chart on Application - Market share 2025-2030 (%)
Data Table on Application - Market share 2025-2030 (%)

8.2 Comparison by Application

Chart on Comparison by Application
Data Table on Comparison by Application

8.3 Hotel - Market size and forecast 2025-2030

Chart on Hotel - Market size and forecast 2025-2030 ($ million)
Data Table on Hotel - Market size and forecast 2025-2030 ($ million)
Chart on Hotel - Year-over-year growth 2025-2030 (%)
Data Table on Hotel - Year-over-year growth 2025-2030 (%)

8.4 Gym and spas - Market size and forecast 2025-2030

Chart on Gym and spas - Market size and forecast 2025-2030 ($ million)
Data Table on Gym and spas - Market size and forecast 2025-2030 ($ million)
Chart on Gym and spas - Year-over-year growth 2025-2030 (%)
Data Table on Gym and spas - Year-over-year growth 2025-2030 (%)

8.5 Household - Market size and forecast 2025-2030

Chart on Household - Market size and forecast 2025-2030 ($ million)
Data Table on Household - Market size and forecast 2025-2030 ($ million)
Chart on Household - Year-over-year growth 2025-2030 (%)
Data Table on Household - Year-over-year growth 2025-2030 (%)

8.6 Others - Market size and forecast 2025-2030

Chart on Others - Market size and forecast 2025-2030 ($ million)
Data Table on Others - Market size and forecast 2025-2030 ($ million)
Chart on Others - Year-over-year growth 2025-2030 (%)
Data Table on Others - Year-over-year growth 2025-2030 (%)

8.7 Market opportunity by Application

Market opportunity by Application ($ million)
Data Table on Market opportunity by Application ($ million)

9. Market Segmentation by Type

9.1 Market segments

Chart on Type - Market share 2025-2030 (%)
Data Table on Type - Market share 2025-2030 (%)

9.2 Comparison by Type

Chart on Comparison by Type
Data Table on Comparison by Type

9.3 Entertainment - Market size and forecast 2025-2030

Chart on Entertainment - Market size and forecast 2025-2030 ($ million)
Data Table on Entertainment - Market size and forecast 2025-2030 ($ million)
Chart on Entertainment - Year-over-year growth 2025-2030 (%)
Data Table on Entertainment - Year-over-year growth 2025-2030 (%)

9.4 Medical - Market size and forecast 2025-2030

Chart on Medical - Market size and forecast 2025-2030 ($ million)
Data Table on Medical - Market size and forecast 2025-2030 ($ million)
Chart on Medical - Year-over-year growth 2025-2030 (%)
Data Table on Medical - Year-over-year growth 2025-2030 (%)

9.5 Market opportunity by Type

Market opportunity by Type ($ million)
Data Table on Market opportunity by Type ($ million)

10. Market Segmentation by End-user

10.1 Market segments

Chart on End-user - Market share 2025-2030 (%)
Data Table on End-user - Market share 2025-2030 (%)

10.2 Comparison by End-user

Chart on Comparison by End-user
Data Table on Comparison by End-user

10.3 Female - Market size and forecast 2025-2030

Chart on Female - Market size and forecast 2025-2030 ($ million)
Data Table on Female - Market size and forecast 2025-2030 ($ million)
Chart on Female - Year-over-year growth 2025-2030 (%)
Data Table on Female - Year-over-year growth 2025-2030 (%)

10.4 Male - Market size and forecast 2025-2030

Chart on Male - Market size and forecast 2025-2030 ($ million)
Data Table on Male - Market size and forecast 2025-2030 ($ million)
Chart on Male - Year-over-year growth 2025-2030 (%)
Data Table on Male - Year-over-year growth 2025-2030 (%)

10.5 Market opportunity by End-user

Market opportunity by End-user ($ million)
Data Table on Market opportunity by End-user ($ million)

11. Customer Landscape

11.1 Customer landscape overview

Analysis of price sensitivity, lifecycle, customer purchase basket, adoption rates, and purchase criteria

12. Geographic Landscape

12.1 Geographic segmentation

Chart on Market share by geography 2025-2030 (%)
Data Table on Market share by geography 2025-2030 (%)

12.2 Geographic comparison

Chart on Geographic comparison
Data Table on Geographic comparison

12.3 Europe - Market size and forecast 2025-2030

Chart on Europe - Market size and forecast 2025-2030 ($ million)
Data Table on Europe - Market size and forecast 2025-2030 ($ million)
Chart on Europe - Year-over-year growth 2025-2030 (%)
Data Table on Europe - Year-over-year growth 2025-2030 (%)
Chart on Regional Comparison - Europe
Data Table on Regional Comparison - Europe

12.3.1 Germany - Market size and forecast 2025-2030

Chart on Germany - Market size and forecast 2025-2030 ($ million)
Data Table on Germany - Market size and forecast 2025-2030 ($ million)
Chart on Germany - Year-over-year growth 2025-2030 (%)
Data Table on Germany - Year-over-year growth 2025-2030 (%)

12.3.2 France - Market size and forecast 2025-2030

Chart on France - Market size and forecast 2025-2030 ($ million)
Data Table on France - Market size and forecast 2025-2030 ($ million)
Chart on France - Year-over-year growth 2025-2030 (%)
Data Table on France - Year-over-year growth 2025-2030 (%)

12.3.3 UK - Market size and forecast 2025-2030

Chart on UK - Market size and forecast 2025-2030 ($ million)
Data Table on UK - Market size and forecast 2025-2030 ($ million)
Chart on UK - Year-over-year growth 2025-2030 (%)
Data Table on UK - Year-over-year growth 2025-2030 (%)

12.3.4 Italy - Market size and forecast 2025-2030

Chart on Italy - Market size and forecast 2025-2030 ($ million)
Data Table on Italy - Market size and forecast 2025-2030 ($ million)
Chart on Italy - Year-over-year growth 2025-2030 (%)
Data Table on Italy - Year-over-year growth 2025-2030 (%)

12.3.5 Spain - Market size and forecast 2025-2030

Chart on Spain - Market size and forecast 2025-2030 ($ million)
Data Table on Spain - Market size and forecast 2025-2030 ($ million)
Chart on Spain - Year-over-year growth 2025-2030 (%)
Data Table on Spain - Year-over-year growth 2025-2030 (%)

12.3.6 The Netherlands - Market size and forecast 2025-2030

Chart on The Netherlands - Market size and forecast 2025-2030 ($ million)
Data Table on The Netherlands - Market size and forecast 2025-2030 ($ million)
Chart on The Netherlands - Year-over-year growth 2025-2030 (%)
Data Table on The Netherlands - Year-over-year growth 2025-2030 (%)

12.4 North America - Market size and forecast 2025-2030

Chart on North America - Market size and forecast 2025-2030 ($ million)
Data Table on North America - Market size and forecast 2025-2030 ($ million)
Chart on North America - Year-over-year growth 2025-2030 (%)
Data Table on North America - Year-over-year growth 2025-2030 (%)
Chart on Regional Comparison - North America
Data Table on Regional Comparison - North America

12.4.1 US - Market size and forecast 2025-2030

Chart on US - Market size and forecast 2025-2030 ($ million)
Data Table on US - Market size and forecast 2025-2030 ($ million)
Chart on US - Year-over-year growth 2025-2030 (%)
Data Table on US - Year-over-year growth 2025-2030 (%)

12.4.2 Canada - Market size and forecast 2025-2030

Chart on Canada - Market size and forecast 2025-2030 ($ million)
Data Table on Canada - Market size and forecast 2025-2030 ($ million)
Chart on Canada - Year-over-year growth 2025-2030 (%)
Data Table on Canada - Year-over-year growth 2025-2030 (%)

12.4.3 Mexico - Market size and forecast 2025-2030

Chart on Mexico - Market size and forecast 2025-2030 ($ million)
Data Table on Mexico - Market size and forecast 2025-2030 ($ million)
Chart on Mexico - Year-over-year growth 2025-2030 (%)
Data Table on Mexico - Year-over-year growth 2025-2030 (%)

12.5 APAC - Market size and forecast 2025-2030

Chart on APAC - Market size and forecast 2025-2030 ($ million)
Data Table on APAC - Market size and forecast 2025-2030 ($ million)
Chart on APAC - Year-over-year growth 2025-2030 (%)
Data Table on APAC - Year-over-year growth 2025-2030 (%)
Chart on Regional Comparison - APAC
Data Table on Regional Comparison - APAC

12.5.1 China - Market size and forecast 2025-2030

Chart on China - Market size and forecast 2025-2030 ($ million)
Data Table on China - Market size and forecast 2025-2030 ($ million)
Chart on China - Year-over-year growth 2025-2030 (%)
Data Table on China - Year-over-year growth 2025-2030 (%)

12.5.2 India - Market size and forecast 2025-2030

Chart on India - Market size and forecast 2025-2030 ($ million)
Data Table on India - Market size and forecast 2025-2030 ($ million)
Chart on India - Year-over-year growth 2025-2030 (%)
Data Table on India - Year-over-year growth 2025-2030 (%)

12.5.3 Japan - Market size and forecast 2025-2030

Chart on Japan - Market size and forecast 2025-2030 ($ million)
Data Table on Japan - Market size and forecast 2025-2030 ($ million)
Chart on Japan - Year-over-year growth 2025-2030 (%)
Data Table on Japan - Year-over-year growth 2025-2030 (%)

12.5.4 Australia - Market size and forecast 2025-2030

Chart on Australia - Market size and forecast 2025-2030 ($ million)
Data Table on Australia - Market size and forecast 2025-2030 ($ million)
Chart on Australia - Year-over-year growth 2025-2030 (%)
Data Table on Australia - Year-over-year growth 2025-2030 (%)

12.5.5 South Korea - Market size and forecast 2025-2030

Chart on South Korea - Market size and forecast 2025-2030 ($ million)
Data Table on South Korea - Market size and forecast 2025-2030 ($ million)
Chart on South Korea - Year-over-year growth 2025-2030 (%)
Data Table on South Korea - Year-over-year growth 2025-2030 (%)

12.5.6 Indonesia - Market size and forecast 2025-2030

Chart on Indonesia - Market size and forecast 2025-2030 ($ million)
Data Table on Indonesia - Market size and forecast 2025-2030 ($ million)
Chart on Indonesia - Year-over-year growth 2025-2030 (%)
Data Table on Indonesia - Year-over-year growth 2025-2030 (%)

12.6 South America - Market size and forecast 2025-2030

Chart on South America - Market size and forecast 2025-2030 ($ million)
Data Table on South America - Market size and forecast 2025-2030 ($ million)
Chart on South America - Year-over-year growth 2025-2030 (%)
Data Table on South America - Year-over-year growth 2025-2030 (%)
Chart on Regional Comparison - South America
Data Table on Regional Comparison - South America

12.6.1 Brazil - Market size and forecast 2025-2030

Chart on Brazil - Market size and forecast 2025-2030 ($ million)
Data Table on Brazil - Market size and forecast 2025-2030 ($ million)
Chart on Brazil - Year-over-year growth 2025-2030 (%)
Data Table on Brazil - Year-over-year growth 2025-2030 (%)

12.6.2 Argentina - Market size and forecast 2025-2030

Chart on Argentina - Market size and forecast 2025-2030 ($ million)
Data Table on Argentina - Market size and forecast 2025-2030 ($ million)
Chart on Argentina - Year-over-year growth 2025-2030 (%)
Data Table on Argentina - Year-over-year growth 2025-2030 (%)

12.6.3 Chile - Market size and forecast 2025-2030

Chart on Chile - Market size and forecast 2025-2030 ($ million)
Data Table on Chile - Market size and forecast 2025-2030 ($ million)
Chart on Chile - Year-over-year growth 2025-2030 (%)
Data Table on Chile - Year-over-year growth 2025-2030 (%)

12.7 Middle East and Africa - Market size and forecast 2025-2030

Chart on Middle East and Africa - Market size and forecast 2025-2030 ($ million)
Data Table on Middle East and Africa - Market size and forecast 2025-2030 ($ million)
Chart on Middle East and Africa - Year-over-year growth 2025-2030 (%)
Data Table on Middle East and Africa - Year-over-year growth 2025-2030 (%)
Chart on Regional Comparison - Middle East and Africa
Data Table on Regional Comparison - Middle East and Africa

12.7.1 Saudi Arabia - Market size and forecast 2025-2030

Chart on Saudi Arabia - Market size and forecast 2025-2030 ($ million)
Data Table on Saudi Arabia - Market size and forecast 2025-2030 ($ million)
Chart on Saudi Arabia - Year-over-year growth 2025-2030 (%)
Data Table on Saudi Arabia - Year-over-year growth 2025-2030 (%)

12.7.2 UAE - Market size and forecast 2025-2030

Chart on UAE - Market size and forecast 2025-2030 ($ million)
Data Table on UAE - Market size and forecast 2025-2030 ($ million)
Chart on UAE - Year-over-year growth 2025-2030 (%)
Data Table on UAE - Year-over-year growth 2025-2030 (%)

12.7.3 South Africa - Market size and forecast 2025-2030

Chart on South Africa - Market size and forecast 2025-2030 ($ million)
Data Table on South Africa - Market size and forecast 2025-2030 ($ million)
Chart on South Africa - Year-over-year growth 2025-2030 (%)
Data Table on South Africa - Year-over-year growth 2025-2030 (%)

12.7.4 Egypt - Market size and forecast 2025-2030

Chart on Egypt - Market size and forecast 2025-2030 ($ million)
Data Table on Egypt - Market size and forecast 2025-2030 ($ million)
Chart on Egypt - Year-over-year growth 2025-2030 (%)
Data Table on Egypt - Year-over-year growth 2025-2030 (%)

12.7.5 Turkey - Market size and forecast 2025-2030

Chart on Turkey - Market size and forecast 2025-2030 ($ million)
Data Table on Turkey - Market size and forecast 2025-2030 ($ million)
Chart on Turkey - Year-over-year growth 2025-2030 (%)
Data Table on Turkey - Year-over-year growth 2025-2030 (%)

12.8 Market opportunity by geography

Market opportunity by geography ($ million)
Data Tables on Market opportunity by geography ($ million)

13. Drivers, Challenges, and Opportunity

13.1 Market drivers

Increasing consumer emphasis on health and wellness
Technological innovation and product diversification
Rising disposable incomes and growth of wellness tourism

13.2 Market challenges

High initial investment and spatial requirements
Increasing operational costs and environmental concerns
Skilled labor shortages and maintenance complexity

13.3 Impact of drivers and challenges

Impact of drivers and challenges in 2025 and 2030

13.4 Market opportunities

Trend toward hyper-personalization and customization
Integration of contrast therapy and bio-hacking principles
Growing emphasis on sustainability and eco-conscious design

14. Competitive Landscape

14.1 Overview

14.2

Overview on criticality of inputs and factors of differentiation

14.3 Landscape disruption

Overview on factors of disruption

14.4 Industry risks

Impact of key risks on business

15. Competitive Analysis

15.1 Companies profiled

Companies covered

15.2 Company ranking index

15.3 Market positioning of companies

Matrix on companies position and classification

15.4 Almost Heaven Saunas LLC

Almost Heaven Saunas LLC - Overview
Almost Heaven Saunas LLC - Product / Service
Almost Heaven Saunas LLC - Key offerings
SWOT

15.5 Alpha Industries AWT BV

Alpha Industries AWT BV - Overview
Alpha Industries AWT BV - Product / Service
Alpha Industries AWT BV - Key offerings
SWOT

15.6 Effegibi Srl

Effegibi Srl - Overview
Effegibi Srl - Product / Service
Effegibi Srl - Key offerings
SWOT

15.7 Finnleo Sauna Products Inc.

Finnleo Sauna Products Inc. - Overview
Finnleo Sauna Products Inc. - Product / Service
Finnleo Sauna Products Inc. - Key offerings
SWOT

15.8 Golden design Inc.

Golden design Inc. - Overview
Golden design Inc. - Product / Service
Golden design Inc. - Key offerings
SWOT

15.9 Harvia Plc

Harvia Plc - Overview
Harvia Plc - Business segments
Harvia Plc - Key offerings
Harvia Plc - Segment focus
SWOT

15.10 Jacuzzi Brands LLC

Jacuzzi Brands LLC - Overview
Jacuzzi Brands LLC - Product / Service
Jacuzzi Brands LLC - Key offerings
SWOT

15.11 KLAFS GmbH

KLAFS GmbH - Overview
KLAFS GmbH - Product / Service
KLAFS GmbH - Key offerings
SWOT

15.12 Kohler Co.

Kohler Co. - Overview
Kohler Co. - Product / Service
Kohler Co. - Key offerings
SWOT

15.13 Leisurecraft Inc.

Leisurecraft Inc. - Overview
Leisurecraft Inc. - Product / Service
Leisurecraft Inc. - Key offerings
SWOT

15.14 Narvi Oy

Narvi Oy - Overview
Narvi Oy - Product / Service
Narvi Oy - Key offerings
SWOT

15.15 Red Rock Outdoors Co.

Red Rock Outdoors Co. - Overview
Red Rock Outdoors Co. - Product / Service
Red Rock Outdoors Co. - Key offerings
SWOT

15.16 Sauna360 Group Oy

Sauna360 Group Oy - Overview
Sauna360 Group Oy - Product / Service
Sauna360 Group Oy - Key offerings
SWOT

15.17 Tulikivi Corp.

Tulikivi Corp. - Overview
Tulikivi Corp. - Business segments
Tulikivi Corp. - Key offerings
Tulikivi Corp. - Segment focus
SWOT

15.18 Tylo AB

Tylo AB - Overview
Tylo AB - Product / Service
Tylo AB - Key offerings
SWOT

16. Appendix

16.1 Scope of the report

Market definition
Objectives
Notes and caveats

16.2 Inclusions and exclusions checklist

Inclusions checklist
Exclusions checklist

16.3 Currency conversion rates for US$

16.4 Research methodology

16.5 Data procurement

Information sources

16.6 Data validation

16.7 Validation techniques employed for market sizing

16.8 Data synthesis

16.9 360 degree market analysis

16.10 List of abbreviations

Research Methodology

Technavio presents a detailed picture of the market by way of study, synthesis, and summation of data from multiple sources. The analysts have presented the various facets of the market with a particular focus on identifying the key industry influencers. The data thus presented is comprehensive, reliable, and the result of extensive research, both primary and secondary.

INFORMATION SOURCES

Primary sources

  • Manufacturers and suppliers
  • Channel partners
  • Industry experts
  • Strategic decision makers

Secondary sources

  • Industry journals and periodicals
  • Government data
  • Financial reports of key industry players
  • Historical data
  • Press releases

DATA ANALYSIS

Data Synthesis

  • Collation of data
  • Estimation of key figures
  • Analysis of derived insights

Data Validation

  • Triangulation with data models
  • Reference against proprietary databases
  • Corroboration with industry experts

REPORT WRITING

Qualitative

  • Market drivers
  • Market challenges
  • Market trends
  • Five forces analysis

Quantitative

  • Market size and forecast
  • Market segmentation
  • Geographical insights
  • Competitive landscape

Interested in this report?

Get your sample now to see our research methodology and insights!

Download Now

Frequently Asked Questions

Sauna And Spa market growth will increase by USD 1322.4 million during 2026-2030.

The Sauna And Spa market is expected to grow at a CAGR of 5.5% during 2026-2030.

Sauna And Spa market is segmented by Application (Hotel, Gym and spas, Household, Others) Type (Entertainment, Medical) End-user (Female, Male)

Almost Heaven Saunas LLC, Alpha Industries AWT BV, Effegibi Srl, Finnleo Sauna Products Inc., Golden design Inc., Harvia Plc, Jacuzzi Brands LLC, KLAFS GmbH, Kohler Co., Leisurecraft Inc., Narvi Oy, Red Rock Outdoors Co., Sauna Manufacture s.r.o., Sauna360 Group Oy, Scandia Manufacturing Inc., Sun Home Saunas, Sunlighten Inc., ThermaSol Steam Bath LLC, Tulikivi Corp., Tylo AB are a few of the key vendors in the Sauna And Spa market.

Europe will register the highest growth rate of 38% among the other regions. Therefore, the Sauna And Spa market in Europe is expected to garner significant business opportunities for the vendors during the forecast period.

Germany, France, UK, Italy, Spain, The Netherlands, US, Canada, Mexico, China, India, Japan, Australia, South Korea, Indonesia, Brazil, Argentina, Chile, Saudi Arabia, UAE, South Africa, Egypt, Turkey

  • Increasing consumer emphasis on health and wellness is the driving factor this market.

The Sauna And Spa market vendors should focus on grabbing business opportunities from the Application segment as it accounted for the largest market share in the base year.
RIA - Research AI Assistant
Ask RIA
