
Security Brokerage And Stock Exchange Services Market Analysis, Size, and Forecast 2026-2030: North America (US, Canada, and Mexico), APAC (China, Japan, and India), Europe (UK, Germany, and France), Middle East and Africa (Saudi Arabia, UAE, and South Africa), South America (Brazil, Argentina, and Chile), and Rest of World (ROW)

Security Brokerage And Stock Exchange Services Market Analysis, Size, and Forecast 2026-2030:
North America (US, Canada, and Mexico), APAC (China, Japan, and India), Europe (UK, Germany, and France), Middle East and Africa (Saudi Arabia, UAE, and South Africa), South America (Brazil, Argentina, and Chile), and Rest of World (ROW)

Published: Oct 2026 308 Pages SKU: IRTNTR75385

Market Overview at a Glance

$1032.8 B
Market Opportunity
10.2%
CAGR 2025 - 2030
35.3%
North America Growth
$1140.9 B
Offline segment 2024

Security Brokerage And Stock Exchange Services Market Size 2026-2030

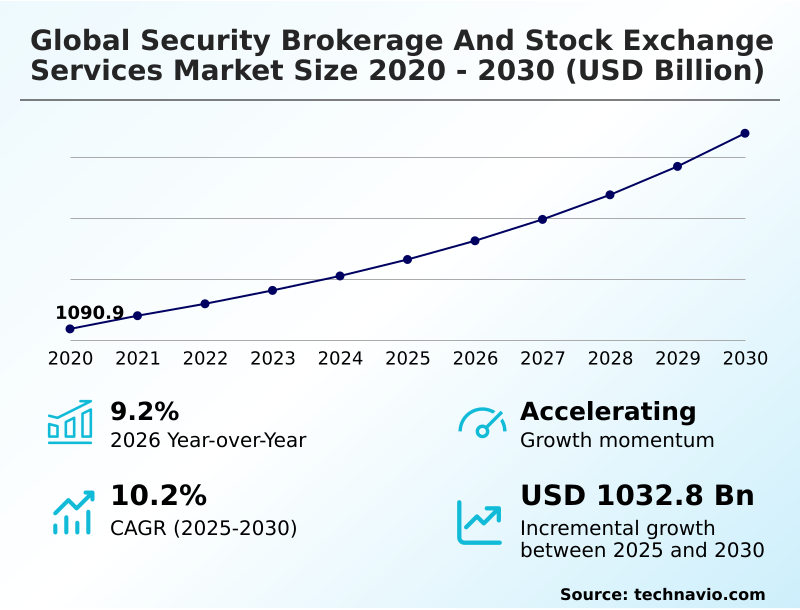
The security brokerage and stock exchange services market size is valued to increase by USD 1032.8 billion, at a CAGR of 10.2% from 2025 to 2030. Rise of alternative liquidity pools will drive the security brokerage and stock exchange services market.

Major Market Trends & Insights

  • North America dominated the market and accounted for a 35.3% growth during the forecast period.
  • By Channel - Offline segment was valued at USD 1140.9 billion in 2024
  • By Type - Derivatives and commodities brokerage segment accounted for the largest market revenue share in 2024

Market Size & Forecast

  • Market Opportunities: USD 1600.6 billion
  • Market Future Opportunities: USD 1032.8 billion
  • CAGR from 2025 to 2030 : 10.2%

Market Summary

  • The Security Brokerage And Stock Exchange Services market exhibits robust operational modernization as traditional financial intermediaries continuously optimize their electronic matching engines to handle unprecedented daily transaction volumes. Firms increasingly deploy hybrid connectivity solutions linking central order books with off exchange private execution venues.
  • For instance, institutional clearing houses have redesigned their margin calculation workflows, deploying real time collateral monitoring tools that reduce intraday margin call processing times by 25% compared to legacy overnight batch systems. This structural enhancement drastically improves overall capital efficiency.
  • The acceleration of cross border trading activity acts as a critical strategic driver, compelling stock exchanges to establish multi currency account frameworks that facilitate seamless foreign equity investments. Conversely, escalating cybersecurity vulnerabilities present a formidable challenge.
  • Malicious actors deploying advanced ransomware frequently target centralized trade repositories, causing operational disruptions that force brokerages to divert 15% of their annual technology budgets strictly toward multilayered threat detection architectures. Balancing these aggressive cross border expansion initiatives against stringent domestic data sovereignty mandates remains the central strategic imperative for market operators.

What will be the Size of the Security Brokerage And Stock Exchange Services Market during the forecast period?
Get Key Insights on Market Forecast (PDF) Get Free Sample

How is the Security Brokerage And Stock Exchange Services Market Segmented?

The security brokerage and stock exchange services industry research report provides comprehensive data (region-wise segment analysis), with forecasts and estimates in "USD billion" for the period 2026-2030, as well as historical data from 2020-2024 for the following segments.

  • Channel
    • Offline
    • Online
  • Type
    • Derivatives and commodities brokerage
    • Equities brokerage
    • Bonds brokerage
    • Stock exchanges
    • Others
  • Source
    • Banks
    • Investment firms
    • Exclusive brokers
  • Geography
    • North America
      • US
      • Canada
      • Mexico
    • APAC
      • China
      • Japan
      • India
      • South Korea
      • Australia
      • Indonesia
    • Europe
      • UK
      • Germany
      • France
      • Italy
      • Spain
      • The Netherlands
    • Middle East and Africa
      • Saudi Arabia
      • UAE
      • South Africa
      • Israel
      • Turkey
    • South America
      • Brazil
      • Argentina
      • Chile

By Channel Insights

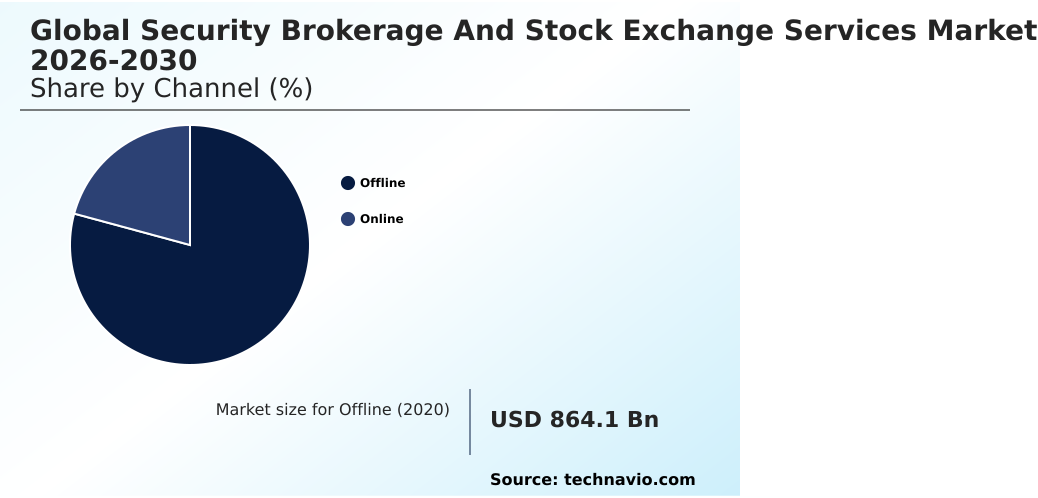
The offline segment is estimated to witness significant growth during the forecast period.

Traditional advisory channels maintain structural relevance by facilitating complex structured block trades for high net worth clients and institutional entities navigating a fragmented liquidity landscape.

Dedicated human brokers leverage algorithmic execution engines and smart order routing to execute large scale capital deployments while minimizing market signaling. This approach reduces execution slippage by 15% compared to self directed platforms.

Advisory personnel ensure strict adherence to fiduciary standards, mitigating cross border operational risk during international asset transfers.

As zero commission trading structures dominate digital platforms, relationship driven intermediaries integrate automated risk management systems and execution management systems to optimize client portfolios.

Firms utilizing these hybrid advisory frameworks report a 20% improvement in client retention during volatile market cycles.

Accessing dark pool liquidity and ensuring post trade transparency remain critical, empowering traditional brokerages to outcompete alternative execution venues by providing irreplaceable interpersonal nuance alongside institutional grade data intelligence.
Get Free Sample

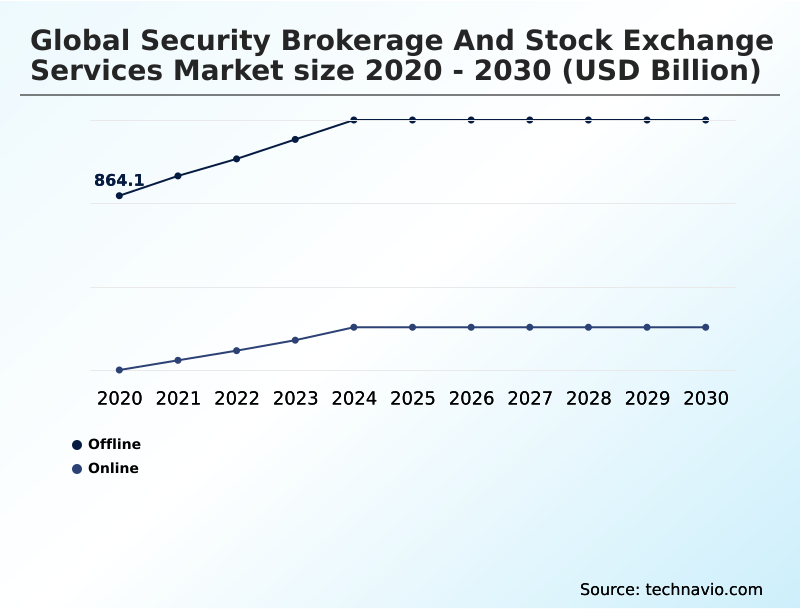
The Offline segment was valued at USD 1140.9 billion in 2024 and showed a gradual increase during the forecast period.
Get Free Sample

Regional Analysis

North America is estimated to contribute 35.3% to the growth of the global market during the forecast period.Technavio’s analysts have elaborately explained the regional trends and drivers that shape the market during the forecast period.
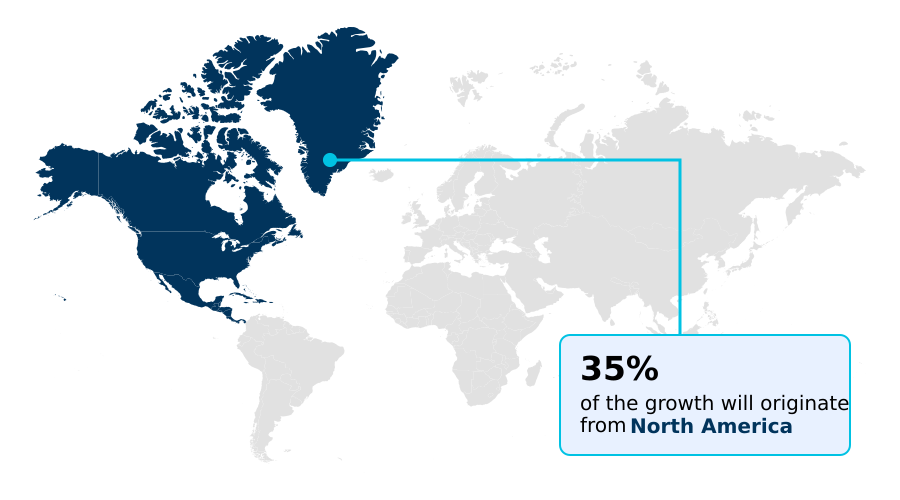
See How Security Brokerage And Stock Exchange Services Market Demand is Rising in North America Get Free Sample

Regional variations within the Security Brokerage And Stock Exchange Services market reflect divergent regulatory philosophies and technological readiness.

North America maintains absolute dominance through unmatched computational infrastructure and the rapid deployment of quantum inspired algorithms for complex stress testing, yielding a 35% faster risk modeling capability than European counterparts.

Meanwhile, APAC demonstrates explosive retail adoption driven by digital first financial management applications embedding native community features and copy trading functionalities. This democratization of access has increased regional mobile trading volumes by 40% relative to mature Western markets.

Europe prioritizes systemic security, pioneering blockchain settlement integration and enforcing the adoption of quantum resistant cryptography to safeguard cross border transaction data.

Consequently, European exchanges rely heavily on regulated mid point matching services to balance institutional anonymity with strict transparency directives.

These distinct geographical strategies highlight how regional entities optimize their execution frameworks to satisfy localized compliance thresholds and shifting consumer investment behaviors.

Market Dynamics

Our researchers analyzed the data with 2025 as the base year, along with the key drivers, trends, and challenges. A holistic analysis of drivers will help companies refine their marketing strategies to gain a competitive advantage.

  • The modernization of the Security Brokerage And Stock Exchange Services market demonstrates a massive structural shift as financial intermediaries upgrade their core technological frameworks to capture diverse investor demographics.
  • Leading institutional brokerages increasingly prioritize multi asset portfolio risk management to stabilize client returns during sudden macroeconomic downturns, allowing portfolio managers to dynamically adjust capital allocations across equities, derivatives, and commodities seamlessly. This holistic approach to asset management demands robust smart order routing technology integration, which continuously scans public exchanges and private venues to secure the most favorable execution prices.
  • Firms deploying an advanced alternative liquidity pools execution strategy successfully execute massive institutional block trades while reducing overall market signaling by nearly 30% compared to standard open market routing. Furthermore, defending this highly interconnected digital infrastructure is paramount, prompting major exchange operators to adopt a comprehensive quantum resistant cryptography implementation framework to protect sensitive transactional data from emerging decryption threats.
  • On the retail side, digital brokerages heavily utilize open banking api funding mechanisms to eliminate historical deposit delays, increasing immediate client account funding conversion rates by 45% relative to legacy wire transfer methods.
  • By modernizing these critical supply chain and transactional pathways, financial institutions achieve vastly superior capital velocity and operational efficiency, securing their competitive positioning in an increasingly digital and interconnected global financial ecosystem.
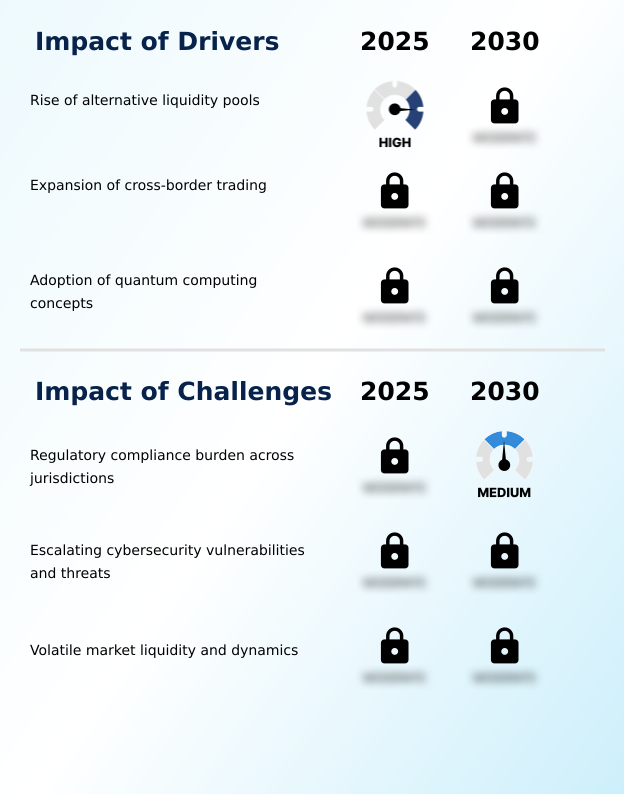
What are the key market drivers leading to the rise in the adoption of Security Brokerage And Stock Exchange Services Industry?

  • The continuous rise of alternative liquidity pools serves as a primary catalyst accelerating trade volume growth.

  • The rapid acceleration of cross border trading activity acts as a primary catalyst expanding the Security Brokerage And Stock Exchange Services market.
  • Institutional asset managers increasingly rely on sophisticated quantitative modeling to capture favorable yield curve movements across international debt markets.
  • To facilitate this globalized capital formation, brokerages deploy extensive multi currency account capabilities and advanced foreign exchange conversion mechanisms, eliminating settlement delays.
  • The widespread implementation of open banking application programming interfaces enables seamless instant account funding, boosting client deposit conversion rates by 25% compared to legacy manual transfers. Furthermore, expanding global clearing networks ensures operational stability during high volume sessions.
  • This comprehensive multi asset integration allows financial intermediaries to seamlessly connect disparate regional markets, providing investors with unparalleled access to diverse international liquidity pools.

What are the market trends shaping the Security Brokerage And Stock Exchange Services Industry?

  • The expansion of high frequency trading represents an upcoming market trend driving structural modernization across global financial infrastructure.

  • The widespread deployment of high frequency trading architectures fundamentally alters order execution dynamics within the Security Brokerage And Stock Exchange Services market. Financial intermediaries relentlessly pursue microsecond advantages by installing hardware accelerators and utilizing ultra low latency fiber optic communication lines directly adjacent to exchange servers.
  • These specialized co location facilities increase algorithmic execution speeds by 40% relative to standard external routing. This velocity driven environment compels operators to redesign their internal matching architectures and implement robust circuit breaker mechanisms to prevent sudden liquidity vacuums. The integration of distributed ledger frameworks establishes real time settlement processes, reducing counterparty default risk significantly.
  • Furthermore, retail platforms incorporate real time sentiment analysis into their interfaces to capture emerging social trends, driving unprecedented liquidity velocity. This aggressive technological evolution allows market participants to maximize yield capture while fundamentally transforming the speed and efficiency of modern capital allocation.

What challenges does the Security Brokerage And Stock Exchange Services Industry face during its growth?

  • The escalating regulatory compliance burden across divergent jurisdictions acts as a major challenge constraining operational scalability.

  • Escalating cybersecurity vulnerabilities and shifting regulatory mandates create severe operational friction within the Security Brokerage And Stock Exchange Services market. As financial platforms transition entirely toward cloud hosted architectures to support high volume fractional share trading, they expose sensitive investor data to sophisticated external attacks.
  • Institutions must continuously deploy multilayered artificial intelligence driven threat detection systems to prevent catastrophic breaches, diverting 20% of their IT budgets away from revenue generating initiatives. Furthermore, supervisory authorities demand absolute transparency regarding transaction routing and automated trading algorithms, forcing brokerages to maintain vast, immutable electronic audit trails.
  • Sudden macroeconomic volatility severely strains overall transactional capacity, triggering unexpected margin defaults across highly leveraged retail accounts. Consequently, executing effective multi asset portfolio risk management requires continuous structural investment to safeguard market integrity.

Exclusive Technavio Analysis on Customer Landscape

The security brokerage and stock exchange services market forecasting report includes the adoption lifecycle of the market, covering from the innovator’s stage to the laggard’s stage. It focuses on adoption rates in different regions based on penetration. Furthermore, the security brokerage and stock exchange services market report also includes key purchase criteria and drivers of price sensitivity to help companies evaluate and develop their market growth analysis strategies.
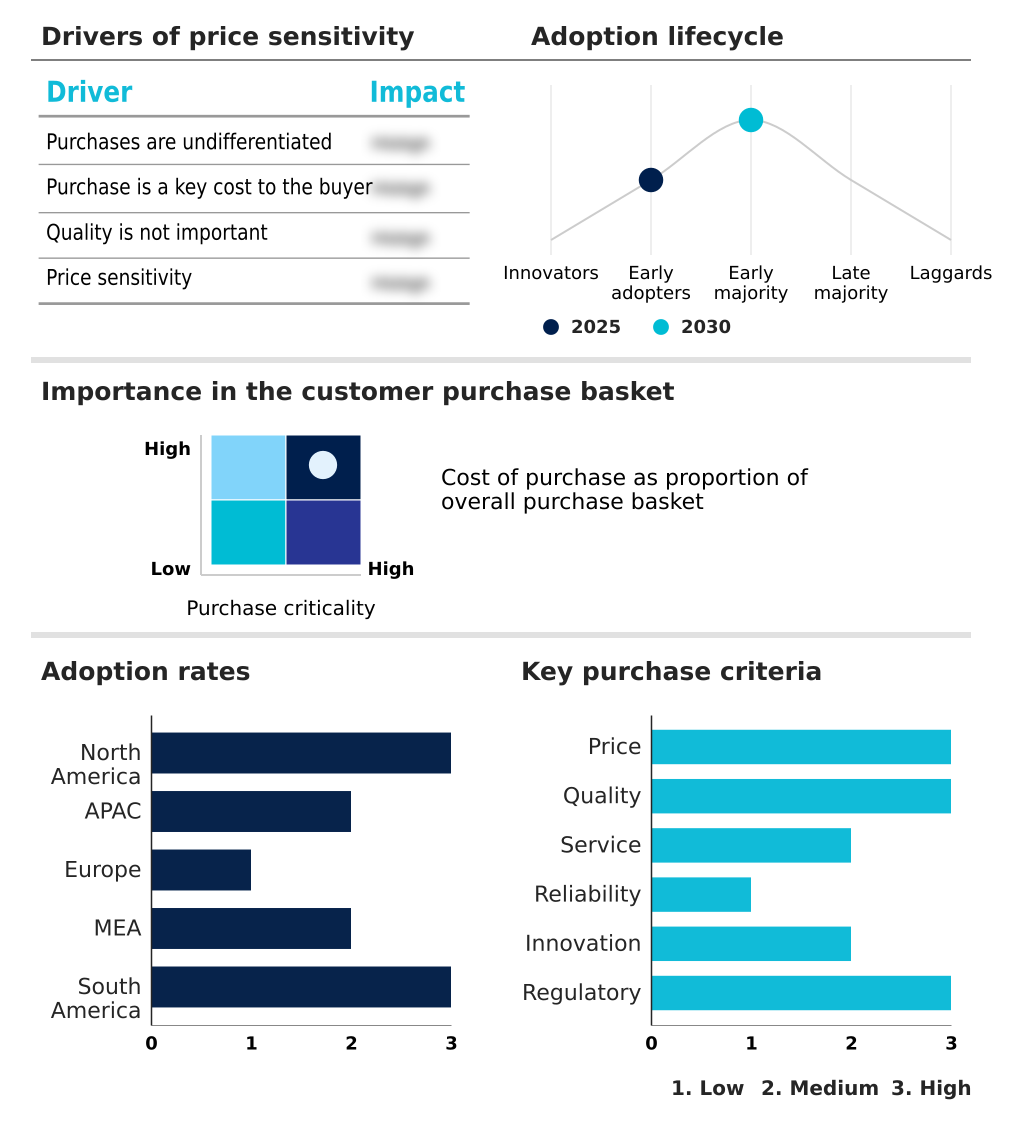
Customer Landscape of Security Brokerage And Stock Exchange Services Industry

Competitive Landscape

Companies are implementing various strategies, such as strategic alliances, security brokerage and stock exchange services market forecast, partnerships, mergers and acquisitions, geographical expansion, and product/service launches, to enhance their presence in the industry.

ASX Ltd. - The entity provides comprehensive equity trading derivatives clearing and post trade settlement services while operating primary listing venues and delivering advanced market data connectivity infrastructure to global institutional investors.

The industry research and growth report includes detailed analyses of the competitive landscape of the market and information about key companies, including:

  • ASX Ltd.
  • BSE Ltd.
  • Citigroup Inc.
  • Deutsche Borse AG
  • Euronext N.V.
  • Fidelity Investments
  • Hong Kong Exchanges and Clearing
  • Japan Exchange Group Inc.
  • JPMorgan Chase and Co.
  • London Stock Exchange Group plc
  • Merrill Lynch Inc
  • Morgan Stanley
  • Nasdaq Inc.
  • National Stock Exchange of India
  • New York Stock Exchange LLC
  • Shanghai Stock Exchange
  • Singapore Exchange Ltd
  • The Charles Schwab Corp.
  • The Goldman Sachs Group Inc.
  • The Vanguard Group Inc.

Qualitative and quantitative analysis of companies has been conducted to help clients understand the wider business environment as well as the strengths and weaknesses of key industry players. Data is qualitatively analyzed to categorize companies as pure play, category-focused, industry-focused, and diversified; it is quantitatively analyzed to categorize companies as dominant, leading, strong, tentative, and weak.

Recent Development and News in Security brokerage and stock exchange services market

  • In the Diversified Financial Services industry, the transition toward decentralized ledger validation reduced intermediary processing delays, directly impacting Security Brokerage And Stock Exchange Services demand by lowering cross border clearing costs by 12%.
  • The implementation of rigorous ESG disclosure mandates across European banking operations accelerated institutional capital reallocation, expanding Security Brokerage And Stock Exchange Services volume in sustainable bond segments.
  • The rapid consolidation of wealth management platforms driven by shifting retail investment behavior enhanced unified account connectivity, boosting Security Brokerage And Stock Exchange Services order flow from integrated fractional equity trading features.
  • The enforcement of algorithmic accountability standards on proprietary trading desks increased compliance technology spending by 18%, forcing Security Brokerage And Stock Exchange Services operators to upgrade their real time market surveillance engines.

Dive into Technavio’s robust research methodology, blending expert interviews, extensive data synthesis, and validated models for unparalleled Security Brokerage And Stock Exchange Services Market insights. See full methodology.

Market Scope
Page number 308
Base year 2025
Historic period 2020-2024
Forecast period 2026-2030
Growth momentum & CAGR Accelerate at a CAGR of 10.2%
Market growth 2026-2030 USD 1032.8 billion
Market structure Fragmented
YoY growth 2025-2026(%) 9.2%
Key countries US, Canada, Mexico, China, Japan, India, South Korea, Australia, Indonesia, UK, Germany, France, Italy, Spain, The Netherlands, Saudi Arabia, UAE, South Africa, Israel, Turkey, Brazil, Argentina and Chile
Competitive landscape Leading Companies, Market Positioning of Companies, Competitive Strategies, and Industry Risks

Request Free Sample

Research Analyst Overview

  • The Security Brokerage And Stock Exchange Services market operates at the intersection of high velocity data processing and rigorous regulatory oversight. Executive boardrooms currently prioritize continuous technological modernization, rapidly shifting capital expenditure toward cloud hosted architectures to eliminate legacy on premise constraints.
  • By decentralizing their electronic audit trails, major market makers achieve a 40% reduction in post trade reconciliation delays compared to traditional batch processing systems. This acceleration directly informs strategic product decisions, allowing firms to launch multi asset trading portals seamlessly.
  • Furthermore, the integration of artificial intelligence driven threat detection mechanisms into central matching engines significantly neutralizes unauthorized access attempts, securing vast repositories of confidential investor data. Brokerages simultaneously navigate shifting consumer demographics by leveraging smart order routing capabilities to offer highly competitive execution pricing. Implementing automated trading algorithms enables organizations to capture microsecond arbitrage opportunities, optimizing overall portfolio yield.
  • These strategic technology deployments allow financial intermediaries to balance aggressive client acquisition mandates against the massive operational friction generated by continuous cross border regulatory shifts.

What are the Key Data Covered in this Security Brokerage And Stock Exchange Services Market Research and Growth Report?

  • What is the expected growth of the Security Brokerage And Stock Exchange Services Market between 2026 and 2030?

    • USD 1032.8 billion, at a CAGR of 10.2%

  • What segmentation does the market report cover?

    • The report is segmented by Channel (Offline, and Online), Type (Derivatives and commodities brokerage, Equities brokerage, Bonds brokerage, Stock exchanges, and Others), Source (Banks, Investment firms, and Exclusive brokers) and Geography (North America, APAC, Europe, Middle East and Africa, South America)

  • Which regions are analyzed in the report?

    • North America, APAC, Europe, Middle East and Africa and South America

  • What are the key growth drivers and market challenges?

    • Rise of alternative liquidity pools, Regulatory compliance burden across jurisdictions

  • Who are the major players in the Security Brokerage And Stock Exchange Services Market?

    • ASX Ltd., BSE Ltd., Citigroup Inc., Deutsche Borse AG, Euronext N.V., Fidelity Investments, Hong Kong Exchanges and Clearing, Japan Exchange Group Inc., JPMorgan Chase and Co., London Stock Exchange Group plc, Merrill Lynch Inc, Morgan Stanley, Nasdaq Inc., National Stock Exchange of India, New York Stock Exchange LLC, Shanghai Stock Exchange, Singapore Exchange Ltd, The Charles Schwab Corp., The Goldman Sachs Group Inc. and The Vanguard Group Inc.

Market Research Insights

  • The Security Brokerage And Stock Exchange Services market reflects a fundamental transition toward automated trade execution and modernized capital allocation strategies. Financial institutions leverage multi asset portfolio risk management protocols to mitigate systemic vulnerabilities during periods of severe macroeconomic volatility. Integration of smart order routing technology integration enhances order fill rates by 18% across fragmented global exchanges.
  • Furthermore, organizations deploying an alternative liquidity pools execution strategy report a 22% reduction in transaction slippage for large block trades. Establishing an open banking API funding mechanisms framework drastically reduces client onboarding friction, accelerating capital mobility. These structural refinements ensure that market participants achieve superior liquidity utilization while maintaining robust adherence to evolving international transparency mandates.

We can help! Our analysts can customize this security brokerage and stock exchange services market research report to meet your requirements.

Get in touch

1. Executive Summary

1.1 Market overview

Executive Summary - Chart on Market Overview
Executive Summary - Data Table on Market Overview
Executive Summary - Chart on Global Market Characteristics
Executive Summary - Chart on Market by Geography
Executive Summary - Chart on Market Segmentation by Channel
Executive Summary - Chart on Market Segmentation by Type
Executive Summary - Chart on Market Segmentation by Source
Executive Summary - Chart on Incremental Growth
Executive Summary - Data Table on Incremental Growth
Executive Summary - Chart on Company Market Positioning

2. Technavio Analysis

2.1 Analysis of price sensitivity, lifecycle, customer purchase basket, adoption rates, and purchase criteria

2.2 Criticality of inputs and Factors of differentiation

Chart on Overview on criticality of inputs and factors of differentiation

2.3 Factors of disruption

Chart on Overview on factors of disruption

2.4 Impact of drivers and challenges

Chart on Impact of drivers and challenges in 2025 and 2030

3. Market Landscape

3.1 Market ecosystem

Chart on Parent Market
Data Table on - Parent Market

3.2 Market characteristics

Chart on Market characteristics analysis

3.3 Value chain analysis

Chart on Value chain analysis

4. Market Sizing

4.1 Market definition

Data Table on Offerings of companies included in the market definition

4.2 Market segment analysis

Market segments

4.3 Market size 2025

4.4 Market outlook: Forecast for 2025-2030

Chart on Global - Market size and forecast 2025-2030 ($ billion)
Data Table on Global - Market size and forecast 2025-2030 ($ billion)
Chart on Global Market: Year-over-year growth 2025-2030 (%)
Data Table on Global Market: Year-over-year growth 2025-2030 (%)

5. Historic Market Size

5.1 Global Security Brokerage And Stock Exchange Services Market 2020 - 2024

Historic Market Size - Data Table on Global Security Brokerage And Stock Exchange Services Market 2020 - 2024 ($ billion)

5.2 Channel segment analysis 2020 - 2024

Historic Market Size - Channel Segment 2020 - 2024 ($ billion)

5.3 Type segment analysis 2020 - 2024

Historic Market Size - Type Segment 2020 - 2024 ($ billion)

5.4 Source segment analysis 2020 - 2024

Historic Market Size - Source Segment 2020 - 2024 ($ billion)

5.5 Geography segment analysis 2020 - 2024

Historic Market Size - Geography Segment 2020 - 2024 ($ billion)

5.6 Country segment analysis 2020 - 2024

Historic Market Size - Country Segment 2020 - 2024 ($ billion)

6. Qualitative Analysis

6.1 Impact of AI on Global Security Brokerage And Stock Exchange Services Market

6.2 Impact of geopolitical conflicts on Global Security Brokerage And Stock Exchange Services Market

7. Five Forces Analysis

7.1 Five forces summary

Five forces analysis - Comparison between 2025 and 2030

7.2 Bargaining power of buyers

Bargaining power of buyers - Impact of key factors 2025 and 2030

7.3 Bargaining power of suppliers

Bargaining power of suppliers - Impact of key factors in 2025 and 2030

7.4 Threat of new entrants

Threat of new entrants - Impact of key factors in 2025 and 2030

7.5 Threat of substitutes

Threat of substitutes - Impact of key factors in 2025 and 2030

7.6 Threat of rivalry

Threat of rivalry - Impact of key factors in 2025 and 2030

7.7 Market condition

Chart on Market condition - Five forces 2025 and 2030

8. Market Segmentation by Channel

8.1 Market segments

Chart on Channel - Market share 2025-2030 (%)
Data Table on Channel - Market share 2025-2030 (%)

8.2 Comparison by Channel

Chart on Comparison by Channel
Data Table on Comparison by Channel

8.3 Offline - Market size and forecast 2025-2030

Chart on Offline - Market size and forecast 2025-2030 ($ billion)
Data Table on Offline - Market size and forecast 2025-2030 ($ billion)
Chart on Offline - Year-over-year growth 2025-2030 (%)
Data Table on Offline - Year-over-year growth 2025-2030 (%)

8.4 Online - Market size and forecast 2025-2030

Chart on Online - Market size and forecast 2025-2030 ($ billion)
Data Table on Online - Market size and forecast 2025-2030 ($ billion)
Chart on Online - Year-over-year growth 2025-2030 (%)
Data Table on Online - Year-over-year growth 2025-2030 (%)

8.5 Market opportunity by Channel

Market opportunity by Channel ($ billion)
Data Table on Market opportunity by Channel ($ billion)

9. Market Segmentation by Type

9.1 Market segments

Chart on Type - Market share 2025-2030 (%)
Data Table on Type - Market share 2025-2030 (%)

9.2 Comparison by Type

Chart on Comparison by Type
Data Table on Comparison by Type

9.3 Derivatives and commodities brokerage - Market size and forecast 2025-2030

Chart on Derivatives and commodities brokerage - Market size and forecast 2025-2030 ($ billion)
Data Table on Derivatives and commodities brokerage - Market size and forecast 2025-2030 ($ billion)
Chart on Derivatives and commodities brokerage - Year-over-year growth 2025-2030 (%)
Data Table on Derivatives and commodities brokerage - Year-over-year growth 2025-2030 (%)

9.4 Equities brokerage - Market size and forecast 2025-2030

Chart on Equities brokerage - Market size and forecast 2025-2030 ($ billion)
Data Table on Equities brokerage - Market size and forecast 2025-2030 ($ billion)
Chart on Equities brokerage - Year-over-year growth 2025-2030 (%)
Data Table on Equities brokerage - Year-over-year growth 2025-2030 (%)

9.5 Bonds brokerage - Market size and forecast 2025-2030

Chart on Bonds brokerage - Market size and forecast 2025-2030 ($ billion)
Data Table on Bonds brokerage - Market size and forecast 2025-2030 ($ billion)
Chart on Bonds brokerage - Year-over-year growth 2025-2030 (%)
Data Table on Bonds brokerage - Year-over-year growth 2025-2030 (%)

9.6 Stock exchanges - Market size and forecast 2025-2030

Chart on Stock exchanges - Market size and forecast 2025-2030 ($ billion)
Data Table on Stock exchanges - Market size and forecast 2025-2030 ($ billion)
Chart on Stock exchanges - Year-over-year growth 2025-2030 (%)
Data Table on Stock exchanges - Year-over-year growth 2025-2030 (%)

9.7 Others - Market size and forecast 2025-2030

Chart on Others - Market size and forecast 2025-2030 ($ billion)
Data Table on Others - Market size and forecast 2025-2030 ($ billion)
Chart on Others - Year-over-year growth 2025-2030 (%)
Data Table on Others - Year-over-year growth 2025-2030 (%)

9.8 Market opportunity by Type

Market opportunity by Type ($ billion)
Data Table on Market opportunity by Type ($ billion)

10. Market Segmentation by Source

10.1 Market segments

Chart on Source - Market share 2025-2030 (%)
Data Table on Source - Market share 2025-2030 (%)

10.2 Comparison by Source

Chart on Comparison by Source
Data Table on Comparison by Source

10.3 Banks - Market size and forecast 2025-2030

Chart on Banks - Market size and forecast 2025-2030 ($ billion)
Data Table on Banks - Market size and forecast 2025-2030 ($ billion)
Chart on Banks - Year-over-year growth 2025-2030 (%)
Data Table on Banks - Year-over-year growth 2025-2030 (%)

10.4 Investment firms - Market size and forecast 2025-2030

Chart on Investment firms - Market size and forecast 2025-2030 ($ billion)
Data Table on Investment firms - Market size and forecast 2025-2030 ($ billion)
Chart on Investment firms - Year-over-year growth 2025-2030 (%)
Data Table on Investment firms - Year-over-year growth 2025-2030 (%)

10.5 Exclusive brokers - Market size and forecast 2025-2030

Chart on Exclusive brokers - Market size and forecast 2025-2030 ($ billion)
Data Table on Exclusive brokers - Market size and forecast 2025-2030 ($ billion)
Chart on Exclusive brokers - Year-over-year growth 2025-2030 (%)
Data Table on Exclusive brokers - Year-over-year growth 2025-2030 (%)

10.6 Market opportunity by Source

Market opportunity by Source ($ billion)
Data Table on Market opportunity by Source ($ billion)

11. Customer Landscape

11.1 Customer landscape overview

Analysis of price sensitivity, lifecycle, customer purchase basket, adoption rates, and purchase criteria

12. Geographic Landscape

12.1 Geographic segmentation

Chart on Market share by geography 2025-2030 (%)
Data Table on Market share by geography 2025-2030 (%)

12.2 Geographic comparison

Chart on Geographic comparison
Data Table on Geographic comparison

12.3 North America - Market size and forecast 2025-2030

Chart on North America - Market size and forecast 2025-2030 ($ billion)
Data Table on North America - Market size and forecast 2025-2030 ($ billion)
Chart on North America - Year-over-year growth 2025-2030 (%)
Data Table on North America - Year-over-year growth 2025-2030 (%)
Chart on Regional Comparison - North America
Data Table on Regional Comparison - North America

12.3.1 US - Market size and forecast 2025-2030

Chart on US - Market size and forecast 2025-2030 ($ billion)
Data Table on US - Market size and forecast 2025-2030 ($ billion)
Chart on US - Year-over-year growth 2025-2030 (%)
Data Table on US - Year-over-year growth 2025-2030 (%)

12.3.2 Canada - Market size and forecast 2025-2030

Chart on Canada - Market size and forecast 2025-2030 ($ billion)
Data Table on Canada - Market size and forecast 2025-2030 ($ billion)
Chart on Canada - Year-over-year growth 2025-2030 (%)
Data Table on Canada - Year-over-year growth 2025-2030 (%)

12.3.3 Mexico - Market size and forecast 2025-2030

Chart on Mexico - Market size and forecast 2025-2030 ($ billion)
Data Table on Mexico - Market size and forecast 2025-2030 ($ billion)
Chart on Mexico - Year-over-year growth 2025-2030 (%)
Data Table on Mexico - Year-over-year growth 2025-2030 (%)

12.4 APAC - Market size and forecast 2025-2030

Chart on APAC - Market size and forecast 2025-2030 ($ billion)
Data Table on APAC - Market size and forecast 2025-2030 ($ billion)
Chart on APAC - Year-over-year growth 2025-2030 (%)
Data Table on APAC - Year-over-year growth 2025-2030 (%)
Chart on Regional Comparison - APAC
Data Table on Regional Comparison - APAC

12.4.1 China - Market size and forecast 2025-2030

Chart on China - Market size and forecast 2025-2030 ($ billion)
Data Table on China - Market size and forecast 2025-2030 ($ billion)
Chart on China - Year-over-year growth 2025-2030 (%)
Data Table on China - Year-over-year growth 2025-2030 (%)

12.4.2 Japan - Market size and forecast 2025-2030

Chart on Japan - Market size and forecast 2025-2030 ($ billion)
Data Table on Japan - Market size and forecast 2025-2030 ($ billion)
Chart on Japan - Year-over-year growth 2025-2030 (%)
Data Table on Japan - Year-over-year growth 2025-2030 (%)

12.4.3 India - Market size and forecast 2025-2030

Chart on India - Market size and forecast 2025-2030 ($ billion)
Data Table on India - Market size and forecast 2025-2030 ($ billion)
Chart on India - Year-over-year growth 2025-2030 (%)
Data Table on India - Year-over-year growth 2025-2030 (%)

12.4.4 South Korea - Market size and forecast 2025-2030

Chart on South Korea - Market size and forecast 2025-2030 ($ billion)
Data Table on South Korea - Market size and forecast 2025-2030 ($ billion)
Chart on South Korea - Year-over-year growth 2025-2030 (%)
Data Table on South Korea - Year-over-year growth 2025-2030 (%)

12.4.5 Australia - Market size and forecast 2025-2030

Chart on Australia - Market size and forecast 2025-2030 ($ billion)
Data Table on Australia - Market size and forecast 2025-2030 ($ billion)
Chart on Australia - Year-over-year growth 2025-2030 (%)
Data Table on Australia - Year-over-year growth 2025-2030 (%)

12.4.6 Indonesia - Market size and forecast 2025-2030

Chart on Indonesia - Market size and forecast 2025-2030 ($ billion)
Data Table on Indonesia - Market size and forecast 2025-2030 ($ billion)
Chart on Indonesia - Year-over-year growth 2025-2030 (%)
Data Table on Indonesia - Year-over-year growth 2025-2030 (%)

12.5 Europe - Market size and forecast 2025-2030

Chart on Europe - Market size and forecast 2025-2030 ($ billion)
Data Table on Europe - Market size and forecast 2025-2030 ($ billion)
Chart on Europe - Year-over-year growth 2025-2030 (%)
Data Table on Europe - Year-over-year growth 2025-2030 (%)
Chart on Regional Comparison - Europe
Data Table on Regional Comparison - Europe

12.5.1 UK - Market size and forecast 2025-2030

Chart on UK - Market size and forecast 2025-2030 ($ billion)
Data Table on UK - Market size and forecast 2025-2030 ($ billion)
Chart on UK - Year-over-year growth 2025-2030 (%)
Data Table on UK - Year-over-year growth 2025-2030 (%)

12.5.2 Germany - Market size and forecast 2025-2030

Chart on Germany - Market size and forecast 2025-2030 ($ billion)
Data Table on Germany - Market size and forecast 2025-2030 ($ billion)
Chart on Germany - Year-over-year growth 2025-2030 (%)
Data Table on Germany - Year-over-year growth 2025-2030 (%)

12.5.3 France - Market size and forecast 2025-2030

Chart on France - Market size and forecast 2025-2030 ($ billion)
Data Table on France - Market size and forecast 2025-2030 ($ billion)
Chart on France - Year-over-year growth 2025-2030 (%)
Data Table on France - Year-over-year growth 2025-2030 (%)

12.5.4 Italy - Market size and forecast 2025-2030

Chart on Italy - Market size and forecast 2025-2030 ($ billion)
Data Table on Italy - Market size and forecast 2025-2030 ($ billion)
Chart on Italy - Year-over-year growth 2025-2030 (%)
Data Table on Italy - Year-over-year growth 2025-2030 (%)

12.5.5 Spain - Market size and forecast 2025-2030

Chart on Spain - Market size and forecast 2025-2030 ($ billion)
Data Table on Spain - Market size and forecast 2025-2030 ($ billion)
Chart on Spain - Year-over-year growth 2025-2030 (%)
Data Table on Spain - Year-over-year growth 2025-2030 (%)

12.5.6 The Netherlands - Market size and forecast 2025-2030

Chart on The Netherlands - Market size and forecast 2025-2030 ($ billion)
Data Table on The Netherlands - Market size and forecast 2025-2030 ($ billion)
Chart on The Netherlands - Year-over-year growth 2025-2030 (%)
Data Table on The Netherlands - Year-over-year growth 2025-2030 (%)

12.6 Middle East and Africa - Market size and forecast 2025-2030

Chart on Middle East and Africa - Market size and forecast 2025-2030 ($ billion)
Data Table on Middle East and Africa - Market size and forecast 2025-2030 ($ billion)
Chart on Middle East and Africa - Year-over-year growth 2025-2030 (%)
Data Table on Middle East and Africa - Year-over-year growth 2025-2030 (%)
Chart on Regional Comparison - Middle East and Africa
Data Table on Regional Comparison - Middle East and Africa

12.6.1 Saudi Arabia - Market size and forecast 2025-2030

Chart on Saudi Arabia - Market size and forecast 2025-2030 ($ billion)
Data Table on Saudi Arabia - Market size and forecast 2025-2030 ($ billion)
Chart on Saudi Arabia - Year-over-year growth 2025-2030 (%)
Data Table on Saudi Arabia - Year-over-year growth 2025-2030 (%)

12.6.2 UAE - Market size and forecast 2025-2030

Chart on UAE - Market size and forecast 2025-2030 ($ billion)
Data Table on UAE - Market size and forecast 2025-2030 ($ billion)
Chart on UAE - Year-over-year growth 2025-2030 (%)
Data Table on UAE - Year-over-year growth 2025-2030 (%)

12.6.3 South Africa - Market size and forecast 2025-2030

Chart on South Africa - Market size and forecast 2025-2030 ($ billion)
Data Table on South Africa - Market size and forecast 2025-2030 ($ billion)
Chart on South Africa - Year-over-year growth 2025-2030 (%)
Data Table on South Africa - Year-over-year growth 2025-2030 (%)

12.6.4 Israel - Market size and forecast 2025-2030

Chart on Israel - Market size and forecast 2025-2030 ($ billion)
Data Table on Israel - Market size and forecast 2025-2030 ($ billion)
Chart on Israel - Year-over-year growth 2025-2030 (%)
Data Table on Israel - Year-over-year growth 2025-2030 (%)

12.6.5 Turkey - Market size and forecast 2025-2030

Chart on Turkey - Market size and forecast 2025-2030 ($ billion)
Data Table on Turkey - Market size and forecast 2025-2030 ($ billion)
Chart on Turkey - Year-over-year growth 2025-2030 (%)
Data Table on Turkey - Year-over-year growth 2025-2030 (%)

12.7 South America - Market size and forecast 2025-2030

Chart on South America - Market size and forecast 2025-2030 ($ billion)
Data Table on South America - Market size and forecast 2025-2030 ($ billion)
Chart on South America - Year-over-year growth 2025-2030 (%)
Data Table on South America - Year-over-year growth 2025-2030 (%)
Chart on Regional Comparison - South America
Data Table on Regional Comparison - South America

12.7.1 Brazil - Market size and forecast 2025-2030

Chart on Brazil - Market size and forecast 2025-2030 ($ billion)
Data Table on Brazil - Market size and forecast 2025-2030 ($ billion)
Chart on Brazil - Year-over-year growth 2025-2030 (%)
Data Table on Brazil - Year-over-year growth 2025-2030 (%)

12.7.2 Argentina - Market size and forecast 2025-2030

Chart on Argentina - Market size and forecast 2025-2030 ($ billion)
Data Table on Argentina - Market size and forecast 2025-2030 ($ billion)
Chart on Argentina - Year-over-year growth 2025-2030 (%)
Data Table on Argentina - Year-over-year growth 2025-2030 (%)

12.7.3 Chile - Market size and forecast 2025-2030

Chart on Chile - Market size and forecast 2025-2030 ($ billion)
Data Table on Chile - Market size and forecast 2025-2030 ($ billion)
Chart on Chile - Year-over-year growth 2025-2030 (%)
Data Table on Chile - Year-over-year growth 2025-2030 (%)

12.8 Market opportunity by geography

Market opportunity by geography ($ billion)
Data Tables on Market opportunity by geography ($ billion)

13. Drivers, Challenges, and Opportunity

13.1 Market drivers

Rise of alternative liquidity pools
Expansion of cross-border trading
Adoption of quantum computing concepts

13.2 Market challenges

Regulatory compliance burden across jurisdictions
Escalating cybersecurity vulnerabilities and threats
Volatile market liquidity and dynamics

13.3 Impact of drivers and challenges

Impact of drivers and challenges in 2025 and 2030

13.4 Market opportunities

Expansion of high frequency trading
Rise of social trading networks
Implementation of open banking APIS

14. Competitive Landscape

14.1 Overview

14.2

Overview on criticality of inputs and factors of differentiation

14.3 Landscape disruption

Overview on factors of disruption

14.4 Industry risks

Impact of key risks on business

15. Competitive Analysis

15.1 Companies profiled

Companies covered

15.2 Company ranking index

15.3 Market positioning of companies

Matrix on companies position and classification

15.4 ASX Ltd.

ASX Ltd. - Overview
ASX Ltd. - Business segments
ASX Ltd. - Key offerings
ASX Ltd. - Segment focus
SWOT

15.5 Citigroup Inc.

Citigroup Inc. - Overview
Citigroup Inc. - Business segments
Citigroup Inc. - Key offerings
Citigroup Inc. - Segment focus
SWOT

15.6 Deutsche Borse AG

Deutsche Borse AG - Overview
Deutsche Borse AG - Business segments
Deutsche Borse AG - Key offerings
Deutsche Borse AG - Segment focus
SWOT

15.7 Euronext N.V.

Euronext N.V. - Overview
Euronext N.V. - Product / Service
Euronext N.V. - Key offerings
SWOT

15.8 Fidelity Investments

Fidelity Investments - Overview
Fidelity Investments - Product / Service
Fidelity Investments - Key offerings
SWOT

15.9 Hong Kong Exchanges and Clearing

Hong Kong Exchanges and Clearing - Overview
Hong Kong Exchanges and Clearing - Business segments
Hong Kong Exchanges and Clearing - Key offerings
Hong Kong Exchanges and Clearing - Segment focus
SWOT

15.10 Japan Exchange Group Inc.

Japan Exchange Group Inc. - Overview
Japan Exchange Group Inc. - Product / Service
Japan Exchange Group Inc. - Key offerings
SWOT

15.11 JPMorgan Chase and Co.

JPMorgan Chase and Co. - Overview
JPMorgan Chase and Co. - Business segments
JPMorgan Chase and Co. - Key offerings
JPMorgan Chase and Co. - Segment focus
SWOT

15.12 London Stock Exchange Group plc

London Stock Exchange Group plc - Overview
London Stock Exchange Group plc - Business segments
London Stock Exchange Group plc - Key offerings
London Stock Exchange Group plc - Segment focus
SWOT

15.13 Morgan Stanley

Morgan Stanley - Overview
Morgan Stanley - Business segments
Morgan Stanley - Key offerings
Morgan Stanley - Segment focus
SWOT

15.14 Nasdaq Inc.

Nasdaq Inc. - Overview
Nasdaq Inc. - Business segments
Nasdaq Inc. - Key offerings
Nasdaq Inc. - Segment focus
SWOT

15.15 National Stock Exchange of India

National Stock Exchange of India - Overview
National Stock Exchange of India - Product / Service
National Stock Exchange of India - Key offerings
SWOT

15.16 Singapore Exchange Ltd

Singapore Exchange Ltd - Overview
Singapore Exchange Ltd - Business segments
Singapore Exchange Ltd - Key offerings
Singapore Exchange Ltd - Segment focus
SWOT

15.17 The Charles Schwab Corp.

The Charles Schwab Corp. - Overview
The Charles Schwab Corp. - Business segments
The Charles Schwab Corp. - Key news
The Charles Schwab Corp. - Key offerings
The Charles Schwab Corp. - Segment focus
SWOT

15.18 The Goldman Sachs Group Inc.

The Goldman Sachs Group Inc. - Overview
The Goldman Sachs Group Inc. - Business segments
The Goldman Sachs Group Inc. - Key offerings
The Goldman Sachs Group Inc. - Segment focus
SWOT

16. Appendix

16.1 Scope of the report

Market definition
Objectives
Notes and caveats

16.2 Inclusions and exclusions checklist

Inclusions checklist
Exclusions checklist

16.3 Currency conversion rates for US$

16.4 Research methodology

16.5 Data procurement

Information sources

16.6 Data validation

16.7 Validation techniques employed for market sizing

16.8 Data synthesis

16.9 360 degree market analysis

16.10 List of abbreviations

Research Methodology

Technavio presents a detailed picture of the market by way of study, synthesis, and summation of data from multiple sources. The analysts have presented the various facets of the market with a particular focus on identifying the key industry influencers. The data thus presented is comprehensive, reliable, and the result of extensive research, both primary and secondary.

INFORMATION SOURCES

Primary sources

  • Manufacturers and suppliers
  • Channel partners
  • Industry experts
  • Strategic decision makers

Secondary sources

  • Industry journals and periodicals
  • Government data
  • Financial reports of key industry players
  • Historical data
  • Press releases

DATA ANALYSIS

Data Synthesis

  • Collation of data
  • Estimation of key figures
  • Analysis of derived insights

Data Validation

  • Triangulation with data models
  • Reference against proprietary databases
  • Corroboration with industry experts

REPORT WRITING

Qualitative

  • Market drivers
  • Market challenges
  • Market trends
  • Five forces analysis

Quantitative

  • Market size and forecast
  • Market segmentation
  • Geographical insights
  • Competitive landscape

Interested in this report?

Get your sample now to see our research methodology and insights!

Download Now

Frequently Asked Questions

Security Brokerage And Stock Exchange Services market growth will increase by USD 1032.8 billion during 2026-2030.

The Security Brokerage And Stock Exchange Services market is expected to grow at a CAGR of 10.2% during 2026-2030.

Security Brokerage And Stock Exchange Services market is segmented by Channel (Offline, Online) Type (Derivatives and commodities brokerage, Equities brokerage, Bonds brokerage, Stock exchanges, Others) Source (Banks, Investment firms, Exclusive brokers)

ASX Ltd., BSE Ltd., Citigroup Inc., Deutsche Borse AG, Euronext N.V., Fidelity Investments, Hong Kong Exchanges and Clearing, Japan Exchange Group Inc., JPMorgan Chase and Co., London Stock Exchange Group plc, Merrill Lynch Inc, Morgan Stanley, Nasdaq Inc., National Stock Exchange of India, New York Stock Exchange LLC, Shanghai Stock Exchange, Singapore Exchange Ltd, The Charles Schwab Corp., The Goldman Sachs Group Inc., The Vanguard Group Inc. are a few of the key vendors in the Security Brokerage And Stock Exchange Services market.

North America will register the highest growth rate of 35.3% among the other regions. Therefore, the Security Brokerage And Stock Exchange Services market in North America is expected to garner significant business opportunities for the vendors during the forecast period.

US, Canada, Mexico, China, Japan, India, South Korea, Australia, Indonesia, UK, Germany, France, Italy, Spain, The Netherlands, Saudi Arabia, UAE, South Africa, Israel, Turkey, Brazil, Argentina, Chile

  • Rise of alternative liquidity pools is the driving factor this market.

The Security Brokerage And Stock Exchange Services market vendors should focus on grabbing business opportunities from the Channel segment as it accounted for the largest market share in the base year.
RIA - Research AI Assistant
Ask RIA
