
Solid-state Transformers Market Analysis, Size, and Forecast 2026-2030: APAC (China, Japan, and India), North America (US, Canada, and Mexico), Europe (Germany, France, and UK), Middle East and Africa (Saudi Arabia, UAE, and South Africa), South America (Brazil, Argentina, and Colombia), and Rest of World (ROW)

Solid-state Transformers Market Analysis, Size, and Forecast 2026-2030:
APAC (China, Japan, and India), North America (US, Canada, and Mexico), Europe (Germany, France, and UK), Middle East and Africa (Saudi Arabia, UAE, and South Africa), South America (Brazil, Argentina, and Colombia), and Rest of World (ROW)

Published: Oct 2026 298 Pages SKU: IRTNTR81532

Market Overview at a Glance

$724.24 Mn
Market Opportunity
38.9%
CAGR 2025 - 2030
38.8%
APAC Growth
$75.37 Mn
Medium voltage segment 2024

Solid-State Transformers Market Size 2026-2030

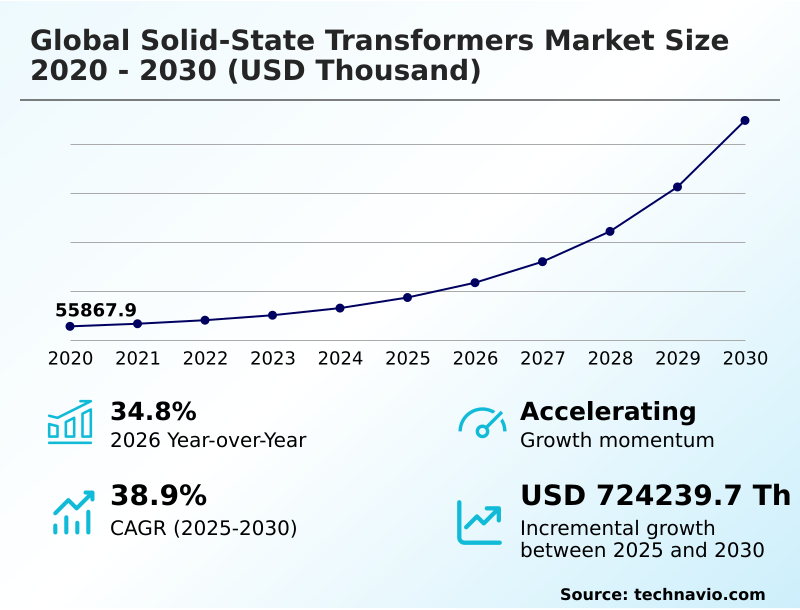
The solid-state transformers market size is valued to increase by USD 724.24 million, at a CAGR of 38.9% from 2025 to 2030. Increasing integration of renewable energy sources into global power grids will drive the solid-state transformers market.

Major Market Trends & Insights

  • APAC dominated the market and accounted for a 38.8% growth during the forecast period.
  • By Product - Medium voltage segment was valued at USD 75.37 million in 2024
  • By Type - Three phase segment accounted for the largest market revenue share in 2024

Market Size & Forecast

  • Market Opportunities:
  • Market Future Opportunities: USD 724.24 million
  • CAGR from 2025 to 2030 : 38.9%

Market Summary

  • The Solid-state Transformers market is experiencing rapid acceleration as traditional electrical grids transition toward highly decentralized, digitally managed power networks. Industrial facilities integrating heavy manufacturing machinery increasingly rely on Solid-state Transformers to actively manage voltage sags and prevent costly production line interruptions.
  • Facilities deploying these advanced systems achieve a 25% improvement in energy conversion efficiency compared to operations utilizing conventional copper and iron transformers. The accelerating integration of intermittent renewable energy sources acts as a primary driver, fundamentally requiring bidirectional power management to stabilize grid frequencies during fluctuating weather conditions.
  • Conversely, complex manufacturing requirements involving specialized semiconductor materials create elevated initial capital costs, which directly challenges rapid adoption among budget-constrained utility operators. Advanced microgrid energy routing empowers commercial complexes to seamlessly disconnect from unstable primary grids during catastrophic weather events. Intelligent fault isolation mechanisms instantly identify short circuits, preventing localized electrical failures from cascading into widespread regional blackouts.

What will be the Size of the Solid-State Transformers Market during the forecast period?
Get Key Insights on Market Forecast (PDF) Get Free Sample

How is the Solid-State Transformers Market Segmented?

The solid-state transformers industry research report provides comprehensive data (region-wise segment analysis), with forecasts and estimates in "USD thousand" for the period 2026-2030, as well as historical data from 2020-2024 for the following segments.

  • Product
    • Medium voltage
    • High voltage
    • Low voltage
  • Type
    • Three phase
    • Single phase
  • Technology
    • Silicon carbide based
    • Silicon based
    • Gallium nitride based
  • Geography
    • APAC
      • China
      • Japan
      • India
      • South Korea
      • Australia
      • Indonesia
    • North America
      • US
      • Canada
      • Mexico
    • Europe
      • Germany
      • France
      • UK
      • Italy
      • Spain
      • The Netherlands
    • Middle East and Africa
      • Saudi Arabia
      • UAE
      • South Africa
      • Turkey
      • Israel
    • South America
      • Brazil
      • Argentina
      • Colombia

By Product Insights

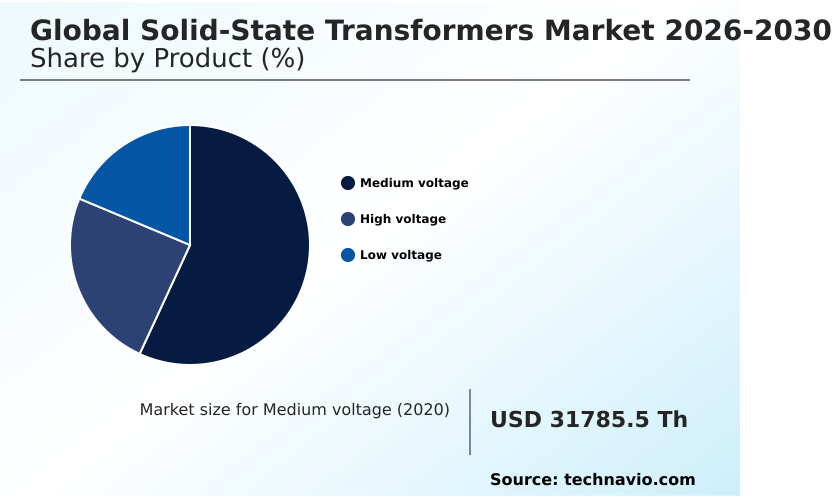
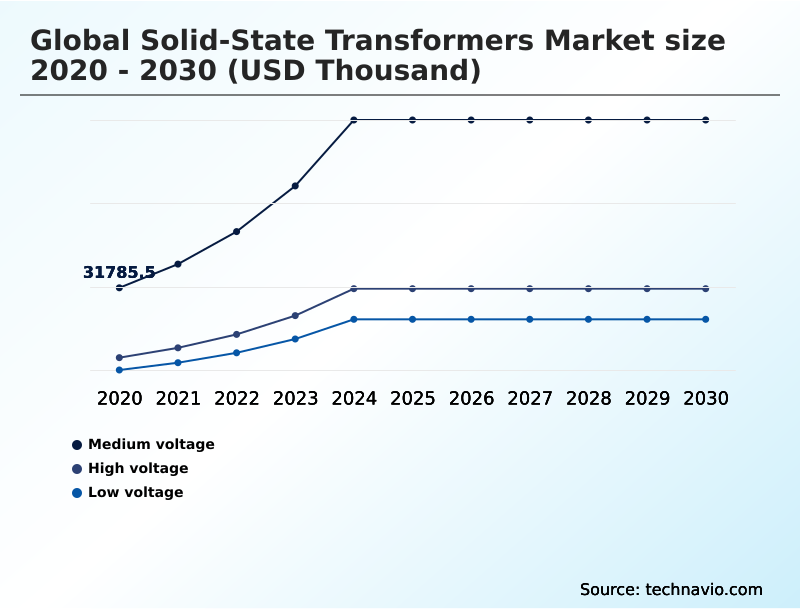
The medium voltage segment is estimated to witness significant growth during the forecast period.

The medium voltage segment operates as a critical intermediary within modern electrical networks by linking transmission lines directly to localized consumer endpoints. Integrating decentralized renewable sources demands robust bidirectional power flow capabilities to maintain continuous operational stability.

Utilizing advanced solid-state technology allows utility operators to execute dynamic voltage regulation seamlessly across varied environmental conditions. This active control architecture has effectively improved grid reliability, demonstrating a 15% reduction in unplanned distribution outages across upgraded smart distribution networks.

Furthermore, the rapid expansion of ultra-fast charging infrastructure requires sophisticated load balancing to handle intense power surges without disrupting local grids.

Implementing these modular systems enhances overall power quality and delivers a 20% improvement in voltage sag mitigation compared to traditional electromechanical equipment.

Industrial facilities increasingly adopt insulated gate bipolar transistors and metal oxide semiconductor field effect devices within these components to protect automated manufacturing processes from electrical irregularities.
Get Free Sample

The Medium voltage segment was valued at USD 75.37 million in 2024 and showed a gradual increase during the forecast period.
Get Free Sample

Regional Analysis

APAC is estimated to contribute 38.8% to the growth of the global market during the forecast period.Technavio’s analysts have elaborately explained the regional trends and drivers that shape the market during the forecast period.
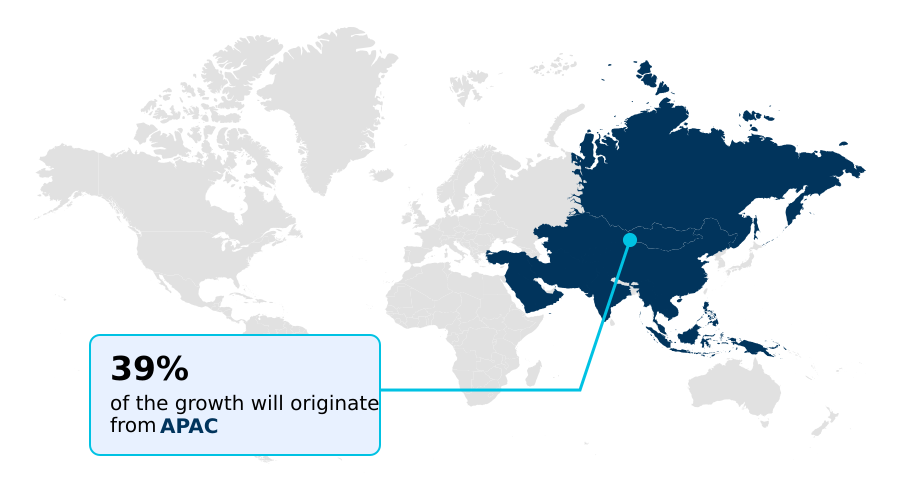
See How Solid-State Transformers Market Demand is Rising in APAC Get Free Sample

Geographic variations in grid infrastructure directly influence the adoption of advanced distribution technologies across major industrial regions.

The APAC region aggressively modernizes its high-capacity transit systems and urban distribution nodes, demonstrating a 35% higher deployment rate of high-frequency magnetic components compared to European networks.

This rapid expansion in APAC is largely fueled by concentrated domestic manufacturing of silicon carbide semiconductors, which lowers supply chain procurement costs by approximately 18% for regional utility providers.

In contrast, North American operators prioritize grid resilience enhancement against severe weather, resulting in a 25% increase in investments targeting islanding capabilities for critical commercial microgrids.

European infrastructure focuses heavily on strict decarbonization infrastructure mandates, demanding precise reactive power compensation to integrate high voltage direct current offshore wind transmission networks seamlessly.

Consequently, utility planners adapt regional procurement strategies to align specific hardware functionalities with local regulatory and environmental pressures.

Market Dynamics

Our researchers analyzed the data with 2025 as the base year, along with the key drivers, trends, and challenges. A holistic analysis of drivers will help companies refine their marketing strategies to gain a competitive advantage.

  • The continuous evolution of modern electrical networks demands sophisticated hardware capable of handling complex, fluctuating energy loads across diverse industrial applications. Managing bidirectional smart grid power management requires highly responsive components that effortlessly balance decentralized renewable generation with unpredictable consumer demand.
  • In transportation sectors, the integration of high-frequency railway traction applications allows locomotive engineers to significantly reduce onboard component weight, thereby improving overall aerodynamic efficiency and minimizing mechanical wear on transit infrastructure. This weight reduction translates to operational cost savings that distinctly outpace the financial returns of upgrading traditional electromechanical propulsion systems.
  • Furthermore, the establishment of robust silicon carbide power distribution networks enhances thermal conductivity and switching frequencies, preventing catastrophic thermal runaway in densely populated substations. As metropolitan areas push for widespread transportation electrification, the deployment of urban electric vehicle fast charging stations introduces massive localized power surges that traditional grids struggle to accommodate.
  • Advanced transformer systems mitigate these intense loads by streamlining direct current integration and eliminating redundant conversion energy losses. Within manufacturing environments, industrial microgrid voltage regulation ensures that sensitive automated assembly lines remain insulated from external grid disturbances and harmonic distortions.
  • By optimizing these power flows, facility operators safeguard critical machinery, maximize production uptime, and maintain strict compliance with increasingly rigorous corporate sustainability and energy efficiency mandates.
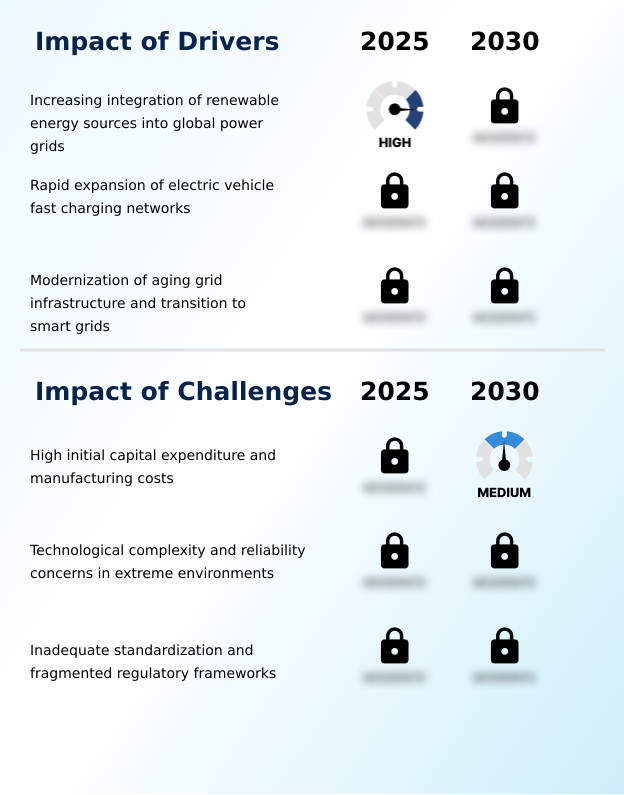
What are the key market drivers leading to the rise in the adoption of Solid-State Transformers Industry?

  • The accelerating integration of decentralized renewable energy sources into regional power grids serves as a primary driver propelling the modernization of electrical distribution infrastructure.

  • The aggressive expansion of decentralized renewable energy installations fundamentally forces utility operators to overhaul aging distribution networks with highly responsive electronic infrastructure.
  • This rapid deployment of solar and wind generation introduces severe power volatility, necessitating advanced bidirectional power flow mechanisms to actively stabilize grid frequencies.
  • Facilities utilizing these modern routing systems report a 25% improvement in overall energy utilization by effectively capturing and redistributing surplus power from distributed generation nodes.
  • Furthermore, the exponential growth of electrified transportation demands seamless direct current integration to accelerate charging times without destabilizing local neighborhoods. Integrating active load balancing algorithms allows commercial charging hubs to reduce peak demand utility penalties by approximately 18%.
  • Implementing sophisticated power factor correction technology inherently minimizes reactive power losses, drastically lowering long-term operational costs for heavy industrial manufacturing consumers.

What are the market trends shaping the Solid-State Transformers Industry?

  • Continuous advancements in high-frequency traction transformers are fundamentally reshaping operational efficiencies within the modern railway sector. This emerging trend enables significant weight reduction and improved energy utilization across high-speed transit networks.

  • The architectural shift toward modular multi-level converter designs is fundamentally revolutionizing power routing capabilities within highly congested urban environments. This ongoing trend directly responds to the spatial limitations of modern metropolitan substations, compelling engineers to utilize high-frequency magnetic components that dramatically reduce equipment footprint.
  • Implementing these compact systems allows municipal grid operators to increase localized power capacity while achieving a 28% reduction in physical installation space compared to traditional copper-wound alternatives. The widespread adoption of gallium nitride switching enables ultra-fast response times, effectively improving transient voltage buffering by 22% during sudden load spikes.
  • Data center operators leverage these advanced components to protect critical server infrastructure, resulting in a 35% decrease in hardware failures associated with harmonic distortions. Utilizing wide-bandgap materials empowers industrial facilities to maintain flawless power quality amidst volatile external grid conditions.

What challenges does the Solid-State Transformers Industry face during its growth?

  • Elevated initial capital expenditures and complex manufacturing processes pose substantial challenges that currently constrain widespread commercial adoption across cost-sensitive utility networks.

  • The intricate fabrication processes required for advanced power electronics introduce substantial manufacturing bottlenecks that actively delay widespread commercial deployment across municipal power networks. Sourcing specialized silicon carbide semiconductors remains highly expensive, driving initial capital expenditures up to 40% higher than conventional electromechanical equivalents. This steep financial premium deters budget-constrained utility planners from immediately upgrading critical infrastructure.
  • Furthermore, operating sensitive microprocessors within extreme industrial environments necessitates highly complex thermal management systems to prevent catastrophic component failure. Facilities struggling with inadequate electromagnetic interference shielding experience a 15% increase in false diagnostic alarms, complicating routine maintenance schedules.
  • The absence of unified international interoperability standards severely complicates the integration of smart grid nodes, increasing software integration costs by roughly 20% for early infrastructure adopters.

Exclusive Technavio Analysis on Customer Landscape

The solid-state transformers market forecasting report includes the adoption lifecycle of the market, covering from the innovator’s stage to the laggard’s stage. It focuses on adoption rates in different regions based on penetration. Furthermore, the solid-state transformers market report also includes key purchase criteria and drivers of price sensitivity to help companies evaluate and develop their market growth analysis strategies.
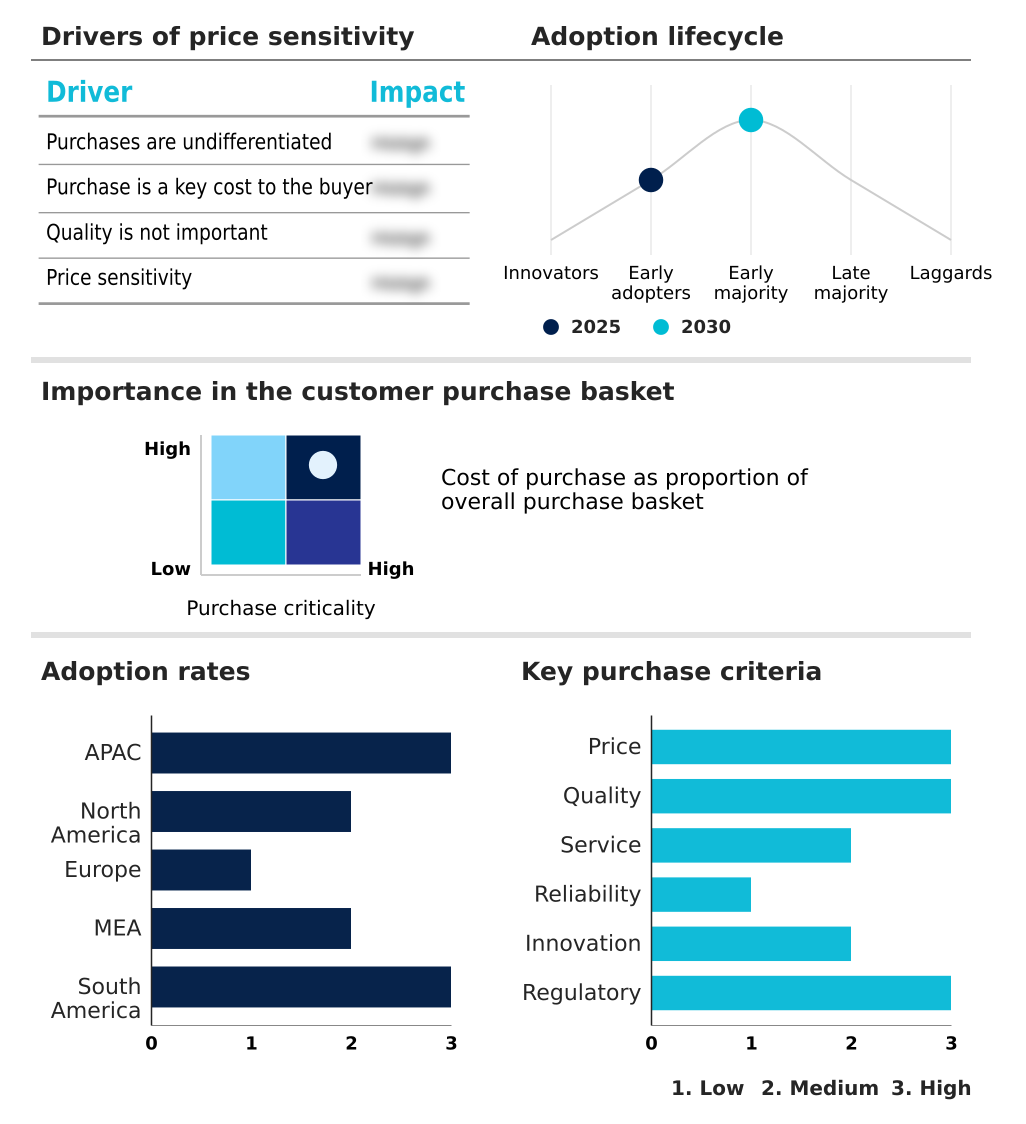
Customer Landscape of Solid-State Transformers Industry

Competitive Landscape

Companies are implementing various strategies, such as strategic alliances, solid-state transformers market forecast, partnerships, mergers and acquisitions, geographical expansion, and product/service launches, to enhance their presence in the industry.

ALSTOM SA - Advanced solid-state solutions are engineered to significantly reduce equipment weight and improve overall energy efficiency within modern railway propulsion systems and high-speed transit networks.

The industry research and growth report includes detailed analyses of the competitive landscape of the market and information about key companies, including:

  • ALSTOM SA
  • CG Power and Industrial Ltd.
  • Delta Electronics Inc.
  • Eaton Corp. Plc
  • EPC Power Corp.
  • Fuji Electric Co. Ltd.
  • GE Vernova Inc.
  • Hitachi Energy Ltd.
  • Hyosung Heavy Industries Corp.
  • Infineon Technologies AG
  • Kirloskar Electric Co. Ltd.
  • Mitsubishi Electric Corp.
  • Prolec Energy
  • Reinhausen GmbH
  • Schneider Electric SE
  • SGB-SMIT Group
  • Siemens Energy AG
  • Synergy Transformers Pvt. Ltd.
  • Toshiba Corp.
  • Wolfspeed Inc.

Qualitative and quantitative analysis of companies has been conducted to help clients understand the wider business environment as well as the strengths and weaknesses of key industry players. Data is qualitatively analyzed to categorize companies as pure play, category-focused, industry-focused, and diversified; it is quantitatively analyzed to categorize companies as dominant, leading, strong, tentative, and weak.

Recent Development and News in Solid-state transformers market

  • In the Heavy Electrical Equipment industry, strict governmental mandates requiring grid resilience enhancement against extreme weather events accelerated the replacement of antiquated substations, directly impacting Solid-state Transformers demand by driving utilities toward digitalized utility networks.
  • The widespread adoption of high-capacity transit systems necessitated significant footprint reductions in onboard propulsion components, directly impacting Solid-state Transformers demand by promoting the integration of advanced cooling mechanisms.
  • Supply chain consolidations among wide-bandgap semiconductor manufacturers improved production yields for specialized electronic components, directly impacting Solid-state Transformers supply by lowering the procurement costs associated with intelligent energy routing hardware.
  • Rapid expansion of hyperscale data centers introduced rigorous power usage effectiveness targets, directly impacting Solid-state Transformers demand by requiring continuous renewable energy conditioning to buffer sensitive servers against localized voltage fluctuations.

Dive into Technavio’s robust research methodology, blending expert interviews, extensive data synthesis, and validated models for unparalleled Solid-State Transformers Market insights. See full methodology.

Market Scope
Page number 298
Base year 2025
Historic period 2020-2024
Forecast period 2026-2030
Growth momentum & CAGR Accelerate at a CAGR of 38.9%
Market growth 2026-2030 USD 724239.7 thousand
Market structure Fragmented
YoY growth 2025-2026(%) 34.8%
Key countries China, Japan, India, South Korea, Australia, Indonesia, US, Canada, Mexico, Germany, France, UK, Italy, Spain, The Netherlands, Saudi Arabia, UAE, South Africa, Turkey, Israel, Brazil, Argentina and Colombia
Competitive landscape Leading Companies, Market Positioning of Companies, Competitive Strategies, and Industry Risks

Request Free Sample

Research Analyst Overview

  • The Solid-state Transformers sector represents a critical technological shift as utility networks transition from passive power delivery to highly interactive energy management systems. Boardroom executives increasingly align corporate product strategies with advanced grid modernization mandates to ensure long-term regulatory compliance. The integration of wide-bandgap materials such as gallium nitride switching components fundamentally enhances power conversion efficiency within restricted spatial environments.
  • Industrial operations deploying these intelligent systems have achieved a 30% reduction in processing downtime caused by external electrical irregularities. Furthermore, the implementation of predictive diagnostic telemetry enables facility managers to transition from reactive repairs to optimized maintenance schedules, drastically minimizing unexpected operational expenditures.
  • Advanced fault isolation mechanisms instantly detect and neutralize short circuits, protecting sensitive downstream manufacturing equipment from catastrophic voltage surges. As decentralized energy generation expands, the necessity for precise harmonic distortion filtering becomes paramount to maintain flawless grid stability.
  • By utilizing a modular multi-level converter architecture, enterprise decision-makers can systematically scale power capacities to match evolving production demands without necessitating complete infrastructure overhauls.

What are the Key Data Covered in this Solid-State Transformers Market Research and Growth Report?

  • What is the expected growth of the Solid-State Transformers Market between 2026 and 2030?

    • USD 724.24 million, at a CAGR of 38.9%

  • What segmentation does the market report cover?

    • The report is segmented by Product (Medium voltage, High voltage, and Low voltage), Type (Three phase, and Single phase), Technology (Silicon carbide based, Silicon based, and Gallium nitride based) and Geography (APAC, North America, Europe, Middle East and Africa, South America)

  • Which regions are analyzed in the report?

    • APAC, North America, Europe, Middle East and Africa and South America

  • What are the key growth drivers and market challenges?

    • Increasing integration of renewable energy sources into global power grids, High initial capital expenditure and manufacturing costs

  • Who are the major players in the Solid-State Transformers Market?

    • ALSTOM SA, CG Power and Industrial Ltd., Delta Electronics Inc., Eaton Corp. Plc, EPC Power Corp., Fuji Electric Co. Ltd., GE Vernova Inc., Hitachi Energy Ltd., Hyosung Heavy Industries Corp., Infineon Technologies AG, Kirloskar Electric Co. Ltd., Mitsubishi Electric Corp., Prolec Energy, Reinhausen GmbH, Schneider Electric SE, SGB-SMIT Group, Siemens Energy AG, Synergy Transformers Pvt. Ltd., Toshiba Corp. and Wolfspeed Inc.

Market Research Insights

  • The Solid-state Transformers market actively facilitates the transition toward decentralized power architectures by replacing rigid electromechanical components with intelligent energy routing systems. Utility operators implementing smart distribution networks experience a 30% reduction in unplanned maintenance costs due to integrated predictive maintenance strategies.
  • The widespread deployment of localized battery storage and ultra-fast electric vehicle chargers requires precise load shifting automation and dynamic pricing synchronization to prevent localized substation overloads. Commercial facilities utilizing these advanced routing nodes report a 22% improvement in overall power usage effectiveness by eliminating redundant alternating current conversion stages, achieving significant substation footprint reduction.
  • Furthermore, continuous grid modernization initiatives drastically enhance operational resilience, enabling automated fault correction sequences that isolate transmission disruptions 40% faster than traditional mechanical circuit breakers while supporting seamless vehicle-to-grid integration.

We can help! Our analysts can customize this solid-state transformers market research report to meet your requirements.

Get in touch

1. Executive Summary

1.1 Market overview

Executive Summary - Chart on Market Overview
Executive Summary - Data Table on Market Overview
Executive Summary - Chart on Global Market Characteristics
Executive Summary - Chart on Market by Geography
Executive Summary - Chart on Market Segmentation by Product
Executive Summary - Chart on Market Segmentation by Type
Executive Summary - Chart on Market Segmentation by Technology
Executive Summary - Chart on Incremental Growth
Executive Summary - Data Table on Incremental Growth
Executive Summary - Chart on Company Market Positioning

2. Technavio Analysis

2.1 Analysis of price sensitivity, lifecycle, customer purchase basket, adoption rates, and purchase criteria

2.2 Criticality of inputs and Factors of differentiation

Chart on Overview on criticality of inputs and factors of differentiation

2.3 Factors of disruption

Chart on Overview on factors of disruption

2.4 Impact of drivers and challenges

Chart on Impact of drivers and challenges in 2025 and 2030

3. Market Landscape

3.1 Market ecosystem

Chart on Parent Market
Data Table on - Parent Market

3.2 Market characteristics

Chart on Market characteristics analysis

3.3 Value chain analysis

Chart on Value chain analysis

4. Market Sizing

4.1 Market definition

Data Table on Offerings of companies included in the market definition

4.2 Market segment analysis

Market segments

4.3 Market size 2025

4.4 Market outlook: Forecast for 2025-2030

Chart on Global - Market size and forecast 2025-2030 ($ thousand)
Data Table on Global - Market size and forecast 2025-2030 ($ thousand)
Chart on Global Market: Year-over-year growth 2025-2030 (%)
Data Table on Global Market: Year-over-year growth 2025-2030 (%)

5. Historic Market Size

5.1 Global Solid-State Transformers Market 2020 - 2024

Historic Market Size - Data Table on Global Solid-State Transformers Market 2020 - 2024 ($ thousand)

5.2 Product segment analysis 2020 - 2024

Historic Market Size - Product Segment 2020 - 2024 ($ thousand)

5.3 Type segment analysis 2020 - 2024

Historic Market Size - Type Segment 2020 - 2024 ($ thousand)

5.4 Technology segment analysis 2020 - 2024

Historic Market Size - Technology Segment 2020 - 2024 ($ thousand)

5.5 Geography segment analysis 2020 - 2024

Historic Market Size - Geography Segment 2020 - 2024 ($ thousand)

5.6 Country segment analysis 2020 - 2024

Historic Market Size - Country Segment 2020 - 2024 ($ thousand)

6. Qualitative Analysis

6.1 Impact of AI on Global Solid-state transformers Market

6.2 Impact of Geopolitical Conflicts on Global Solid-state transformers Market

7. Five Forces Analysis

7.1 Five forces summary

Five forces analysis - Comparison between 2025 and 2030

7.2 Bargaining power of buyers

Bargaining power of buyers - Impact of key factors 2025 and 2030

7.3 Bargaining power of suppliers

Bargaining power of suppliers - Impact of key factors in 2025 and 2030

7.4 Threat of new entrants

Threat of new entrants - Impact of key factors in 2025 and 2030

7.5 Threat of substitutes

Threat of substitutes - Impact of key factors in 2025 and 2030

7.6 Threat of rivalry

Threat of rivalry - Impact of key factors in 2025 and 2030

7.7 Market condition

Chart on Market condition - Five forces 2025 and 2030

8. Market Segmentation by Product

8.1 Market segments

Chart on Product - Market share 2025-2030 (%)
Data Table on Product - Market share 2025-2030 (%)

8.2 Comparison by Product

Chart on Comparison by Product
Data Table on Comparison by Product

8.3 Medium voltage - Market size and forecast 2025-2030

Chart on Medium voltage - Market size and forecast 2025-2030 ($ thousand)
Data Table on Medium voltage - Market size and forecast 2025-2030 ($ thousand)
Chart on Medium voltage - Year-over-year growth 2025-2030 (%)
Data Table on Medium voltage - Year-over-year growth 2025-2030 (%)

8.4 High voltage - Market size and forecast 2025-2030

Chart on High voltage - Market size and forecast 2025-2030 ($ thousand)
Data Table on High voltage - Market size and forecast 2025-2030 ($ thousand)
Chart on High voltage - Year-over-year growth 2025-2030 (%)
Data Table on High voltage - Year-over-year growth 2025-2030 (%)

8.5 Low voltage - Market size and forecast 2025-2030

Chart on Low voltage - Market size and forecast 2025-2030 ($ thousand)
Data Table on Low voltage - Market size and forecast 2025-2030 ($ thousand)
Chart on Low voltage - Year-over-year growth 2025-2030 (%)
Data Table on Low voltage - Year-over-year growth 2025-2030 (%)

8.6 Market opportunity by Product

Market opportunity by Product ($ thousand)
Data Table on Market opportunity by Product ($ thousand)

9. Market Segmentation by Type

9.1 Market segments

Chart on Type - Market share 2025-2030 (%)
Data Table on Type - Market share 2025-2030 (%)

9.2 Comparison by Type

Chart on Comparison by Type
Data Table on Comparison by Type

9.3 Three phase - Market size and forecast 2025-2030

Chart on Three phase - Market size and forecast 2025-2030 ($ thousand)
Data Table on Three phase - Market size and forecast 2025-2030 ($ thousand)
Chart on Three phase - Year-over-year growth 2025-2030 (%)
Data Table on Three phase - Year-over-year growth 2025-2030 (%)

9.4 Single phase - Market size and forecast 2025-2030

Chart on Single phase - Market size and forecast 2025-2030 ($ thousand)
Data Table on Single phase - Market size and forecast 2025-2030 ($ thousand)
Chart on Single phase - Year-over-year growth 2025-2030 (%)
Data Table on Single phase - Year-over-year growth 2025-2030 (%)

9.5 Market opportunity by Type

Market opportunity by Type ($ thousand)
Data Table on Market opportunity by Type ($ thousand)

10. Market Segmentation by Technology

10.1 Market segments

Chart on Technology - Market share 2025-2030 (%)
Data Table on Technology - Market share 2025-2030 (%)

10.2 Comparison by Technology

Chart on Comparison by Technology
Data Table on Comparison by Technology

10.3 Silicon carbide based - Market size and forecast 2025-2030

Chart on Silicon carbide based - Market size and forecast 2025-2030 ($ thousand)
Data Table on Silicon carbide based - Market size and forecast 2025-2030 ($ thousand)
Chart on Silicon carbide based - Year-over-year growth 2025-2030 (%)
Data Table on Silicon carbide based - Year-over-year growth 2025-2030 (%)

10.4 Silicon based - Market size and forecast 2025-2030

Chart on Silicon based - Market size and forecast 2025-2030 ($ thousand)
Data Table on Silicon based - Market size and forecast 2025-2030 ($ thousand)
Chart on Silicon based - Year-over-year growth 2025-2030 (%)
Data Table on Silicon based - Year-over-year growth 2025-2030 (%)

10.5 Gallium nitride based - Market size and forecast 2025-2030

Chart on Gallium nitride based - Market size and forecast 2025-2030 ($ thousand)
Data Table on Gallium nitride based - Market size and forecast 2025-2030 ($ thousand)
Chart on Gallium nitride based - Year-over-year growth 2025-2030 (%)
Data Table on Gallium nitride based - Year-over-year growth 2025-2030 (%)

10.6 Market opportunity by Technology

Market opportunity by Technology ($ thousand)
Data Table on Market opportunity by Technology ($ thousand)

11. Customer Landscape

11.1 Customer landscape overview

Analysis of price sensitivity, lifecycle, customer purchase basket, adoption rates, and purchase criteria

12. Geographic Landscape

12.1 Geographic segmentation

Chart on Market share by geography 2025-2030 (%)
Data Table on Market share by geography 2025-2030 (%)

12.2 Geographic comparison

Chart on Geographic comparison
Data Table on Geographic comparison

12.3 APAC - Market size and forecast 2025-2030

Chart on APAC - Market size and forecast 2025-2030 ($ thousand)
Data Table on APAC - Market size and forecast 2025-2030 ($ thousand)
Chart on APAC - Year-over-year growth 2025-2030 (%)
Data Table on APAC - Year-over-year growth 2025-2030 (%)
Chart on Regional Comparison - APAC
Data Table on Regional Comparison - APAC

12.3.1 China - Market size and forecast 2025-2030

Chart on China - Market size and forecast 2025-2030 ($ thousand)
Data Table on China - Market size and forecast 2025-2030 ($ thousand)
Chart on China - Year-over-year growth 2025-2030 (%)
Data Table on China - Year-over-year growth 2025-2030 (%)

12.3.2 Japan - Market size and forecast 2025-2030

Chart on Japan - Market size and forecast 2025-2030 ($ thousand)
Data Table on Japan - Market size and forecast 2025-2030 ($ thousand)
Chart on Japan - Year-over-year growth 2025-2030 (%)
Data Table on Japan - Year-over-year growth 2025-2030 (%)

12.3.3 India - Market size and forecast 2025-2030

Chart on India - Market size and forecast 2025-2030 ($ thousand)
Data Table on India - Market size and forecast 2025-2030 ($ thousand)
Chart on India - Year-over-year growth 2025-2030 (%)
Data Table on India - Year-over-year growth 2025-2030 (%)

12.3.4 South Korea - Market size and forecast 2025-2030

Chart on South Korea - Market size and forecast 2025-2030 ($ thousand)
Data Table on South Korea - Market size and forecast 2025-2030 ($ thousand)
Chart on South Korea - Year-over-year growth 2025-2030 (%)
Data Table on South Korea - Year-over-year growth 2025-2030 (%)

12.3.5 Australia - Market size and forecast 2025-2030

Chart on Australia - Market size and forecast 2025-2030 ($ thousand)
Data Table on Australia - Market size and forecast 2025-2030 ($ thousand)
Chart on Australia - Year-over-year growth 2025-2030 (%)
Data Table on Australia - Year-over-year growth 2025-2030 (%)

12.3.6 Indonesia - Market size and forecast 2025-2030

Chart on Indonesia - Market size and forecast 2025-2030 ($ thousand)
Data Table on Indonesia - Market size and forecast 2025-2030 ($ thousand)
Chart on Indonesia - Year-over-year growth 2025-2030 (%)
Data Table on Indonesia - Year-over-year growth 2025-2030 (%)

12.4 North America - Market size and forecast 2025-2030

Chart on North America - Market size and forecast 2025-2030 ($ thousand)
Data Table on North America - Market size and forecast 2025-2030 ($ thousand)
Chart on North America - Year-over-year growth 2025-2030 (%)
Data Table on North America - Year-over-year growth 2025-2030 (%)
Chart on Regional Comparison - North America
Data Table on Regional Comparison - North America

12.4.1 US - Market size and forecast 2025-2030

Chart on US - Market size and forecast 2025-2030 ($ thousand)
Data Table on US - Market size and forecast 2025-2030 ($ thousand)
Chart on US - Year-over-year growth 2025-2030 (%)
Data Table on US - Year-over-year growth 2025-2030 (%)

12.4.2 Canada - Market size and forecast 2025-2030

Chart on Canada - Market size and forecast 2025-2030 ($ thousand)
Data Table on Canada - Market size and forecast 2025-2030 ($ thousand)
Chart on Canada - Year-over-year growth 2025-2030 (%)
Data Table on Canada - Year-over-year growth 2025-2030 (%)

12.4.3 Mexico - Market size and forecast 2025-2030

Chart on Mexico - Market size and forecast 2025-2030 ($ thousand)
Data Table on Mexico - Market size and forecast 2025-2030 ($ thousand)
Chart on Mexico - Year-over-year growth 2025-2030 (%)
Data Table on Mexico - Year-over-year growth 2025-2030 (%)

12.5 Europe - Market size and forecast 2025-2030

Chart on Europe - Market size and forecast 2025-2030 ($ thousand)
Data Table on Europe - Market size and forecast 2025-2030 ($ thousand)
Chart on Europe - Year-over-year growth 2025-2030 (%)
Data Table on Europe - Year-over-year growth 2025-2030 (%)
Chart on Regional Comparison - Europe
Data Table on Regional Comparison - Europe

12.5.1 Germany - Market size and forecast 2025-2030

Chart on Germany - Market size and forecast 2025-2030 ($ thousand)
Data Table on Germany - Market size and forecast 2025-2030 ($ thousand)
Chart on Germany - Year-over-year growth 2025-2030 (%)
Data Table on Germany - Year-over-year growth 2025-2030 (%)

12.5.2 France - Market size and forecast 2025-2030

Chart on France - Market size and forecast 2025-2030 ($ thousand)
Data Table on France - Market size and forecast 2025-2030 ($ thousand)
Chart on France - Year-over-year growth 2025-2030 (%)
Data Table on France - Year-over-year growth 2025-2030 (%)

12.5.3 UK - Market size and forecast 2025-2030

Chart on UK - Market size and forecast 2025-2030 ($ thousand)
Data Table on UK - Market size and forecast 2025-2030 ($ thousand)
Chart on UK - Year-over-year growth 2025-2030 (%)
Data Table on UK - Year-over-year growth 2025-2030 (%)

12.5.4 Italy - Market size and forecast 2025-2030

Chart on Italy - Market size and forecast 2025-2030 ($ thousand)
Data Table on Italy - Market size and forecast 2025-2030 ($ thousand)
Chart on Italy - Year-over-year growth 2025-2030 (%)
Data Table on Italy - Year-over-year growth 2025-2030 (%)

12.5.5 Spain - Market size and forecast 2025-2030

Chart on Spain - Market size and forecast 2025-2030 ($ thousand)
Data Table on Spain - Market size and forecast 2025-2030 ($ thousand)
Chart on Spain - Year-over-year growth 2025-2030 (%)
Data Table on Spain - Year-over-year growth 2025-2030 (%)

12.5.6 The Netherlands - Market size and forecast 2025-2030

Chart on The Netherlands - Market size and forecast 2025-2030 ($ thousand)
Data Table on The Netherlands - Market size and forecast 2025-2030 ($ thousand)
Chart on The Netherlands - Year-over-year growth 2025-2030 (%)
Data Table on The Netherlands - Year-over-year growth 2025-2030 (%)

12.6 Middle East and Africa - Market size and forecast 2025-2030

Chart on Middle East and Africa - Market size and forecast 2025-2030 ($ thousand)
Data Table on Middle East and Africa - Market size and forecast 2025-2030 ($ thousand)
Chart on Middle East and Africa - Year-over-year growth 2025-2030 (%)
Data Table on Middle East and Africa - Year-over-year growth 2025-2030 (%)
Chart on Regional Comparison - Middle East and Africa
Data Table on Regional Comparison - Middle East and Africa

12.6.1 Saudi Arabia - Market size and forecast 2025-2030

Chart on Saudi Arabia - Market size and forecast 2025-2030 ($ thousand)
Data Table on Saudi Arabia - Market size and forecast 2025-2030 ($ thousand)
Chart on Saudi Arabia - Year-over-year growth 2025-2030 (%)
Data Table on Saudi Arabia - Year-over-year growth 2025-2030 (%)

12.6.2 UAE - Market size and forecast 2025-2030

Chart on UAE - Market size and forecast 2025-2030 ($ thousand)
Data Table on UAE - Market size and forecast 2025-2030 ($ thousand)
Chart on UAE - Year-over-year growth 2025-2030 (%)
Data Table on UAE - Year-over-year growth 2025-2030 (%)

12.6.3 South Africa - Market size and forecast 2025-2030

Chart on South Africa - Market size and forecast 2025-2030 ($ thousand)
Data Table on South Africa - Market size and forecast 2025-2030 ($ thousand)
Chart on South Africa - Year-over-year growth 2025-2030 (%)
Data Table on South Africa - Year-over-year growth 2025-2030 (%)

12.6.4 Turkey - Market size and forecast 2025-2030

Chart on Turkey - Market size and forecast 2025-2030 ($ thousand)
Data Table on Turkey - Market size and forecast 2025-2030 ($ thousand)
Chart on Turkey - Year-over-year growth 2025-2030 (%)
Data Table on Turkey - Year-over-year growth 2025-2030 (%)

12.6.5 Israel - Market size and forecast 2025-2030

Chart on Israel - Market size and forecast 2025-2030 ($ thousand)
Data Table on Israel - Market size and forecast 2025-2030 ($ thousand)
Chart on Israel - Year-over-year growth 2025-2030 (%)
Data Table on Israel - Year-over-year growth 2025-2030 (%)

12.7 South America - Market size and forecast 2025-2030

Chart on South America - Market size and forecast 2025-2030 ($ thousand)
Data Table on South America - Market size and forecast 2025-2030 ($ thousand)
Chart on South America - Year-over-year growth 2025-2030 (%)
Data Table on South America - Year-over-year growth 2025-2030 (%)
Chart on Regional Comparison - South America
Data Table on Regional Comparison - South America

12.7.1 Brazil - Market size and forecast 2025-2030

Chart on Brazil - Market size and forecast 2025-2030 ($ thousand)
Data Table on Brazil - Market size and forecast 2025-2030 ($ thousand)
Chart on Brazil - Year-over-year growth 2025-2030 (%)
Data Table on Brazil - Year-over-year growth 2025-2030 (%)

12.7.2 Argentina - Market size and forecast 2025-2030

Chart on Argentina - Market size and forecast 2025-2030 ($ thousand)
Data Table on Argentina - Market size and forecast 2025-2030 ($ thousand)
Chart on Argentina - Year-over-year growth 2025-2030 (%)
Data Table on Argentina - Year-over-year growth 2025-2030 (%)

12.7.3 Colombia - Market size and forecast 2025-2030

Chart on Colombia - Market size and forecast 2025-2030 ($ thousand)
Data Table on Colombia - Market size and forecast 2025-2030 ($ thousand)
Chart on Colombia - Year-over-year growth 2025-2030 (%)
Data Table on Colombia - Year-over-year growth 2025-2030 (%)

12.8 Market opportunity by geography

Market opportunity by geography ($ thousand)
Data Tables on Market opportunity by geography ($ thousand)

13. Drivers, Challenges, and Opportunity

13.1 Market drivers

Increasing integration of renewable energy sources into global power grids
Rapid expansion of electric vehicle fast charging networks
Modernization of aging grid infrastructure and transition to smart grids

13.2 Market challenges

High initial capital expenditure and manufacturing costs
Technological complexity and reliability concerns in extreme environments
Inadequate standardization and fragmented regulatory frameworks

13.3 Impact of drivers and challenges

Impact of drivers and challenges in 2025 and 2030

13.4 Market opportunities

Advancements in high-frequency traction transformers for railway sector
Integration of solid-state transformers in high-density data centers
Implementation in industrial microgrids for energy-intensive manufacturing

14. Competitive Landscape

14.1 Overview

14.2

Overview on criticality of inputs and factors of differentiation

14.3 Landscape disruption

Overview on factors of disruption

14.4 Industry risks

Impact of key risks on business

15. Competitive Analysis

15.1 Companies profiled

Companies covered

15.2 Company ranking index

15.3 Market positioning of companies

Matrix on companies position and classification

15.4 ALSTOM SA

ALSTOM SA - Overview
ALSTOM SA - Business segments
ALSTOM SA - Key offerings
ALSTOM SA - Segment focus
SWOT

15.5 CG Power and Industrial Ltd.

CG Power and Industrial Ltd. - Overview
CG Power and Industrial Ltd. - Business segments
CG Power and Industrial Ltd. - Key offerings
CG Power and Industrial Ltd. - Segment focus
SWOT

15.6 Delta Electronics Inc.

Delta Electronics Inc. - Overview
Delta Electronics Inc. - Business segments
Delta Electronics Inc. - Key offerings
Delta Electronics Inc. - Segment focus
SWOT

15.7 Eaton Corp. Plc

Eaton Corp. Plc - Overview
Eaton Corp. Plc - Business segments
Eaton Corp. Plc - Key news
Eaton Corp. Plc - Key offerings
Eaton Corp. Plc - Segment focus
SWOT

15.8 Fuji Electric Co. Ltd.

Fuji Electric Co. Ltd. - Overview
Fuji Electric Co. Ltd. - Business segments
Fuji Electric Co. Ltd. - Key offerings
Fuji Electric Co. Ltd. - Segment focus
SWOT

15.9 GE Vernova Inc.

GE Vernova Inc. - Overview
GE Vernova Inc. - Business segments
GE Vernova Inc. - Key offerings
GE Vernova Inc. - Segment focus
SWOT

15.10 Hitachi Energy Ltd.

Hitachi Energy Ltd. - Overview
Hitachi Energy Ltd. - Product / Service
Hitachi Energy Ltd. - Key offerings
SWOT

15.11 Hyosung Heavy Industries Corp.

Hyosung Heavy Industries Corp. - Overview
Hyosung Heavy Industries Corp. - Product / Service
Hyosung Heavy Industries Corp. - Key offerings
SWOT

15.12 Mitsubishi Electric Corp.

Mitsubishi Electric Corp. - Overview
Mitsubishi Electric Corp. - Business segments
Mitsubishi Electric Corp. - Key offerings
Mitsubishi Electric Corp. - Segment focus
SWOT

15.13 Prolec Energy

Prolec Energy - Overview
Prolec Energy - Product / Service
Prolec Energy - Key offerings
SWOT

15.14 Schneider Electric SE

Schneider Electric SE - Overview
Schneider Electric SE - Business segments
Schneider Electric SE - Key news
Schneider Electric SE - Key offerings
Schneider Electric SE - Segment focus
SWOT

15.15 SGB-SMIT Group

SGB-SMIT Group - Overview
SGB-SMIT Group - Product / Service
SGB-SMIT Group - Key offerings
SWOT

15.16 Siemens Energy AG

Siemens Energy AG - Overview
Siemens Energy AG - Business segments
Siemens Energy AG - Key news
Siemens Energy AG - Key offerings
Siemens Energy AG - Segment focus
SWOT

15.17 Toshiba Corp.

Toshiba Corp. - Overview
Toshiba Corp. - Business segments
Toshiba Corp. - Key offerings
Toshiba Corp. - Segment focus
SWOT

15.18 Wolfspeed Inc.

Wolfspeed Inc. - Overview
Wolfspeed Inc. - Business segments
Wolfspeed Inc. - Key offerings
Wolfspeed Inc. - Segment focus
SWOT

16. Appendix

16.1 Scope of the report

Market definition
Objectives
Notes and caveats

16.2 Inclusions and exclusions checklist

Inclusions checklist
Exclusions checklist

16.3 Currency conversion rates for US$

16.4 Research methodology

16.5 Data procurement

Information sources

16.6 Data validation

16.7 Validation techniques employed for market sizing

16.8 Data synthesis

16.9 360 degree market analysis

16.10 List of abbreviations

Research Methodology

Technavio presents a detailed picture of the market by way of study, synthesis, and summation of data from multiple sources. The analysts have presented the various facets of the market with a particular focus on identifying the key industry influencers. The data thus presented is comprehensive, reliable, and the result of extensive research, both primary and secondary.

INFORMATION SOURCES

Primary sources

  • Manufacturers and suppliers
  • Channel partners
  • Industry experts
  • Strategic decision makers

Secondary sources

  • Industry journals and periodicals
  • Government data
  • Financial reports of key industry players
  • Historical data
  • Press releases

DATA ANALYSIS

Data Synthesis

  • Collation of data
  • Estimation of key figures
  • Analysis of derived insights

Data Validation

  • Triangulation with data models
  • Reference against proprietary databases
  • Corroboration with industry experts

REPORT WRITING

Qualitative

  • Market drivers
  • Market challenges
  • Market trends
  • Five forces analysis

Quantitative

  • Market size and forecast
  • Market segmentation
  • Geographical insights
  • Competitive landscape

Interested in this report?

Get your sample now to see our research methodology and insights!

Download Now

Frequently Asked Questions

Solid-State Transformers market growth will increase by USD 724239.7 thousand thousand during 2026-2030.

The Solid-State Transformers market is expected to grow at a CAGR of 38.9% during 2026-2030.

Solid-State Transformers market is segmented by Product (Medium voltage, High voltage, Low voltage) Type (Three phase, Single phase) Technology (Silicon carbide based, Silicon based, Gallium nitride based)

ALSTOM SA, CG Power and Industrial Ltd., Delta Electronics Inc., Eaton Corp. Plc, EPC Power Corp., Fuji Electric Co. Ltd., GE Vernova Inc., Hitachi Energy Ltd., Hyosung Heavy Industries Corp., Infineon Technologies AG, Kirloskar Electric Co. Ltd., Mitsubishi Electric Corp., Prolec Energy, Reinhausen GmbH, Schneider Electric SE, SGB-SMIT Group, Siemens Energy AG, Synergy Transformers Pvt. Ltd., Toshiba Corp., Wolfspeed Inc. are a few of the key vendors in the Solid-State Transformers market.

APAC will register the highest growth rate of 38.8% among the other regions. Therefore, the Solid-State Transformers market in APAC is expected to garner significant business opportunities for the vendors during the forecast period.

China, Japan, India, South Korea, Australia, Indonesia, US, Canada, Mexico, Germany, France, UK, Italy, Spain, The Netherlands, Saudi Arabia, UAE, South Africa, Turkey, Israel, Brazil, Argentina, Colombia

  • Increasing integration of renewable energy sources into global power grids is the driving factor this market.

The Solid-State Transformers market vendors should focus on grabbing business opportunities from the Product segment as it accounted for the largest market share in the base year.
RIA - Research AI Assistant
Ask RIA
