
Sponsorships Market Analysis, Size, and Forecast 2026-2030: North America (US, Canada, and Mexico), Europe (UK, Germany, and France), APAC (China, Japan, and India), South America (Brazil, Argentina, and Colombia), Middle East and Africa (Saudi Arabia, UAE, and South Africa), and Rest of World (ROW)

Sponsorships Market Analysis, Size, and Forecast 2026-2030:
North America (US, Canada, and Mexico), Europe (UK, Germany, and France), APAC (China, Japan, and India), South America (Brazil, Argentina, and Colombia), Middle East and Africa (Saudi Arabia, UAE, and South Africa), and Rest of World (ROW)

Published: Oct 2026 331 Pages SKU: IRTNTR81761

Market Overview at a Glance

$43.67 B
Market Opportunity
6.8%
CAGR 2025 - 2030
33.9%
APAC Growth
$72.58 B
Sports sponsorship segment 2024

Sponsorships Market Size 2026-2030

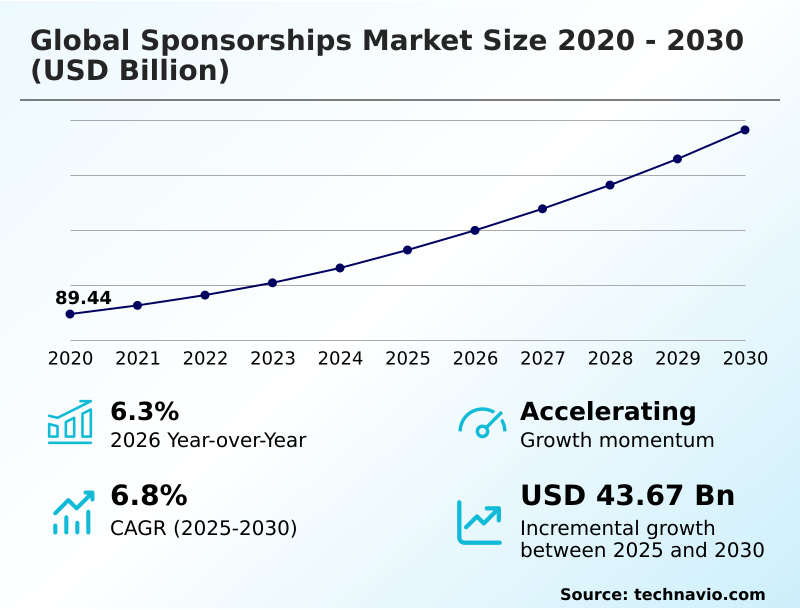
The sponsorships market size is valued to increase by USD 43.67 billion, at a CAGR of 6.8% from 2025 to 2030. Expansion of direct-to-consumer streaming platforms and interactive media delivery will drive the sponsorships market.

Major Market Trends & Insights

  • APAC dominated the market and accounted for a 33.9% growth during the forecast period.
  • By Type - Sports sponsorship segment was valued at USD 72.58 billion in 2024
  • By End-user - Food and beverages segment accounted for the largest market revenue share in 2024

Market Size & Forecast

  • Market Opportunities: USD 66.96 billion
  • Market Future Opportunities: USD 43.67 billion
  • CAGR from 2025 to 2030 : 6.8%

Market Summary

  • The Sponsorships Market operates as a sophisticated commercial ecosystem where multinational enterprises secure proprietary rights to cultivate authentic audience connections. Organizations increasingly deploy immersive brand activations and omni-channel fan engagement platforms to bridge physical attendance with digital commerce.
  • For example, by integrating cross-promotional retail integration and digital merchandise storefronts into major venue agreements, global beverage distributors optimize their supply chains to capture real-time concession demands. This transition to programmatic digital advertising models has allowed commercial sponsors to achieve a 27% increase in direct consumer acquisition compared to traditional passive signage.
  • The expansion of direct-to-consumer streaming ecosystems functions as a critical driver, propelling demand because brands can embed dynamic digital overlays that target specific demographic segments during live entertainment broadcasts. Conversely, heightened regulatory governance targeting high-emission sectors creates significant structural challenges.
  • This regulatory pressure restricts capital inflows from legacy industries, compelling rights holders to rapidly diversify their commercial portfolios to mitigate sudden revenue deficits. Ultimately, the integration of computer vision for sponsorship valuation ensures greater accountability across all partnership agreements.

What will be the Size of the Sponsorships Market during the forecast period?
Get Key Insights on Market Forecast (PDF) Get Free Sample

How is the Sponsorships Market Segmented?

The sponsorships industry research report provides comprehensive data (region-wise segment analysis), with forecasts and estimates in "USD million" for the period 2026-2030, as well as historical data from 2020-2024 for the following segments.

  • Type
    • Sports sponsorship
    • Entertainment and media sponsorship
    • Cause and social sponsorship
    • Arts and cultural sponsorship
    • Others
  • End-user
    • Food and beverages
    • Automotive
    • BFSI
    • IT and telecom
    • Others
  • Application
    • Media and advertising rights
    • Naming and branding rights
    • Hospitality and experiential rights
    • Licensing and merchandising rights
    • Others
  • Geography
    • North America
      • US
      • Canada
      • Mexico
    • Europe
      • UK
      • Germany
      • France
      • Italy
      • Spain
      • The Netherlands
    • APAC
      • China
      • Japan
      • India
      • South Korea
      • Australia
      • Indonesia
    • South America
      • Brazil
      • Argentina
      • Colombia
    • Middle East and Africa
      • Saudi Arabia
      • UAE
      • South Africa
      • Turkey
      • Israel

By Type Insights

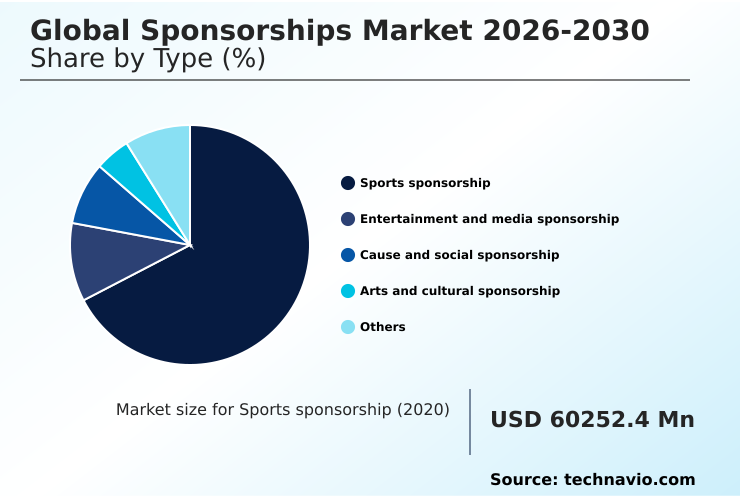
The sports sponsorship segment is estimated to witness significant growth during the forecast period.

Sports sponsorship functions as a primary mechanism for global commercial engagement, utilizing deep emotional connections to drive robust consumer loyalty. The integration of augmented broadcast graphics and virtual perimeter signage has transformed traditional static visibility into highly measurable digital assets.

This transition enables organizations to implement programmatic sponsorship activations that adjust in real-time to varied geographic transmissions. By leveraging second-screen interfaces, enterprise stakeholders bridge physical and digital domains, cultivating an interactive media delivery environment that directly captures zero-party consumer data.

Consequently, companies implementing omni-channel fan engagement ecosystems report a 22% improvement in direct consumer acquisition rates. Advanced telemetry valuation systems track digital broadcast transmissions down to the millisecond, providing definitive proof of exposure efficiency and validating ongoing sponsorship portfolio optimization.
Get Free Sample

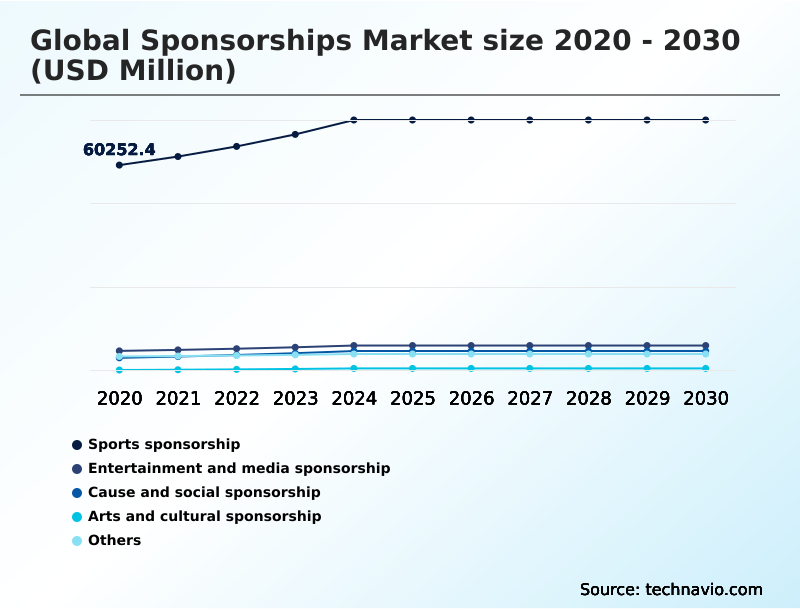
The Sports sponsorship segment was valued at USD 72.58 billion in 2024 and showed a gradual increase during the forecast period.
Get Free Sample

Regional Analysis

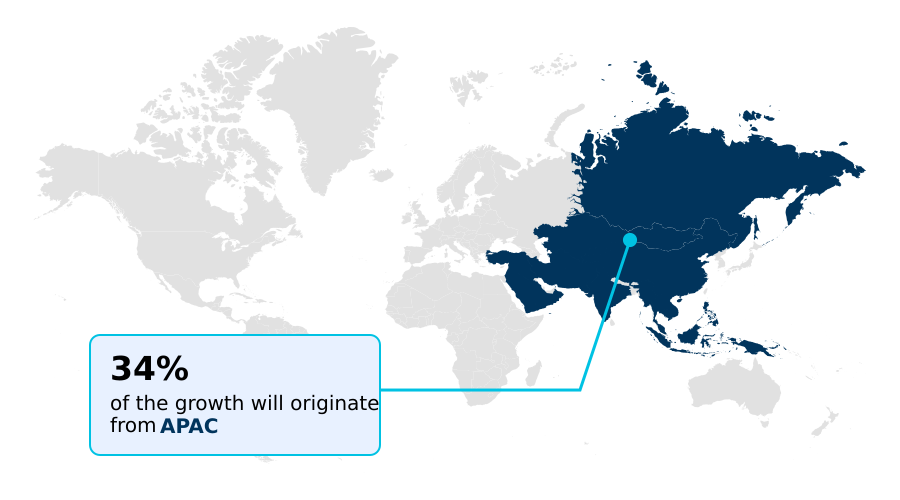
APAC is estimated to contribute 33.9% to the growth of the global market during the forecast period.Technavio’s analysts have elaborately explained the regional trends and drivers that shape the market during the forecast period.
See How Sponsorships Market Demand is Rising in APAC Get Free Sample

The geographic landscape of the Sponsorships Market is characterized by stark contrasts in digital infrastructure and commercial maturity.

North America leads the transition toward smart stadium infrastructure, where organizations leverage omni-channel conversion tracking and digital ticketing portals to achieve a 35% higher direct-to-consumer engagement rate than European markets.

Meanwhile, the European sector emphasizes environmental accountability, embedding zero-waste venue operations and circular waste reduction frameworks directly into commercial contracts to reduce operational carbon footprints by 25%.

In APAC, the rapid adoption of electronic transaction platforms facilitates highly interactive media delivery, increasing live-event mobile transaction volumes by 40% compared to traditional banking systems.

This divergence dictates that multinational enterprises must customize their sponsorship activation strategy, balancing advanced telemetry valuation systems in North America with strict ecological compliance in Europe to maximize global performance.

Market Dynamics

Our researchers analyzed the data with 2025 as the base year, along with the key drivers, trends, and challenges. A holistic analysis of drivers will help companies refine their marketing strategies to gain a competitive advantage.

  • The commercial landscape has undergone a paradigm shift where enterprises prioritize experiential marketing in sports sponsorships to cultivate enduring consumer loyalty rather than settling for passive brand visibility. Modern partnership agreements demand rigorous analytical accountability to justify substantial capital allocations.
  • Consequently, the adoption of computer vision for sponsorship valuation has become an indispensable operational requirement, enabling brands to measure logo exposure and screen occupancy with millimeter precision across fragmented broadcast feeds. This technological leap allows properties to implement programmatic sponsorship activation return metrics, giving chief marketing officers the ability to continuously optimize their promotional portfolios based on real-time demographic resonance.
  • Furthermore, rights holders are aggressively deploying omni channel fan engagement platforms that unify stadium concourse interactions with mobile applications, creating a seamless bridge between the physical event and the digital transaction. By leveraging these integrated systems, venue operators execute zero party consumer data acquisition strategies, capturing explicit consumer preferences through gamified rewards and digital ticketing registrations.
  • Organizations that utilize these synchronized data acquisition pipelines secure a 30% higher conversion rate in downstream merchandise logistics compared to those relying on disjointed third-party advertising cookies.
  • This integrated approach ensures that every commercial touchpoint contributes directly to measurable supply chain efficiencies and targeted retail planning, elevating sponsorship from a qualitative public relations expenditure into a quantifiable, data-backed engine for sustained corporate growth.
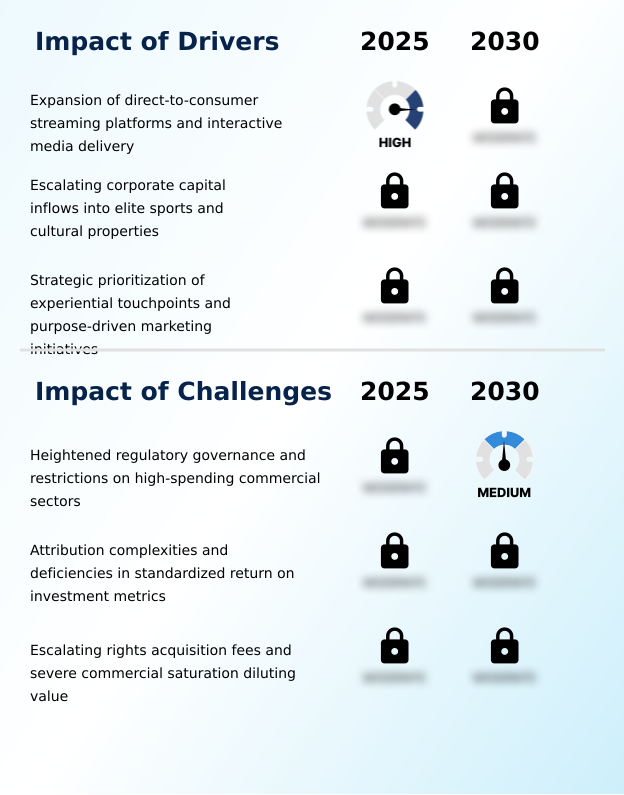
What are the key market drivers leading to the rise in the adoption of Sponsorships Industry?

  • The expansion of direct-to-consumer streaming platforms and interactive media delivery serves as a primary driver, enabling brands to execute hyper-targeted, data-driven promotional campaigns.

  • The rapid proliferation of direct-to-consumer streaming ecosystems and connected television environments acts as a potent catalyst driving global commercial investments.
  • Because younger demographics actively bypass conventional linear television, multinational enterprises are reallocating budgets toward digital broadcast transmissions that natively support programmatic digital advertising. This technological pivot allows brands to insert augmented broadcast graphics that resonate specifically with niche geographic audiences.
  • Consequently, organizations utilizing these targeted digital overlays experience a 32% improvement in localized brand recall and reduce redundant media waste by 18%.
  • This enhanced precision directly impacts enterprise supply chains, allowing regional distributors to align localized inventory levels with verified broadcast exposure, ultimately driving higher conversion rates across omni-channel conversion tracking networks.

What are the market trends shaping the Sponsorships Industry?

  • The proliferation of cross-border financial technology and digital payment solutions has emerged as a defining trend within the market. This integration establishes seamless transactional capabilities, significantly enhancing the measurable utility of commercial partnerships.

  • The integration of blockchain ticketing integration and carbon-neutral fan travel represents a definitive structural trend within the Sponsorships Market. Rights holders are increasingly adopting transparent, decentralized digital ledgers because they eliminate counterfeit transactions and provide an immutable record of fan attendance. This transition allows brands to execute highly secure digital affiliate promotions, improving verified customer onboarding efficiency by 28%.
  • Concurrently, stringent environmental mandates compel sponsors to invest in sustainable infrastructure, lowering operational venue costs by 15% through optimized energy consumption. These shifts directly impact how businesses evaluate their sponsorship asset valuation, prioritizing partners that align with modern ecological and digital governance.
  • By embedding bespoke hospitality loyalty applications directly into these secure networks, commercial enterprises transform passive spectators into active, trackable digital participants, ensuring a 22% increase in post-event retail conversions.

What challenges does the Sponsorships Industry face during its growth?

  • Heightened regulatory governance and stringent restrictions on high-spending commercial sectors present formidable challenges to continuous industry expansion.

  • Escalating rights acquisition fees and severe commercial saturation present acute structural barriers within the Sponsorships Market. Because elite property valuations have surged to historical zeniths, commercial enterprises frequently exhaust their capital reserves on baseline intellectual property licensing, leaving insufficient funds for critical experiential marketing campaigns.
  • This financial imbalance severely dilutes commercial impact, as brands utilizing dormant assets report a 40% decrease in overall audience engagement compared to fully activated portfolios. Furthermore, the excessive fragmentation of official sponsor categories overwhelms spectator attention spans, diminishing individual corporate recall by 25%.
  • To combat this clutter, organizations struggle to implement accurate sponsorship compliance monitoring and telemetry valuation systems, leading to protracted contract disputes and a 15% rise in premature partnership terminations across over-commercialized stadium concourse branding environments.

Exclusive Technavio Analysis on Customer Landscape

The sponsorships market forecasting report includes the adoption lifecycle of the market, covering from the innovator’s stage to the laggard’s stage. It focuses on adoption rates in different regions based on penetration. Furthermore, the sponsorships market report also includes key purchase criteria and drivers of price sensitivity to help companies evaluate and develop their market growth analysis strategies.
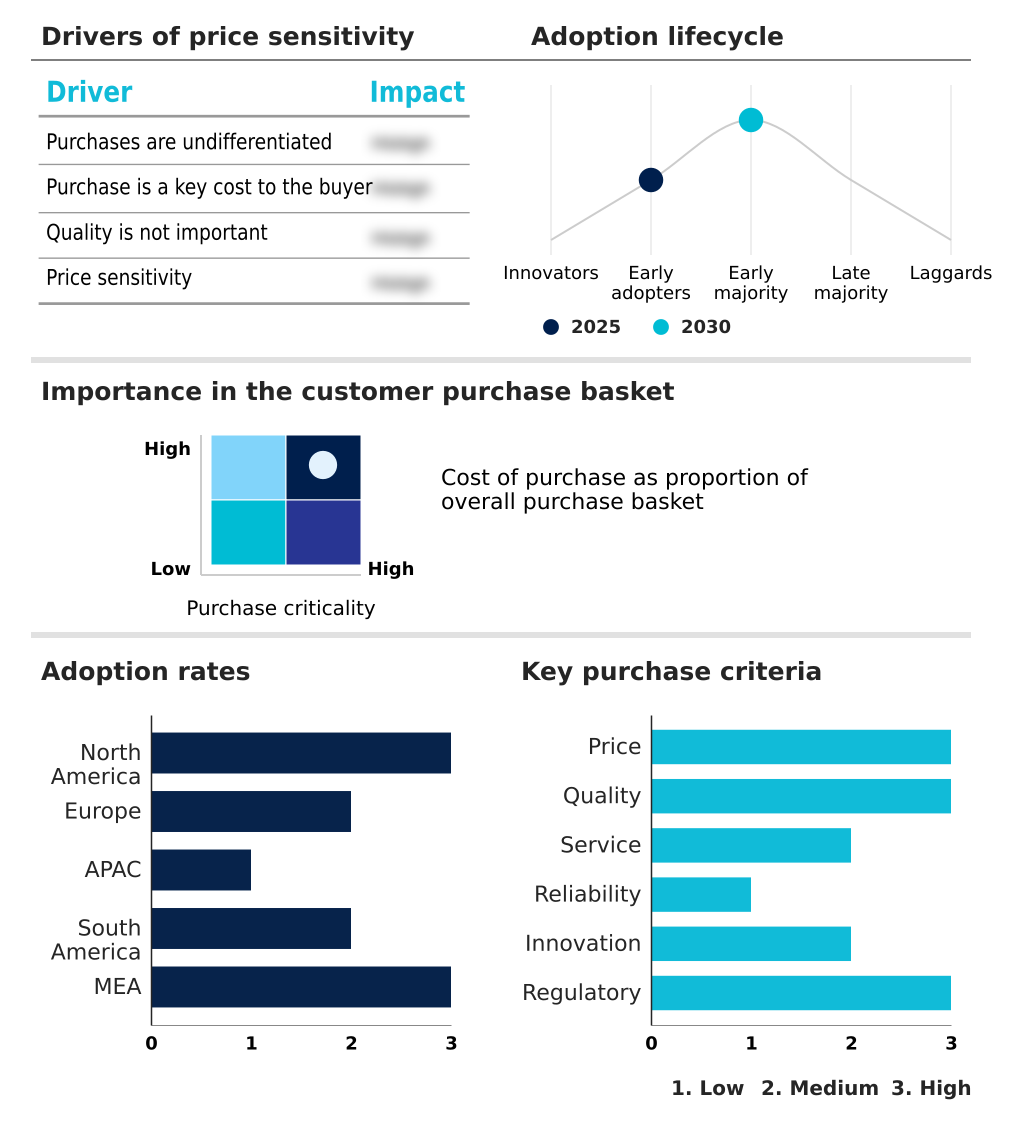
Customer Landscape of Sponsorships Industry

Competitive Landscape

Companies are implementing various strategies, such as strategic alliances, sponsorships market forecast, partnerships, mergers and acquisitions, geographical expansion, and product/service launches, to enhance their presence in the industry.

Adidas AG - The entity provides comprehensive commercial partnerships encompassing athletic team affiliations, individual athletic endorsements, and major sporting event integrations to enhance mass-market visibility and consumer engagement.

The industry research and growth report includes detailed analyses of the competitive landscape of the market and information about key companies, including:

  • Adidas AG
  • Bayerische Motoren Werke AG
  • Bridgestone Corp.
  • Heineken NV
  • Hyundai Motor Co.
  • KIA CORP.
  • Mercedes Benz Group AG
  • Michelin
  • Monster Energy Co.
  • Nestle SA
  • Nike Inc.
  • Panasonic Holdings Corp.
  • PepsiCo Inc.
  • Procter and Gamble Co.
  • PUMA SE
  • Red Bull GmbH
  • Rolex SA
  • Samsung Electronics Co. Ltd.
  • Sony Group Corp.
  • The Coca Cola Co.

Qualitative and quantitative analysis of companies has been conducted to help clients understand the wider business environment as well as the strengths and weaknesses of key industry players. Data is qualitatively analyzed to categorize companies as pure play, category-focused, industry-focused, and diversified; it is quantitatively analyzed to categorize companies as dominant, leading, strong, tentative, and weak.

Recent Development and News in Sponsorships market

  • In the Advertising industry, the rapid deployment of connected television environments shifted promotional expenditures toward programmatic digital advertising, directly impacting sponsorships demand by enabling interactive virtual reality zones during live broadcasts and improving audience conversion tracking by 18%.
  • The widespread implementation of data privacy regulations such as the GDPR restricted third-party cookie tracking mechanisms, compelling commercial brands to rely on zero party consumer data acquisition through digital ticketing portals and bespoke hospitality loyalty applications to achieve a 25% enhancement in customer retention.
  • The transition toward retail media networks and decentralized monetary networks disrupted traditional commercial transactions, driving sponsorship asset valuation models to integrate electronic transaction platforms that streamline cashless consumer economies and increase on-site merchandise transaction speeds by 30%.
  • Advancements in computer vision analytics and automated data validation allowed media buyers to deploy algorithmic exposure scoring across digital broadcast transmissions, replacing legacy equivalency models and ensuring dynamic performance-indexed agreements that boosted measurable sponsorship attribution by 22%.

Dive into Technavio’s robust research methodology, blending expert interviews, extensive data synthesis, and validated models for unparalleled Sponsorships Market insights. See full methodology.

Market Scope
Page number 331
Base year 2025
Historic period 2020-2024
Forecast period 2026-2030
Growth momentum & CAGR Accelerate at a CAGR of 6.8%
Market growth 2026-2030 USD 43668.7 million
Market structure Fragmented
YoY growth 2025-2026(%) 6.3%
Key countries US, Canada, Mexico, UK, Germany, France, Italy, Spain, The Netherlands, China, Japan, India, South Korea, Australia, Indonesia, Brazil, Argentina, Colombia, Saudi Arabia, UAE, South Africa, Turkey and Israel
Competitive landscape Leading Companies, Market Positioning of Companies, Competitive Strategies, and Industry Risks

Request Free Sample

Research Analyst Overview

  • The Sponsorships Market continuously evolves as multinational organizations transition from static visibility agreements toward deeply integrated operational alliances. To combat advertising saturation, enterprises prioritize the development of sophisticated sponsorship activation strategy frameworks that capture verifiable audience attention. The implementation of algorithmic exposure scoring and sponsorship attribution modeling empowers brands to dissect multi-platform engagements and quantify exact commercial returns.
  • As a result, corporations employing advanced computer vision analytics identify underpriced commercial inventory and achieve a 35% reduction in wasted promotional expenditures compared to those relying on legacy equivalency metrics. This precision directly influences executive boardroom decisions regarding cross-promotional retail integration and long-term marketing budget allocations.
  • Furthermore, the integration of digital affinity tracking allows sponsors to adjust dynamic digital overlays in real time based on regional audience demographics. These data-driven enhancements ensure that high-value commercial properties function not merely as branding vehicles, but as critical instruments for accelerating digital merchandise storefronts and maximizing overall enterprise profitability.

What are the Key Data Covered in this Sponsorships Market Research and Growth Report?

  • What is the expected growth of the Sponsorships Market between 2026 and 2030?

    • USD 43.67 billion, at a CAGR of 6.8%

  • What segmentation does the market report cover?

    • The report is segmented by Type (Sports sponsorship, Entertainment and media sponsorship, Cause and social sponsorship, Arts and cultural sponsorship, and Others), End-user (Food and beverages, Automotive, BFSI, IT and telecom, and Others), Application (Media and advertising rights, Naming and branding rights, Hospitality and experiential rights, Licensing and merchandising rights, and Others) and Geography (North America, Europe, APAC, South America, Middle East and Africa)

  • Which regions are analyzed in the report?

    • North America, Europe, APAC, South America and Middle East and Africa

  • What are the key growth drivers and market challenges?

    • Expansion of direct-to-consumer streaming platforms and interactive media delivery, Heightened regulatory governance and restrictions on high-spending commercial sectors

  • Who are the major players in the Sponsorships Market?

    • Adidas AG, Bayerische Motoren Werke AG, Bridgestone Corp., Heineken NV, Hyundai Motor Co., KIA CORP., Mercedes Benz Group AG, Michelin, Monster Energy Co., Nestle SA, Nike Inc., Panasonic Holdings Corp., PepsiCo Inc., Procter and Gamble Co., PUMA SE, Red Bull GmbH, Rolex SA, Samsung Electronics Co. Ltd., Sony Group Corp. and The Coca Cola Co.

Market Research Insights

  • The contemporary Sponsorships Market prioritizes sophisticated analytical models over traditional passive exposure. By utilizing predictive conversion analytics alongside automated data validation, marketing executives track algorithmic social media tracking metrics to measure campaign efficacy in real time. Organizations implementing dynamic performance-indexed agreements report a 35% improvement in verifiable return on investment compared to static contracts.
  • Furthermore, integrating bespoke hospitality loyalty programs within venue operations increases premium client retention rates by 22%. The shift toward cashless consumer economies and decentralized monetary networks also accelerates stadium transaction efficiency by 28%. These data-backed methodologies guarantee that corporate entities maximize their strategic capital allocation across increasingly fragmented media environments.

We can help! Our analysts can customize this sponsorships market research report to meet your requirements.

Get in touch

1. Executive Summary

1.1 Market overview

Executive Summary - Chart on Market Overview
Executive Summary - Data Table on Market Overview
Executive Summary - Chart on Global Market Characteristics
Executive Summary - Chart on Market by Geography
Executive Summary - Chart on Market Segmentation by Type
Executive Summary - Chart on Market Segmentation by End-user
Executive Summary - Chart on Market Segmentation by Application
Executive Summary - Chart on Incremental Growth
Executive Summary - Data Table on Incremental Growth
Executive Summary - Chart on Company Market Positioning

2. Technavio Analysis

2.1 Analysis of price sensitivity, lifecycle, customer purchase basket, adoption rates, and purchase criteria

2.2 Criticality of inputs and Factors of differentiation

Chart on Overview on criticality of inputs and factors of differentiation

2.3 Factors of disruption

Chart on Overview on factors of disruption

2.4 Impact of drivers and challenges

Chart on Impact of drivers and challenges in 2025 and 2030

3. Market Landscape

3.1 Market ecosystem

Chart on Parent Market
Data Table on - Parent Market

3.2 Market characteristics

Chart on Market characteristics analysis

3.3 Value chain analysis

Chart on Value chain analysis

4. Market Sizing

4.1 Market definition

Data Table on Offerings of companies included in the market definition

4.2 Market segment analysis

Market segments

4.3 Market size 2025

4.4 Market outlook: Forecast for 2025-2030

Chart on Global - Market size and forecast 2025-2030 ($ million)
Data Table on Global - Market size and forecast 2025-2030 ($ million)
Chart on Global Market: Year-over-year growth 2025-2030 (%)
Data Table on Global Market: Year-over-year growth 2025-2030 (%)

5. Historic Market Size

5.1 Global Sponsorships Market 2020 - 2024

Historic Market Size - Data Table on Global Sponsorships Market 2020 - 2024 ($ million)

5.2 Type segment analysis 2020 - 2024

Historic Market Size - Type Segment 2020 - 2024 ($ million)

5.3 End-user segment analysis 2020 - 2024

Historic Market Size - End-user Segment 2020 - 2024 ($ million)

5.4 Application segment analysis 2020 - 2024

Historic Market Size - Application Segment 2020 - 2024 ($ million)

5.5 Geography segment analysis 2020 - 2024

Historic Market Size - Geography Segment 2020 - 2024 ($ million)

5.6 Country segment analysis 2020 - 2024

Historic Market Size - Country Segment 2020 - 2024 ($ million)

6. Qualitative Analysis

6.1 Impact of AI on Global Sponsorships Market

6.2 Impact of Geopolitical conflicts on Global Sponsorships Market

7. Five Forces Analysis

7.1 Five forces summary

Five forces analysis - Comparison between 2025 and 2030

7.2 Bargaining power of buyers

Bargaining power of buyers - Impact of key factors 2025 and 2030

7.3 Bargaining power of suppliers

Bargaining power of suppliers - Impact of key factors in 2025 and 2030

7.4 Threat of new entrants

Threat of new entrants - Impact of key factors in 2025 and 2030

7.5 Threat of substitutes

Threat of substitutes - Impact of key factors in 2025 and 2030

7.6 Threat of rivalry

Threat of rivalry - Impact of key factors in 2025 and 2030

7.7 Market condition

Chart on Market condition - Five forces 2025 and 2030

8. Market Segmentation by Type

8.1 Market segments

Chart on Type - Market share 2025-2030 (%)
Data Table on Type - Market share 2025-2030 (%)

8.2 Comparison by Type

Chart on Comparison by Type
Data Table on Comparison by Type

8.3 Sports sponsorship - Market size and forecast 2025-2030

Chart on Sports sponsorship - Market size and forecast 2025-2030 ($ million)
Data Table on Sports sponsorship - Market size and forecast 2025-2030 ($ million)
Chart on Sports sponsorship - Year-over-year growth 2025-2030 (%)
Data Table on Sports sponsorship - Year-over-year growth 2025-2030 (%)

8.4 Entertainment and media sponsorship - Market size and forecast 2025-2030

Chart on Entertainment and media sponsorship - Market size and forecast 2025-2030 ($ million)
Data Table on Entertainment and media sponsorship - Market size and forecast 2025-2030 ($ million)
Chart on Entertainment and media sponsorship - Year-over-year growth 2025-2030 (%)
Data Table on Entertainment and media sponsorship - Year-over-year growth 2025-2030 (%)

8.5 Cause and social sponsorship - Market size and forecast 2025-2030

Chart on Cause and social sponsorship - Market size and forecast 2025-2030 ($ million)
Data Table on Cause and social sponsorship - Market size and forecast 2025-2030 ($ million)
Chart on Cause and social sponsorship - Year-over-year growth 2025-2030 (%)
Data Table on Cause and social sponsorship - Year-over-year growth 2025-2030 (%)

8.6 Arts and cultural sponsorship - Market size and forecast 2025-2030

Chart on Arts and cultural sponsorship - Market size and forecast 2025-2030 ($ million)
Data Table on Arts and cultural sponsorship - Market size and forecast 2025-2030 ($ million)
Chart on Arts and cultural sponsorship - Year-over-year growth 2025-2030 (%)
Data Table on Arts and cultural sponsorship - Year-over-year growth 2025-2030 (%)

8.7 Others - Market size and forecast 2025-2030

Chart on Others - Market size and forecast 2025-2030 ($ million)
Data Table on Others - Market size and forecast 2025-2030 ($ million)
Chart on Others - Year-over-year growth 2025-2030 (%)
Data Table on Others - Year-over-year growth 2025-2030 (%)

8.8 Market opportunity by Type

Market opportunity by Type ($ million)
Data Table on Market opportunity by Type ($ million)

9. Market Segmentation by End-user

9.1 Market segments

Chart on End-user - Market share 2025-2030 (%)
Data Table on End-user - Market share 2025-2030 (%)

9.2 Comparison by End-user

Chart on Comparison by End-user
Data Table on Comparison by End-user

9.3 Food and beverages - Market size and forecast 2025-2030

Chart on Food and beverages - Market size and forecast 2025-2030 ($ million)
Data Table on Food and beverages - Market size and forecast 2025-2030 ($ million)
Chart on Food and beverages - Year-over-year growth 2025-2030 (%)
Data Table on Food and beverages - Year-over-year growth 2025-2030 (%)

9.4 Automotive - Market size and forecast 2025-2030

Chart on Automotive - Market size and forecast 2025-2030 ($ million)
Data Table on Automotive - Market size and forecast 2025-2030 ($ million)
Chart on Automotive - Year-over-year growth 2025-2030 (%)
Data Table on Automotive - Year-over-year growth 2025-2030 (%)

9.5 BFSI - Market size and forecast 2025-2030

Chart on BFSI - Market size and forecast 2025-2030 ($ million)
Data Table on BFSI - Market size and forecast 2025-2030 ($ million)
Chart on BFSI - Year-over-year growth 2025-2030 (%)
Data Table on BFSI - Year-over-year growth 2025-2030 (%)

9.6 IT and telecom - Market size and forecast 2025-2030

Chart on IT and telecom - Market size and forecast 2025-2030 ($ million)
Data Table on IT and telecom - Market size and forecast 2025-2030 ($ million)
Chart on IT and telecom - Year-over-year growth 2025-2030 (%)
Data Table on IT and telecom - Year-over-year growth 2025-2030 (%)

9.7 Others - Market size and forecast 2025-2030

Chart on Others - Market size and forecast 2025-2030 ($ million)
Data Table on Others - Market size and forecast 2025-2030 ($ million)
Chart on Others - Year-over-year growth 2025-2030 (%)
Data Table on Others - Year-over-year growth 2025-2030 (%)

9.8 Market opportunity by End-user

Market opportunity by End-user ($ million)
Data Table on Market opportunity by End-user ($ million)

10. Market Segmentation by Application

10.1 Market segments

Chart on Application - Market share 2025-2030 (%)
Data Table on Application - Market share 2025-2030 (%)

10.2 Comparison by Application

Chart on Comparison by Application
Data Table on Comparison by Application

10.3 Media and advertising rights - Market size and forecast 2025-2030

Chart on Media and advertising rights - Market size and forecast 2025-2030 ($ million)
Data Table on Media and advertising rights - Market size and forecast 2025-2030 ($ million)
Chart on Media and advertising rights - Year-over-year growth 2025-2030 (%)
Data Table on Media and advertising rights - Year-over-year growth 2025-2030 (%)

10.4 Naming and branding rights - Market size and forecast 2025-2030

Chart on Naming and branding rights - Market size and forecast 2025-2030 ($ million)
Data Table on Naming and branding rights - Market size and forecast 2025-2030 ($ million)
Chart on Naming and branding rights - Year-over-year growth 2025-2030 (%)
Data Table on Naming and branding rights - Year-over-year growth 2025-2030 (%)

10.5 Hospitality and experiential rights - Market size and forecast 2025-2030

Chart on Hospitality and experiential rights - Market size and forecast 2025-2030 ($ million)
Data Table on Hospitality and experiential rights - Market size and forecast 2025-2030 ($ million)
Chart on Hospitality and experiential rights - Year-over-year growth 2025-2030 (%)
Data Table on Hospitality and experiential rights - Year-over-year growth 2025-2030 (%)

10.6 Licensing and merchandising rights - Market size and forecast 2025-2030

Chart on Licensing and merchandising rights - Market size and forecast 2025-2030 ($ million)
Data Table on Licensing and merchandising rights - Market size and forecast 2025-2030 ($ million)
Chart on Licensing and merchandising rights - Year-over-year growth 2025-2030 (%)
Data Table on Licensing and merchandising rights - Year-over-year growth 2025-2030 (%)

10.7 Others - Market size and forecast 2025-2030

Chart on Others - Market size and forecast 2025-2030 ($ million)
Data Table on Others - Market size and forecast 2025-2030 ($ million)
Chart on Others - Year-over-year growth 2025-2030 (%)
Data Table on Others - Year-over-year growth 2025-2030 (%)

10.8 Market opportunity by Application

Market opportunity by Application ($ million)
Data Table on Market opportunity by Application ($ million)

11. Customer Landscape

11.1 Customer landscape overview

Analysis of price sensitivity, lifecycle, customer purchase basket, adoption rates, and purchase criteria

12. Geographic Landscape

12.1 Geographic segmentation

Chart on Market share by geography 2025-2030 (%)
Data Table on Market share by geography 2025-2030 (%)

12.2 Geographic comparison

Chart on Geographic comparison
Data Table on Geographic comparison

12.3 North America - Market size and forecast 2025-2030

Chart on North America - Market size and forecast 2025-2030 ($ million)
Data Table on North America - Market size and forecast 2025-2030 ($ million)
Chart on North America - Year-over-year growth 2025-2030 (%)
Data Table on North America - Year-over-year growth 2025-2030 (%)
Chart on Regional Comparison - North America
Data Table on Regional Comparison - North America

12.3.1 US - Market size and forecast 2025-2030

Chart on US - Market size and forecast 2025-2030 ($ million)
Data Table on US - Market size and forecast 2025-2030 ($ million)
Chart on US - Year-over-year growth 2025-2030 (%)
Data Table on US - Year-over-year growth 2025-2030 (%)

12.3.2 Canada - Market size and forecast 2025-2030

Chart on Canada - Market size and forecast 2025-2030 ($ million)
Data Table on Canada - Market size and forecast 2025-2030 ($ million)
Chart on Canada - Year-over-year growth 2025-2030 (%)
Data Table on Canada - Year-over-year growth 2025-2030 (%)

12.3.3 Mexico - Market size and forecast 2025-2030

Chart on Mexico - Market size and forecast 2025-2030 ($ million)
Data Table on Mexico - Market size and forecast 2025-2030 ($ million)
Chart on Mexico - Year-over-year growth 2025-2030 (%)
Data Table on Mexico - Year-over-year growth 2025-2030 (%)

12.4 Europe - Market size and forecast 2025-2030

Chart on Europe - Market size and forecast 2025-2030 ($ million)
Data Table on Europe - Market size and forecast 2025-2030 ($ million)
Chart on Europe - Year-over-year growth 2025-2030 (%)
Data Table on Europe - Year-over-year growth 2025-2030 (%)
Chart on Regional Comparison - Europe
Data Table on Regional Comparison - Europe

12.4.1 UK - Market size and forecast 2025-2030

Chart on UK - Market size and forecast 2025-2030 ($ million)
Data Table on UK - Market size and forecast 2025-2030 ($ million)
Chart on UK - Year-over-year growth 2025-2030 (%)
Data Table on UK - Year-over-year growth 2025-2030 (%)

12.4.2 Germany - Market size and forecast 2025-2030

Chart on Germany - Market size and forecast 2025-2030 ($ million)
Data Table on Germany - Market size and forecast 2025-2030 ($ million)
Chart on Germany - Year-over-year growth 2025-2030 (%)
Data Table on Germany - Year-over-year growth 2025-2030 (%)

12.4.3 France - Market size and forecast 2025-2030

Chart on France - Market size and forecast 2025-2030 ($ million)
Data Table on France - Market size and forecast 2025-2030 ($ million)
Chart on France - Year-over-year growth 2025-2030 (%)
Data Table on France - Year-over-year growth 2025-2030 (%)

12.4.4 Italy - Market size and forecast 2025-2030

Chart on Italy - Market size and forecast 2025-2030 ($ million)
Data Table on Italy - Market size and forecast 2025-2030 ($ million)
Chart on Italy - Year-over-year growth 2025-2030 (%)
Data Table on Italy - Year-over-year growth 2025-2030 (%)

12.4.5 Spain - Market size and forecast 2025-2030

Chart on Spain - Market size and forecast 2025-2030 ($ million)
Data Table on Spain - Market size and forecast 2025-2030 ($ million)
Chart on Spain - Year-over-year growth 2025-2030 (%)
Data Table on Spain - Year-over-year growth 2025-2030 (%)

12.4.6 The Netherlands - Market size and forecast 2025-2030

Chart on The Netherlands - Market size and forecast 2025-2030 ($ million)
Data Table on The Netherlands - Market size and forecast 2025-2030 ($ million)
Chart on The Netherlands - Year-over-year growth 2025-2030 (%)
Data Table on The Netherlands - Year-over-year growth 2025-2030 (%)

12.5 APAC - Market size and forecast 2025-2030

Chart on APAC - Market size and forecast 2025-2030 ($ million)
Data Table on APAC - Market size and forecast 2025-2030 ($ million)
Chart on APAC - Year-over-year growth 2025-2030 (%)
Data Table on APAC - Year-over-year growth 2025-2030 (%)
Chart on Regional Comparison - APAC
Data Table on Regional Comparison - APAC

12.5.1 China - Market size and forecast 2025-2030

Chart on China - Market size and forecast 2025-2030 ($ million)
Data Table on China - Market size and forecast 2025-2030 ($ million)
Chart on China - Year-over-year growth 2025-2030 (%)
Data Table on China - Year-over-year growth 2025-2030 (%)

12.5.2 Japan - Market size and forecast 2025-2030

Chart on Japan - Market size and forecast 2025-2030 ($ million)
Data Table on Japan - Market size and forecast 2025-2030 ($ million)
Chart on Japan - Year-over-year growth 2025-2030 (%)
Data Table on Japan - Year-over-year growth 2025-2030 (%)

12.5.3 India - Market size and forecast 2025-2030

Chart on India - Market size and forecast 2025-2030 ($ million)
Data Table on India - Market size and forecast 2025-2030 ($ million)
Chart on India - Year-over-year growth 2025-2030 (%)
Data Table on India - Year-over-year growth 2025-2030 (%)

12.5.4 South Korea - Market size and forecast 2025-2030

Chart on South Korea - Market size and forecast 2025-2030 ($ million)
Data Table on South Korea - Market size and forecast 2025-2030 ($ million)
Chart on South Korea - Year-over-year growth 2025-2030 (%)
Data Table on South Korea - Year-over-year growth 2025-2030 (%)

12.5.5 Australia - Market size and forecast 2025-2030

Chart on Australia - Market size and forecast 2025-2030 ($ million)
Data Table on Australia - Market size and forecast 2025-2030 ($ million)
Chart on Australia - Year-over-year growth 2025-2030 (%)
Data Table on Australia - Year-over-year growth 2025-2030 (%)

12.5.6 Indonesia - Market size and forecast 2025-2030

Chart on Indonesia - Market size and forecast 2025-2030 ($ million)
Data Table on Indonesia - Market size and forecast 2025-2030 ($ million)
Chart on Indonesia - Year-over-year growth 2025-2030 (%)
Data Table on Indonesia - Year-over-year growth 2025-2030 (%)

12.6 South America - Market size and forecast 2025-2030

Chart on South America - Market size and forecast 2025-2030 ($ million)
Data Table on South America - Market size and forecast 2025-2030 ($ million)
Chart on South America - Year-over-year growth 2025-2030 (%)
Data Table on South America - Year-over-year growth 2025-2030 (%)
Chart on Regional Comparison - South America
Data Table on Regional Comparison - South America

12.6.1 Brazil - Market size and forecast 2025-2030

Chart on Brazil - Market size and forecast 2025-2030 ($ million)
Data Table on Brazil - Market size and forecast 2025-2030 ($ million)
Chart on Brazil - Year-over-year growth 2025-2030 (%)
Data Table on Brazil - Year-over-year growth 2025-2030 (%)

12.6.2 Argentina - Market size and forecast 2025-2030

Chart on Argentina - Market size and forecast 2025-2030 ($ million)
Data Table on Argentina - Market size and forecast 2025-2030 ($ million)
Chart on Argentina - Year-over-year growth 2025-2030 (%)
Data Table on Argentina - Year-over-year growth 2025-2030 (%)

12.6.3 Colombia - Market size and forecast 2025-2030

Chart on Colombia - Market size and forecast 2025-2030 ($ million)
Data Table on Colombia - Market size and forecast 2025-2030 ($ million)
Chart on Colombia - Year-over-year growth 2025-2030 (%)
Data Table on Colombia - Year-over-year growth 2025-2030 (%)

12.7 Middle East and Africa - Market size and forecast 2025-2030

Chart on Middle East and Africa - Market size and forecast 2025-2030 ($ million)
Data Table on Middle East and Africa - Market size and forecast 2025-2030 ($ million)
Chart on Middle East and Africa - Year-over-year growth 2025-2030 (%)
Data Table on Middle East and Africa - Year-over-year growth 2025-2030 (%)
Chart on Regional Comparison - Middle East and Africa
Data Table on Regional Comparison - Middle East and Africa

12.7.1 Saudi Arabia - Market size and forecast 2025-2030

Chart on Saudi Arabia - Market size and forecast 2025-2030 ($ million)
Data Table on Saudi Arabia - Market size and forecast 2025-2030 ($ million)
Chart on Saudi Arabia - Year-over-year growth 2025-2030 (%)
Data Table on Saudi Arabia - Year-over-year growth 2025-2030 (%)

12.7.2 UAE - Market size and forecast 2025-2030

Chart on UAE - Market size and forecast 2025-2030 ($ million)
Data Table on UAE - Market size and forecast 2025-2030 ($ million)
Chart on UAE - Year-over-year growth 2025-2030 (%)
Data Table on UAE - Year-over-year growth 2025-2030 (%)

12.7.3 South Africa - Market size and forecast 2025-2030

Chart on South Africa - Market size and forecast 2025-2030 ($ million)
Data Table on South Africa - Market size and forecast 2025-2030 ($ million)
Chart on South Africa - Year-over-year growth 2025-2030 (%)
Data Table on South Africa - Year-over-year growth 2025-2030 (%)

12.7.4 Turkey - Market size and forecast 2025-2030

Chart on Turkey - Market size and forecast 2025-2030 ($ million)
Data Table on Turkey - Market size and forecast 2025-2030 ($ million)
Chart on Turkey - Year-over-year growth 2025-2030 (%)
Data Table on Turkey - Year-over-year growth 2025-2030 (%)

12.7.5 Israel - Market size and forecast 2025-2030

Chart on Israel - Market size and forecast 2025-2030 ($ million)
Data Table on Israel - Market size and forecast 2025-2030 ($ million)
Chart on Israel - Year-over-year growth 2025-2030 (%)
Data Table on Israel - Year-over-year growth 2025-2030 (%)

12.8 Market opportunity by geography

Market opportunity by geography ($ million)
Data Tables on Market opportunity by geography ($ million)

13. Drivers, Challenges, and Opportunity

13.1 Market drivers

Expansion of direct-to-consumer streaming platforms and interactive media delivery
Escalating corporate capital inflows into elite sports and cultural properties
Strategic prioritization of experiential touchpoints and purpose-driven marketing initiatives

13.2 Market challenges

Heightened regulatory governance and restrictions on high-spending commercial sectors
Attribution complexities and deficiencies in standardized return on investment metrics
Escalating rights acquisition fees and severe commercial saturation diluting value

13.3 Impact of drivers and challenges

Impact of drivers and challenges in 2025 and 2030

13.4 Market opportunities

Proliferation of cross-border financial technology and digital payment solutions
Institutional adoption of automated telemetry, computer vision, and AI for dynamic asset valuation
Institutional integration of environmental sustainability benchmarks

14. Competitive Landscape

14.1 Overview

14.2

Overview on criticality of inputs and factors of differentiation

14.3 Landscape disruption

Overview on factors of disruption

14.4 Industry risks

Impact of key risks on business

15. Competitive Analysis

15.1 Companies profiled

Companies covered

15.2 Company ranking index

15.3 Market positioning of companies

Matrix on companies position and classification

15.4 Adidas AG

Adidas AG - Overview
Adidas AG - Business segments
Adidas AG - Key offerings
Adidas AG - Segment focus
SWOT

15.5 Bayerische Motoren Werke AG

Bayerische Motoren Werke AG - Overview
Bayerische Motoren Werke AG - Business segments
Bayerische Motoren Werke AG - Key offerings
Bayerische Motoren Werke AG - Segment focus
SWOT

15.6 Bridgestone Corp.

Bridgestone Corp. - Overview
Bridgestone Corp. - Business segments
Bridgestone Corp. - Key offerings
Bridgestone Corp. - Segment focus
SWOT

15.7 Hyundai Motor Co.

Hyundai Motor Co. - Overview
Hyundai Motor Co. - Business segments
Hyundai Motor Co. - Key news
Hyundai Motor Co. - Key offerings
Hyundai Motor Co. - Segment focus
SWOT

15.8 Mercedes Benz Group AG

Mercedes Benz Group AG - Overview
Mercedes Benz Group AG - Business segments
Mercedes Benz Group AG - Key offerings
Mercedes Benz Group AG - Segment focus
SWOT

15.9 Nestle SA

Nestle SA - Overview
Nestle SA - Business segments
Nestle SA - Key news
Nestle SA - Key offerings
Nestle SA - Segment focus
SWOT

15.10 Nike Inc.

Nike Inc. - Overview
Nike Inc. - Business segments
Nike Inc. - Key offerings
Nike Inc. - Segment focus
SWOT

15.11 Panasonic Holdings Corp.

Panasonic Holdings Corp. - Overview
Panasonic Holdings Corp. - Business segments
Panasonic Holdings Corp. - Key news
Panasonic Holdings Corp. - Key offerings
Panasonic Holdings Corp. - Segment focus
SWOT

15.12 PepsiCo Inc.

PepsiCo Inc. - Overview
PepsiCo Inc. - Business segments
PepsiCo Inc. - Key news
PepsiCo Inc. - Key offerings
PepsiCo Inc. - Segment focus
SWOT

15.13 Procter and Gamble Co.

Procter and Gamble Co. - Overview
Procter and Gamble Co. - Business segments
Procter and Gamble Co. - Key news
Procter and Gamble Co. - Key offerings
Procter and Gamble Co. - Segment focus
SWOT

15.14 Red Bull GmbH

Red Bull GmbH - Overview
Red Bull GmbH - Product / Service
Red Bull GmbH - Key offerings
SWOT

15.15 Rolex SA

Rolex SA - Overview
Rolex SA - Product / Service
Rolex SA - Key offerings
SWOT

15.16 Samsung Electronics Co. Ltd.

Samsung Electronics Co. Ltd. - Overview
Samsung Electronics Co. Ltd. - Business segments
Samsung Electronics Co. Ltd. - Key news
Samsung Electronics Co. Ltd. - Key offerings
Samsung Electronics Co. Ltd. - Segment focus
SWOT

15.17 Sony Group Corp.

Sony Group Corp. - Overview
Sony Group Corp. - Business segments
Sony Group Corp. - Key news
Sony Group Corp. - Key offerings
Sony Group Corp. - Segment focus
SWOT

15.18 The Coca Cola Co.

The Coca Cola Co. - Overview
The Coca Cola Co. - Business segments
The Coca Cola Co. - Key news
The Coca Cola Co. - Key offerings
The Coca Cola Co. - Segment focus
SWOT

16. Appendix

16.1 Scope of the report

Market definition
Objectives
Notes and caveats

16.2 Inclusions and exclusions checklist

Inclusions checklist
Exclusions checklist

16.3 Currency conversion rates for US$

16.4 Research methodology

16.5 Data procurement

Information sources

16.6 Data validation

16.7 Validation techniques employed for market sizing

16.8 Data synthesis

16.9 360 degree market analysis

16.10 List of abbreviations

Research Methodology

Technavio presents a detailed picture of the market by way of study, synthesis, and summation of data from multiple sources. The analysts have presented the various facets of the market with a particular focus on identifying the key industry influencers. The data thus presented is comprehensive, reliable, and the result of extensive research, both primary and secondary.

INFORMATION SOURCES

Primary sources

  • Manufacturers and suppliers
  • Channel partners
  • Industry experts
  • Strategic decision makers

Secondary sources

  • Industry journals and periodicals
  • Government data
  • Financial reports of key industry players
  • Historical data
  • Press releases

DATA ANALYSIS

Data Synthesis

  • Collation of data
  • Estimation of key figures
  • Analysis of derived insights

Data Validation

  • Triangulation with data models
  • Reference against proprietary databases
  • Corroboration with industry experts

REPORT WRITING

Qualitative

  • Market drivers
  • Market challenges
  • Market trends
  • Five forces analysis

Quantitative

  • Market size and forecast
  • Market segmentation
  • Geographical insights
  • Competitive landscape

Interested in this report?

Get your sample now to see our research methodology and insights!

Download Now

Frequently Asked Questions

Sponsorships market growth will increase by USD 43668.7 million during 2026-2030.

The Sponsorships market is expected to grow at a CAGR of 6.8% during 2026-2030.

Sponsorships market is segmented by Type (Sports sponsorship, Entertainment and media sponsorship, Cause and social sponsorship, Arts and cultural sponsorship, Others) End-user (Food and beverages, Automotive, BFSI, IT and telecom, Others) Application (Media and advertising rights, Naming and branding rights, Hospitality and experiential rights, Licensing and merchandising rights, Others)

Adidas AG, Bayerische Motoren Werke AG, Bridgestone Corp., Heineken NV, Hyundai Motor Co., KIA CORP., Mercedes Benz Group AG, Michelin, Monster Energy Co., Nestle SA, Nike Inc., Panasonic Holdings Corp., PepsiCo Inc., Procter and Gamble Co., PUMA SE, Red Bull GmbH, Rolex SA, Samsung Electronics Co. Ltd., Sony Group Corp., The Coca Cola Co. are a few of the key vendors in the Sponsorships market.

APAC will register the highest growth rate of 33.9% among the other regions. Therefore, the Sponsorships market in APAC is expected to garner significant business opportunities for the vendors during the forecast period.

US, Canada, Mexico, UK, Germany, France, Italy, Spain, The Netherlands, China, Japan, India, South Korea, Australia, Indonesia, Brazil, Argentina, Colombia, Saudi Arabia, UAE, South Africa, Turkey, Israel

  • Expansion of direct-to-consumer streaming platforms and interactive media delivery is the driving factor this market.

The Sponsorships market vendors should focus on grabbing business opportunities from the Type segment as it accounted for the largest market share in the base year.
RIA - Research AI Assistant
Ask RIA
