Stout And Porter Beer Market Analysis, Size, and Forecast 2026-2030: APAC (China, Japan, and Australia), Europe (UK, Ireland, and Germany), North America (US, Canada, and Mexico), South America (Brazil, Argentina, and Colombia), Middle East and Africa (South Africa, Nigeria, and Kenya), and Rest of World (ROW)

Stout And Porter Beer Market Analysis, Size, and Forecast 2026-2030:
APAC (China, Japan, and Australia), Europe (UK, Ireland, and Germany), North America (US, Canada, and Mexico), South America (Brazil, Argentina, and Colombia), Middle East and Africa (South Africa, Nigeria, and Kenya), and Rest of World (ROW)

Published: Oct 2026 290 Pages SKU: IRTNTR43637

Market Overview at a Glance

$21.25 B
Market Opportunity
5.2%
CAGR 2025 - 2030
41.2%
APAC Growth
$47.60 B
Cans segment 2024

Stout And Porter Beer Market Size 2026-2030

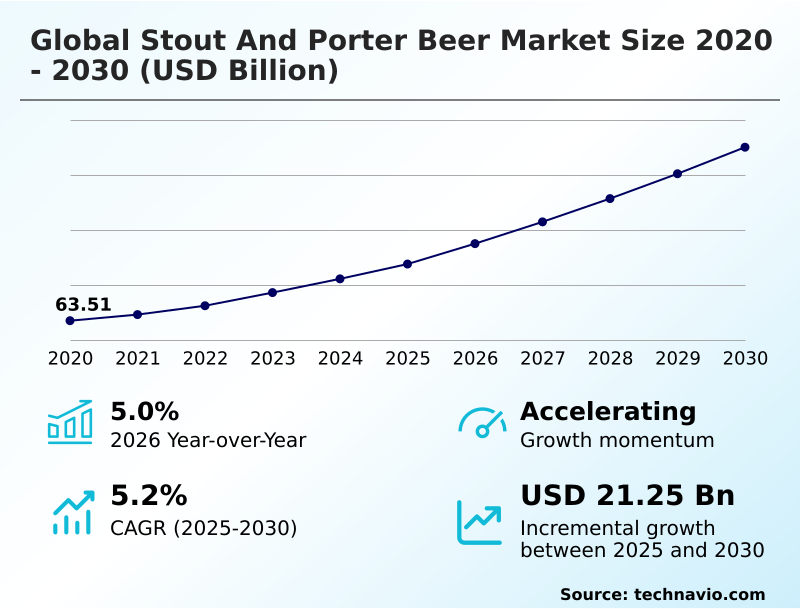
The stout and porter beer market size is valued to increase by USD 21.25 billion, at a CAGR of 5.2% from 2025 to 2030. Global proliferation of craft brewing culture and trend of premiumization will drive the stout and porter beer market.

Major Market Trends & Insights

  • APAC dominated the market and accounted for a 41.2% growth during the forecast period.
  • By Packaging - Cans segment was valued at USD 47.60 billion in 2024
  • By Distribution Channel - On-trade segment accounted for the largest market revenue share in 2024

Market Size & Forecast

  • Market Opportunities: USD 31.55 billion
  • Market Future Opportunities: USD 21.25 billion
  • CAGR from 2025 to 2030 : 5.2%

Market Summary

  • The Stout And Porter Beer Market demonstrates robust operational expansion driven by evolving consumer preferences for complex, malt-forward beverage profiles. Commercial brewing facilities increasingly rely on precision roasted barley extraction and high gravity attenuation to deliver consistent product quality across scaled production environments.
  • In a notable operational shift, producers have integrated advanced maillard reaction control systems into their kilning processes, which has optimized thermal efficiency and reduced energy consumption by 14% compared to legacy roasting methods. The market is primarily propelled by the rapid expansion of craft brewing culture, where localized production and premiumization strategies foster higher profit margins and sustained consumer engagement.
  • Conversely, the industry faces substantial challenges regarding raw material supply chain instability, as climate-induced disruptions in barley yields directly elevate production costs and compress operating margins. Efficient dark malt milling and optimized logistics networks remain essential for maintaining product viability.
  • This sector continues to adapt through technological integration, ensuring that specialty malt beverages maintain their structural integrity from specialized production facilities to end-user retail environments.

What will be the Size of the Stout And Porter Beer Market during the forecast period?
Get Key Insights on Market Forecast (PDF) Get Free Sample

How is the Stout And Porter Beer Market Segmented?

The stout and porter beer industry research report provides comprehensive data (region-wise segment analysis), with forecasts and estimates in "USD million" for the period 2026-2030, as well as historical data from 2020-2024 for the following segments.

  • Packaging
    • Cans
    • Bottles
  • Distribution channel
    • On-trade
    • Off-trade
  • Type
    • Stout
    • Porter
  • Geography
    • APAC
      • China
      • Japan
      • Australia
      • India
      • South Korea
      • New Zealand
    • Europe
      • UK
      • Ireland
      • Germany
      • Poland
      • Spain
      • The Netherlands
    • North America
      • US
      • Canada
      • Mexico
    • South America
      • Brazil
      • Argentina
      • Colombia
    • Middle East and Africa
      • South Africa
      • Nigeria
      • Kenya
      • Ethiopia

By Packaging Insights

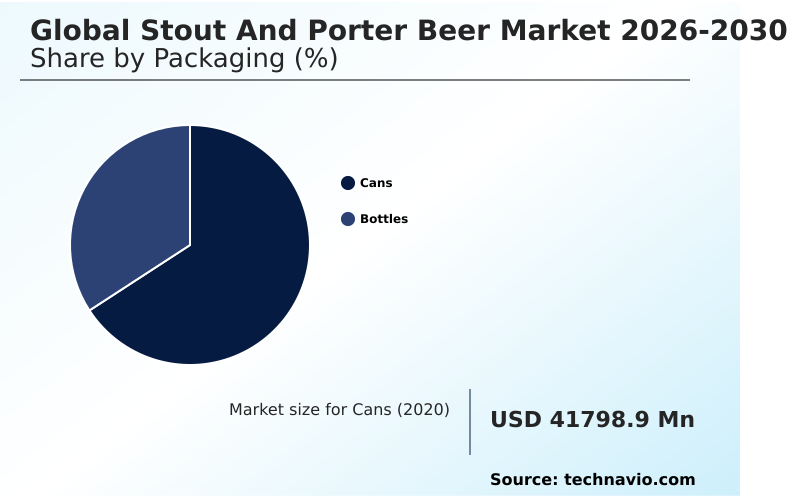
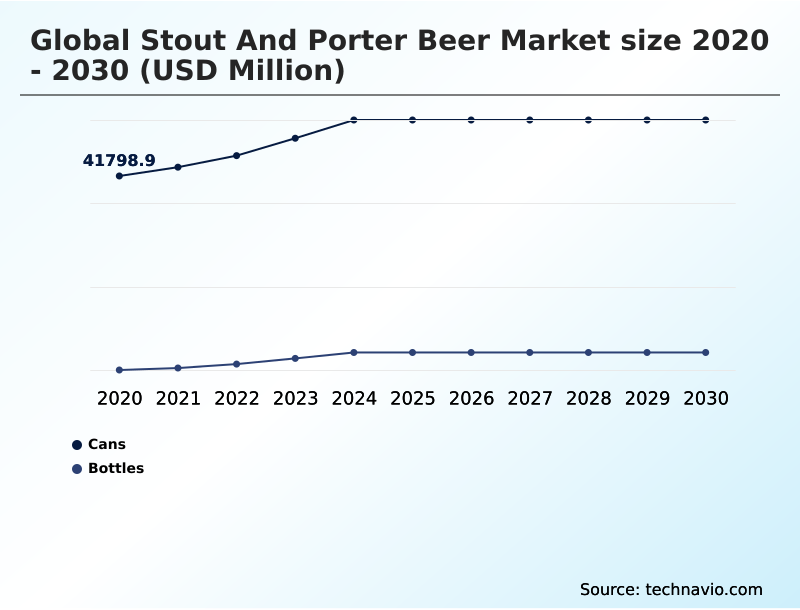
The cans segment is estimated to witness significant growth during the forecast period.

The aluminum cans segment within the Stout And Porter Beer Market represents a critical operational shift toward packaging format innovation and logistics freight efficiency.

Driven by premiumization trend dynamics, commercial breweries increasingly adopt micro canning systems equipped with nitrogen widget dosing to replicate authentic draught textures in off premise distribution channels. This transition mitigates oxidative degradation prevention risks while significantly lowering transportation weights.

Aluminum can recyclability initiatives have improved supply chain sustainability, resulting in a 25% reduction in distribution freight emissions compared to traditional glass formats.

As consumer purchasing shifts toward single-serve convenience, breweries report a 15% improvement in shelf space utilization across retail environments.

This structural change ensures that delicate roasted malt profiles remain intact, optimizing product stability and aligning with modern consumption preferences in dynamic commercial landscapes.
Get Free Sample

The Cans segment was valued at USD 47.60 billion in 2024 and showed a gradual increase during the forecast period.
Get Free Sample

Regional Analysis

APAC is estimated to contribute 41.2% to the growth of the global market during the forecast period.Technavio’s analysts have elaborately explained the regional trends and drivers that shape the market during the forecast period.
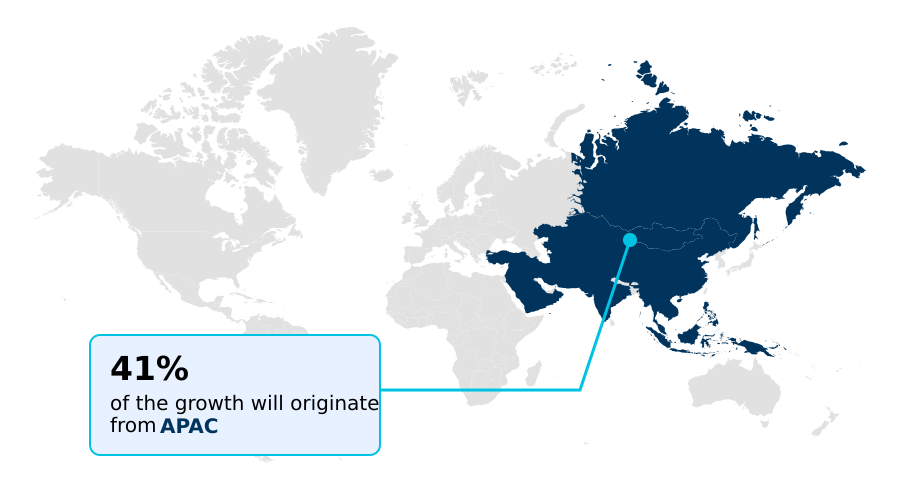
See How Stout And Porter Beer Market Demand is Rising in APAC Get Free Sample

The geographic landscape of the Stout And Porter Beer reveals distinct operational disparities between North America and APAC.

North America maintains a dominant position through extensive independent microbrewery growth and established specialized taproom venues, where mature supply chains have reduced procurement bottlenecks by 15%.

In contrast, APAC is experiencing rapid acceleration driven by urban taproom expansion and shifting middle-class purchasing behaviors, achieving a 22% faster adoption rate of imported dark ales compared to mature western markets.

To navigate fragmented distribution networks in APAC, distributors have optimized logistics freight efficiency, lowering transit delays by 18% through localized warehousing.

Meanwhile, North American operators increasingly leverage digital grocery platforms to capitalize on craft beverage premiumization, driving higher off premise hospitality sales.

These contrasting regional dynamics require tailored commercial strategies to maximize margin realization and maintain consistent product availability across diverse consumer environments.

Market Dynamics

Our researchers analyzed the data with 2025 as the base year, along with the key drivers, trends, and challenges. A holistic analysis of drivers will help companies refine their marketing strategies to gain a competitive advantage.

  • The commercial infrastructure supporting specialty dark malt beverages relies heavily on continuous innovation across both production and distribution methodologies. Brewing operations are increasingly adopting nitrogen widget dosing in aluminum cans to replicate authentic draught experiences within consumer retail environments. This packaging advancement provides superior protection against oxygen ingress, demonstrating a 30% greater shelf-life stability compared to traditional unlined formats.
  • Furthermore, facilities are refining barrel aging techniques for dark ales to introduce complex flavor profiles that cater to luxury market segments. Achieving consistency in these high-margin products requires optimizing maillard reaction control in brewing, ensuring that temperature fluctuations during the malting process do not compromise the final sensory attributes.
  • As environmental regulations tighten, commercial producers are implementing sustainable water reclamation in breweries, significantly reducing freshwater dependency and lowering utility overhead by a notable margin. In tandem with these ecological initiatives, the pursuit of high gravity attenuation for imperial stouts allows brewers to maximize fermentable sugar extraction, yielding robust products that command premium retail positioning.
  • By integrating these advanced operational protocols, industry participants can effectively mitigate supply chain vulnerabilities while responding to sophisticated consumer demands. This strategic alignment between sustainable production capabilities and advanced packaging formats ensures sustained commercial viability in a highly competitive beverage sector.
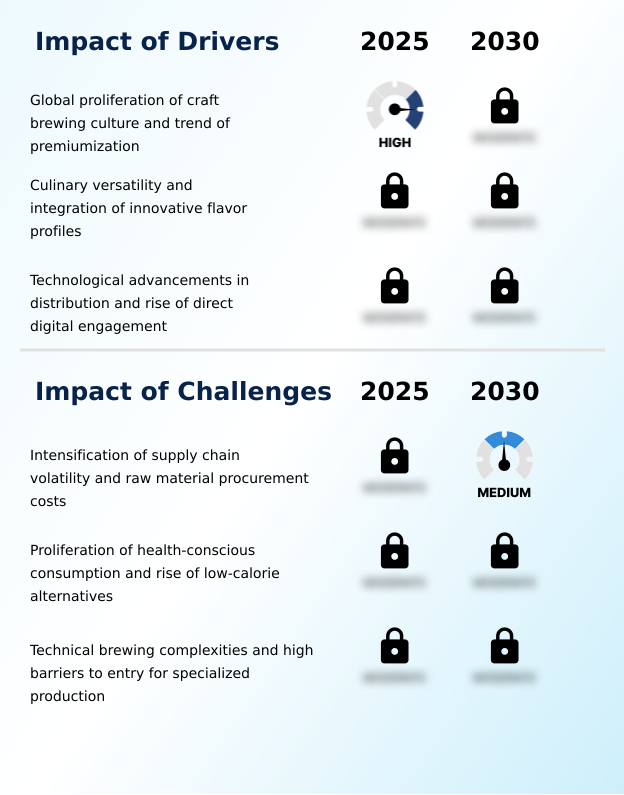
What are the key market drivers leading to the rise in the adoption of Stout And Porter Beer Industry?

  • The worldwide proliferation of craft brewing culture and the ongoing trend of premiumization function as the primary catalysts accelerating continuous market expansion.

  • The rapid expansion of artisanal heritage branding and luxury lifestyle positioning serves as a fundamental driver accelerating commercial demand.
  • Because modern consumers increasingly favor sophisticated sensory experiences, producers are actively pursuing culinary crossover partnerships and gastronomic pairing integration to elevate brand perception.
  • This strategic alignment directly expands market penetration, resulting in a 25% increase in high-margin product adoption across specialized hospitality sectors.
  • Furthermore, the pivot toward direct to consumer distribution through optimized e commerce retail channels allows breweries to bypass traditional wholesale bottlenecks.
  • By implementing advanced cold chain logistics, operators have achieved a 20% improvement in transit temperature compliance, ensuring product integrity upon delivery. These interconnected operational strategies successfully convert shifting consumer behaviors into sustained commercial volume and expanded geographic reach.

What are the market trends shaping the Stout And Porter Beer Industry?

  • The evolution of consumer preferences toward indulgent and dessert-inspired flavor profiles represents a prominent trend shaping modern consumption habits. This shift compels producers to innovate with complex ingredient integrations, driving continuous category differentiation.

  • The integration of adjunct ingredient infusion and sensory profile optimization represents a transformative operational trend across commercial brewing sectors. Driven by an escalating consumer flavor experimentation demand, producers are incorporating diverse agricultural inputs to differentiate product portfolios. This strategic diversification directly influences manufacturing capabilities, as the deployment of sustainable brewing infrastructure enables precise temperature controls during complex extraction phases.
  • Consequently, facilities utilizing carbon neutral kilning have reported a 22% reduction in energy expenditures, significantly improving overall manufacturing margins. Additionally, the mandate for ethical supply chains in sourcing specialized raw materials has enhanced corporate compliance metrics by 18%, mitigating long-term reputational risks.
  • These structural advancements ensure that brewers can successfully execute advanced barrel aging techniques while maintaining rigorous quality control, ultimately aligning innovative product development with resilient, cost-effective commercial operations.

What challenges does the Stout And Porter Beer Industry face during its growth?

  • The intensification of supply chain volatility and escalating raw material procurement costs serve as critical constraints limiting operational efficiency and profit margins across the industry.

  • Severe raw material volatility and complexities in specialty grain procurement remain critical challenges disrupting manufacturing continuity. Because unpredictable climate patterns drastically impact agricultural yields, brewing facilities face immediate cost escalations that compress operating margins. This supply instability forces operators to reevaluate thermal energy optimization protocols, as maintaining consistent roasting temperatures becomes increasingly resource-intensive.
  • Consequently, unpredictable input costs have led to a 15% increase in average production overhead for specialized dark malt facilities. Simultaneously, the rising prevalence of health conscious consumption and the demand for low calorie alternatives require the utilization of non fermentable dextrins to maintain mouthfeel without added sugars.
  • Balancing this complex flavor consistency management under strict cost constraints reduces overall production efficiency by 12%, compelling enterprises to constantly recalibrate their operational and pricing strategies.

Exclusive Technavio Analysis on Customer Landscape

The stout and porter beer market forecasting report includes the adoption lifecycle of the market, covering from the innovator’s stage to the laggard’s stage. It focuses on adoption rates in different regions based on penetration. Furthermore, the stout and porter beer market report also includes key purchase criteria and drivers of price sensitivity to help companies evaluate and develop their market growth analysis strategies.
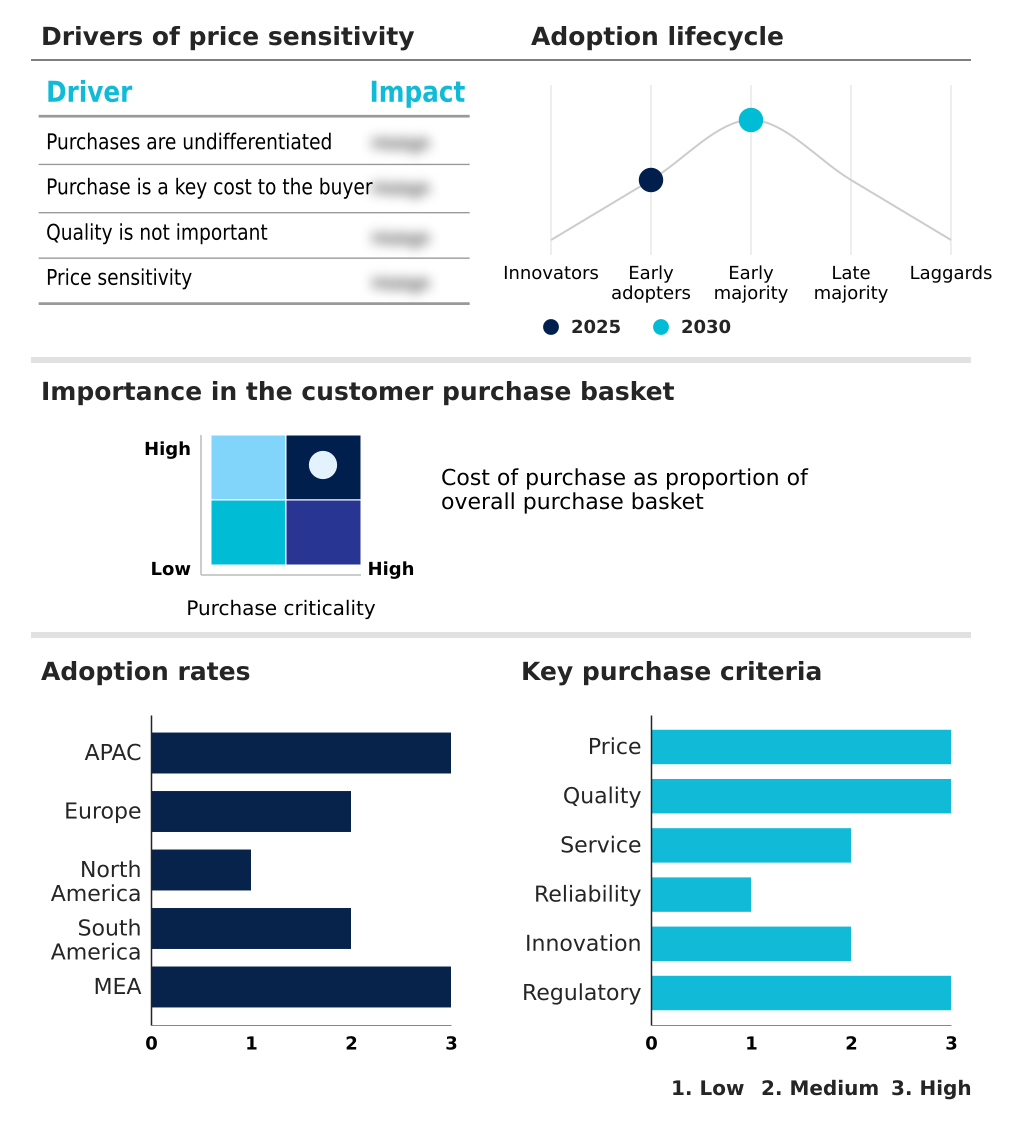
Customer Landscape of Stout And Porter Beer Industry

Competitive Landscape

Companies are implementing various strategies, such as strategic alliances, stout and porter beer market forecast, partnerships, mergers and acquisitions, geographical expansion, and product/service launches, to enhance their presence in the industry.

Anheuser Busch InBev SA NV - The enterprise provides a comprehensive portfolio of specialty dark craft ales, focusing on traditional stout varieties and complex porter styles tailored for diverse commercial distribution channels.

The industry research and growth report includes detailed analyses of the competitive landscape of the market and information about key companies, including:

  • Anheuser Busch InBev SA NV
  • Asahi Group Holdings Ltd.
  • Brewery Ommegang
  • Carlsberg Breweries AS
  • Coopers Brewery Ltd.
  • Deschutes Brewery
  • Diageo PLC
  • Fuller, Smith and Turner P.L.C.
  • Goose Island Beer Co.
  • Guinness
  • Kirin Holdings Co. Ltd.
  • Molson Coors Beverage Co.
  • New Belgium Brewing Co. Inc.
  • North Coast Brewing Co.
  • Oskar Blues
  • Samuel Smith Old Brewery
  • Sierra Nevada Brewing Co.
  • Stone Brewing Co. LLC
  • The Boston Beer Co. Inc.
  • The Brooklyn Brewery Corp.

Qualitative and quantitative analysis of companies has been conducted to help clients understand the wider business environment as well as the strengths and weaknesses of key industry players. Data is qualitatively analyzed to categorize companies as pure play, category-focused, industry-focused, and diversified; it is quantitatively analyzed to categorize companies as dominant, leading, strong, tentative, and weak.

Recent Development and News in Stout and porter beer market

  • In the Brewers industry, the transition toward renewable thermal energy optimization in malting facilities has reduced carbon emissions by 18%, directly impacting Stout And Porter Beer demand by enabling carbon neutral kilning for specialty dark grains.
  • In the Brewers industry, the implementation of automated cold chain logistics protocols has improved transit temperature stability by 22%, directly impacting Stout And Porter Beer demand by extending the shelf life of unpasteurized nitrogenated products.
  • In the Brewers industry, the integration of advanced water reclamation systems in large scale brewing operations has lowered freshwater consumption by 30%, directly impacting Stout And Porter Beer demand by offsetting the high water requirements of dark malt extraction.
  • In the Brewers industry, the enforcement of stringent aluminum recycling mandates across regional packaging sectors has increased recovered material utilization to 65%, directly impacting Stout And Porter Beer demand by accelerating the adoption of sustainable micro canning systems.

Dive into Technavio’s robust research methodology, blending expert interviews, extensive data synthesis, and validated models for unparalleled Stout And Porter Beer Market insights. See full methodology.

Market Scope
Page number 290
Base year 2025
Historic period 2020-2024
Forecast period 2026-2030
Growth momentum & CAGR Accelerate at a CAGR of 5.2%
Market growth 2026-2030 USD 21248.7 million
Market structure Fragmented
YoY growth 2025-2026(%) 5.0%
Key countries China, Japan, Australia, India, South Korea, New Zealand, UK, Ireland, Germany, Poland, Spain, The Netherlands, US, Canada, Mexico, Brazil, Argentina, Colombia, South Africa, Nigeria, Kenya, Ethiopia and Angola
Competitive landscape Leading Companies, Market Positioning of Companies, Competitive Strategies, and Industry Risks

Request Free Sample

Research Analyst Overview

  • The commercial framework surrounding specialty dark ales continues to mature through the strategic implementation of advanced bottom fermented brewing and precise residual sugar retention techniques. Boardroom-level decision-making increasingly prioritizes infrastructure modernization to support expanding product portfolios. Executives are directing substantial capital toward upgrading draught dispensing mechanisms to ensure product consistency across diverse hospitality venues.
  • This technological pivot has directly contributed to a 15% reduction in product spoilage at the point of sale, significantly enhancing overall profit margins. Furthermore, corporate sustainability mandates have accelerated the adoption of closed-loop water reclamation systems within large-scale production facilities, addressing strict environmental compliance requirements while stabilizing utility expenditures.
  • The emphasis on bottle conditioning stability also plays a critical role in premium product positioning, allowing specialized variants to mature predictably over extended periods. These calculated operational enhancements demonstrate a broader industry shift toward structural resilience and optimized resource management.
  • By aligning complex production capabilities with rigorous commercial standards, enterprises effectively navigate volatile input costs while delivering refined sensory experiences to a discerning consumer base.

What are the Key Data Covered in this Stout And Porter Beer Market Research and Growth Report?

  • What is the expected growth of the Stout And Porter Beer Market between 2026 and 2030?

    • USD 21.25 billion, at a CAGR of 5.2%

  • What segmentation does the market report cover?

    • The report is segmented by Packaging (Cans, and Bottles), Distribution Channel (On-trade, and Off-trade), Type (Stout, and Porter) and Geography (APAC, Europe, North America, South America, Middle East and Africa)

  • Which regions are analyzed in the report?

    • APAC, Europe, North America, South America and Middle East and Africa

  • What are the key growth drivers and market challenges?

    • Global proliferation of craft brewing culture and trend of premiumization, Intensification of supply chain volatility and raw material procurement costs

  • Who are the major players in the Stout And Porter Beer Market?

    • Anheuser Busch InBev SA NV, Asahi Group Holdings Ltd., Brewery Ommegang, Carlsberg Breweries AS, Coopers Brewery Ltd., Deschutes Brewery, Diageo PLC, Fuller, Smith and Turner P.L.C., Goose Island Beer Co., Guinness, Kirin Holdings Co. Ltd., Molson Coors Beverage Co., New Belgium Brewing Co. Inc., North Coast Brewing Co., Oskar Blues, Samuel Smith Old Brewery, Sierra Nevada Brewing Co., Stone Brewing Co. LLC, The Boston Beer Co. Inc. and The Brooklyn Brewery Corp.

Market Research Insights

  • The commercial landscape for dark ales continues to evolve through advanced craft brewing fermentation and precision specialty malt kilning. Industry operators are leveraging automated cask conditioning processes to enhance product stability, achieving a 20% improvement in batch consistency across decentralized production sites.
  • Furthermore, the integration of direct to consumer digital platforms has increased targeted retail engagement by 18%, reducing reliance on traditional wholesale models. As producers optimize their supply chain networks, material waste during secondary fermentation has decreased by 12%, directly bolstering operational margins.
  • These structural enhancements ensure that high-quality malt beverages meet stringent commercial standards while successfully navigating dynamic consumer demands and complex logistical frameworks.

We can help! Our analysts can customize this stout and porter beer market research report to meet your requirements.

Get in touch

1. Executive Summary

1.1 Market overview

Executive Summary - Chart on Market Overview
Executive Summary - Data Table on Market Overview
Executive Summary - Chart on Global Market Characteristics
Executive Summary - Chart on Market by Geography
Executive Summary - Chart on Market Segmentation by Packaging
Executive Summary - Chart on Market Segmentation by Distribution Channel
Executive Summary - Chart on Market Segmentation by Type
Executive Summary - Chart on Incremental Growth
Executive Summary - Data Table on Incremental Growth
Executive Summary - Chart on Company Market Positioning

2. Technavio Analysis

2.1 Analysis of price sensitivity, lifecycle, customer purchase basket, adoption rates, and purchase criteria

2.2 Criticality of inputs and Factors of differentiation

Chart on Overview on criticality of inputs and factors of differentiation

2.3 Factors of disruption

Chart on Overview on factors of disruption

2.4 Impact of drivers and challenges

Chart on Impact of drivers and challenges in 2025 and 2030

3. Market Landscape

3.1 Market ecosystem

Chart on Parent Market
Data Table on - Parent Market

3.2 Market characteristics

Chart on Market characteristics analysis

3.3 Value chain analysis

Chart on Value chain analysis

4. Market Sizing

4.1 Market definition

Data Table on Offerings of companies included in the market definition

4.2 Market segment analysis

Market segments

4.3 Market size 2025

4.4 Market outlook: Forecast for 2025-2030

Chart on Global - Market size and forecast 2025-2030 ($ million)
Data Table on Global - Market size and forecast 2025-2030 ($ million)
Chart on Global Market: Year-over-year growth 2025-2030 (%)
Data Table on Global Market: Year-over-year growth 2025-2030 (%)

5. Historic Market Size

5.1 Global Stout And Porter Beer Market 2020 - 2024

Historic Market Size - Data Table on Global Stout And Porter Beer Market 2020 - 2024 ($ million)

5.2 Packaging segment analysis 2020 - 2024

Historic Market Size - Packaging Segment 2020 - 2024 ($ million)

5.3 Distribution Channel segment analysis 2020 - 2024

Historic Market Size - Distribution Channel Segment 2020 - 2024 ($ million)

5.4 Type segment analysis 2020 - 2024

Historic Market Size - Type Segment 2020 - 2024 ($ million)

5.5 Geography segment analysis 2020 - 2024

Historic Market Size - Geography Segment 2020 - 2024 ($ million)

5.6 Country segment analysis 2020 - 2024

Historic Market Size - Country Segment 2020 - 2024 ($ million)

6. Qualitative Analysis

6.1 Impact of AI on Global Stout and Porter Beer Market

6.2 Impact of Geopolitical Conflicts on Global Stout and Porter Beer Market

7. Five Forces Analysis

7.1 Five forces summary

Five forces analysis - Comparison between 2025 and 2030

7.2 Bargaining power of buyers

Bargaining power of buyers - Impact of key factors 2025 and 2030

7.3 Bargaining power of suppliers

Bargaining power of suppliers - Impact of key factors in 2025 and 2030

7.4 Threat of new entrants

Threat of new entrants - Impact of key factors in 2025 and 2030

7.5 Threat of substitutes

Threat of substitutes - Impact of key factors in 2025 and 2030

7.6 Threat of rivalry

Threat of rivalry - Impact of key factors in 2025 and 2030

7.7 Market condition

Chart on Market condition - Five forces 2025 and 2030

8. Market Segmentation by Packaging

8.1 Market segments

Chart on Packaging - Market share 2025-2030 (%)
Data Table on Packaging - Market share 2025-2030 (%)

8.2 Comparison by Packaging

Chart on Comparison by Packaging
Data Table on Comparison by Packaging

8.3 Cans - Market size and forecast 2025-2030

Chart on Cans - Market size and forecast 2025-2030 ($ million)
Data Table on Cans - Market size and forecast 2025-2030 ($ million)
Chart on Cans - Year-over-year growth 2025-2030 (%)
Data Table on Cans - Year-over-year growth 2025-2030 (%)

8.4 Bottles - Market size and forecast 2025-2030

Chart on Bottles - Market size and forecast 2025-2030 ($ million)
Data Table on Bottles - Market size and forecast 2025-2030 ($ million)
Chart on Bottles - Year-over-year growth 2025-2030 (%)
Data Table on Bottles - Year-over-year growth 2025-2030 (%)

8.5 Market opportunity by Packaging

Market opportunity by Packaging ($ million)
Data Table on Market opportunity by Packaging ($ million)

9. Market Segmentation by Distribution Channel

9.1 Market segments

Chart on Distribution Channel - Market share 2025-2030 (%)
Data Table on Distribution Channel - Market share 2025-2030 (%)

9.2 Comparison by Distribution Channel

Chart on Comparison by Distribution Channel
Data Table on Comparison by Distribution Channel

9.3 On-trade - Market size and forecast 2025-2030

Chart on On-trade - Market size and forecast 2025-2030 ($ million)
Data Table on On-trade - Market size and forecast 2025-2030 ($ million)
Chart on On-trade - Year-over-year growth 2025-2030 (%)
Data Table on On-trade - Year-over-year growth 2025-2030 (%)

9.4 Off-trade - Market size and forecast 2025-2030

Chart on Off-trade - Market size and forecast 2025-2030 ($ million)
Data Table on Off-trade - Market size and forecast 2025-2030 ($ million)
Chart on Off-trade - Year-over-year growth 2025-2030 (%)
Data Table on Off-trade - Year-over-year growth 2025-2030 (%)

9.5 Market opportunity by Distribution Channel

Market opportunity by Distribution Channel ($ million)
Data Table on Market opportunity by Distribution Channel ($ million)

10. Market Segmentation by Type

10.1 Market segments

Chart on Type - Market share 2025-2030 (%)
Data Table on Type - Market share 2025-2030 (%)

10.2 Comparison by Type

Chart on Comparison by Type
Data Table on Comparison by Type

10.3 Stout - Market size and forecast 2025-2030

Chart on Stout - Market size and forecast 2025-2030 ($ million)
Data Table on Stout - Market size and forecast 2025-2030 ($ million)
Chart on Stout - Year-over-year growth 2025-2030 (%)
Data Table on Stout - Year-over-year growth 2025-2030 (%)

10.4 Porter - Market size and forecast 2025-2030

Chart on Porter - Market size and forecast 2025-2030 ($ million)
Data Table on Porter - Market size and forecast 2025-2030 ($ million)
Chart on Porter - Year-over-year growth 2025-2030 (%)
Data Table on Porter - Year-over-year growth 2025-2030 (%)

10.5 Market opportunity by Type

Market opportunity by Type ($ million)
Data Table on Market opportunity by Type ($ million)

11. Customer Landscape

11.1 Customer landscape overview

Analysis of price sensitivity, lifecycle, customer purchase basket, adoption rates, and purchase criteria

12. Geographic Landscape

12.1 Geographic segmentation

Chart on Market share by geography 2025-2030 (%)
Data Table on Market share by geography 2025-2030 (%)

12.2 Geographic comparison

Chart on Geographic comparison
Data Table on Geographic comparison

12.3 APAC - Market size and forecast 2025-2030

Chart on APAC - Market size and forecast 2025-2030 ($ million)
Data Table on APAC - Market size and forecast 2025-2030 ($ million)
Chart on APAC - Year-over-year growth 2025-2030 (%)
Data Table on APAC - Year-over-year growth 2025-2030 (%)
Chart on Regional Comparison - APAC
Data Table on Regional Comparison - APAC

12.3.1 China - Market size and forecast 2025-2030

Chart on China - Market size and forecast 2025-2030 ($ million)
Data Table on China - Market size and forecast 2025-2030 ($ million)
Chart on China - Year-over-year growth 2025-2030 (%)
Data Table on China - Year-over-year growth 2025-2030 (%)

12.3.2 Japan - Market size and forecast 2025-2030

Chart on Japan - Market size and forecast 2025-2030 ($ million)
Data Table on Japan - Market size and forecast 2025-2030 ($ million)
Chart on Japan - Year-over-year growth 2025-2030 (%)
Data Table on Japan - Year-over-year growth 2025-2030 (%)

12.3.3 Australia - Market size and forecast 2025-2030

Chart on Australia - Market size and forecast 2025-2030 ($ million)
Data Table on Australia - Market size and forecast 2025-2030 ($ million)
Chart on Australia - Year-over-year growth 2025-2030 (%)
Data Table on Australia - Year-over-year growth 2025-2030 (%)

12.3.4 India - Market size and forecast 2025-2030

Chart on India - Market size and forecast 2025-2030 ($ million)
Data Table on India - Market size and forecast 2025-2030 ($ million)
Chart on India - Year-over-year growth 2025-2030 (%)
Data Table on India - Year-over-year growth 2025-2030 (%)

12.3.5 South Korea - Market size and forecast 2025-2030

Chart on South Korea - Market size and forecast 2025-2030 ($ million)
Data Table on South Korea - Market size and forecast 2025-2030 ($ million)
Chart on South Korea - Year-over-year growth 2025-2030 (%)
Data Table on South Korea - Year-over-year growth 2025-2030 (%)

12.3.6 New Zealand - Market size and forecast 2025-2030

Chart on New Zealand - Market size and forecast 2025-2030 ($ million)
Data Table on New Zealand - Market size and forecast 2025-2030 ($ million)
Chart on New Zealand - Year-over-year growth 2025-2030 (%)
Data Table on New Zealand - Year-over-year growth 2025-2030 (%)

12.4 Europe - Market size and forecast 2025-2030

Chart on Europe - Market size and forecast 2025-2030 ($ million)
Data Table on Europe - Market size and forecast 2025-2030 ($ million)
Chart on Europe - Year-over-year growth 2025-2030 (%)
Data Table on Europe - Year-over-year growth 2025-2030 (%)
Chart on Regional Comparison - Europe
Data Table on Regional Comparison - Europe

12.4.1 UK - Market size and forecast 2025-2030

Chart on UK - Market size and forecast 2025-2030 ($ million)
Data Table on UK - Market size and forecast 2025-2030 ($ million)
Chart on UK - Year-over-year growth 2025-2030 (%)
Data Table on UK - Year-over-year growth 2025-2030 (%)

12.4.2 Ireland - Market size and forecast 2025-2030

Chart on Ireland - Market size and forecast 2025-2030 ($ million)
Data Table on Ireland - Market size and forecast 2025-2030 ($ million)
Chart on Ireland - Year-over-year growth 2025-2030 (%)
Data Table on Ireland - Year-over-year growth 2025-2030 (%)

12.4.3 Germany - Market size and forecast 2025-2030

Chart on Germany - Market size and forecast 2025-2030 ($ million)
Data Table on Germany - Market size and forecast 2025-2030 ($ million)
Chart on Germany - Year-over-year growth 2025-2030 (%)
Data Table on Germany - Year-over-year growth 2025-2030 (%)

12.4.4 Poland - Market size and forecast 2025-2030

Chart on Poland - Market size and forecast 2025-2030 ($ million)
Data Table on Poland - Market size and forecast 2025-2030 ($ million)
Chart on Poland - Year-over-year growth 2025-2030 (%)
Data Table on Poland - Year-over-year growth 2025-2030 (%)

12.4.5 Spain - Market size and forecast 2025-2030

Chart on Spain - Market size and forecast 2025-2030 ($ million)
Data Table on Spain - Market size and forecast 2025-2030 ($ million)
Chart on Spain - Year-over-year growth 2025-2030 (%)
Data Table on Spain - Year-over-year growth 2025-2030 (%)

12.4.6 The Netherlands - Market size and forecast 2025-2030

Chart on The Netherlands - Market size and forecast 2025-2030 ($ million)
Data Table on The Netherlands - Market size and forecast 2025-2030 ($ million)
Chart on The Netherlands - Year-over-year growth 2025-2030 (%)
Data Table on The Netherlands - Year-over-year growth 2025-2030 (%)

12.5 North America - Market size and forecast 2025-2030

Chart on North America - Market size and forecast 2025-2030 ($ million)
Data Table on North America - Market size and forecast 2025-2030 ($ million)
Chart on North America - Year-over-year growth 2025-2030 (%)
Data Table on North America - Year-over-year growth 2025-2030 (%)
Chart on Regional Comparison - North America
Data Table on Regional Comparison - North America

12.5.1 US - Market size and forecast 2025-2030

Chart on US - Market size and forecast 2025-2030 ($ million)
Data Table on US - Market size and forecast 2025-2030 ($ million)
Chart on US - Year-over-year growth 2025-2030 (%)
Data Table on US - Year-over-year growth 2025-2030 (%)

12.5.2 Canada - Market size and forecast 2025-2030

Chart on Canada - Market size and forecast 2025-2030 ($ million)
Data Table on Canada - Market size and forecast 2025-2030 ($ million)
Chart on Canada - Year-over-year growth 2025-2030 (%)
Data Table on Canada - Year-over-year growth 2025-2030 (%)

12.5.3 Mexico - Market size and forecast 2025-2030

Chart on Mexico - Market size and forecast 2025-2030 ($ million)
Data Table on Mexico - Market size and forecast 2025-2030 ($ million)
Chart on Mexico - Year-over-year growth 2025-2030 (%)
Data Table on Mexico - Year-over-year growth 2025-2030 (%)

12.6 South America - Market size and forecast 2025-2030

Chart on South America - Market size and forecast 2025-2030 ($ million)
Data Table on South America - Market size and forecast 2025-2030 ($ million)
Chart on South America - Year-over-year growth 2025-2030 (%)
Data Table on South America - Year-over-year growth 2025-2030 (%)
Chart on Regional Comparison - South America
Data Table on Regional Comparison - South America

12.6.1 Brazil - Market size and forecast 2025-2030

Chart on Brazil - Market size and forecast 2025-2030 ($ million)
Data Table on Brazil - Market size and forecast 2025-2030 ($ million)
Chart on Brazil - Year-over-year growth 2025-2030 (%)
Data Table on Brazil - Year-over-year growth 2025-2030 (%)

12.6.2 Argentina - Market size and forecast 2025-2030

Chart on Argentina - Market size and forecast 2025-2030 ($ million)
Data Table on Argentina - Market size and forecast 2025-2030 ($ million)
Chart on Argentina - Year-over-year growth 2025-2030 (%)
Data Table on Argentina - Year-over-year growth 2025-2030 (%)

12.6.3 Colombia - Market size and forecast 2025-2030

Chart on Colombia - Market size and forecast 2025-2030 ($ million)
Data Table on Colombia - Market size and forecast 2025-2030 ($ million)
Chart on Colombia - Year-over-year growth 2025-2030 (%)
Data Table on Colombia - Year-over-year growth 2025-2030 (%)

12.7 Middle East and Africa - Market size and forecast 2025-2030

Chart on Middle East and Africa - Market size and forecast 2025-2030 ($ million)
Data Table on Middle East and Africa - Market size and forecast 2025-2030 ($ million)
Chart on Middle East and Africa - Year-over-year growth 2025-2030 (%)
Data Table on Middle East and Africa - Year-over-year growth 2025-2030 (%)
Chart on Regional Comparison - Middle East and Africa
Data Table on Regional Comparison - Middle East and Africa

12.7.1 South Africa - Market size and forecast 2025-2030

Chart on South Africa - Market size and forecast 2025-2030 ($ million)
Data Table on South Africa - Market size and forecast 2025-2030 ($ million)
Chart on South Africa - Year-over-year growth 2025-2030 (%)
Data Table on South Africa - Year-over-year growth 2025-2030 (%)

12.7.2 Nigeria - Market size and forecast 2025-2030

Chart on Nigeria - Market size and forecast 2025-2030 ($ million)
Data Table on Nigeria - Market size and forecast 2025-2030 ($ million)
Chart on Nigeria - Year-over-year growth 2025-2030 (%)
Data Table on Nigeria - Year-over-year growth 2025-2030 (%)

12.7.3 Kenya - Market size and forecast 2025-2030

Chart on Kenya - Market size and forecast 2025-2030 ($ million)
Data Table on Kenya - Market size and forecast 2025-2030 ($ million)
Chart on Kenya - Year-over-year growth 2025-2030 (%)
Data Table on Kenya - Year-over-year growth 2025-2030 (%)

12.7.4 Ethiopia - Market size and forecast 2025-2030

Chart on Ethiopia - Market size and forecast 2025-2030 ($ million)
Data Table on Ethiopia - Market size and forecast 2025-2030 ($ million)
Chart on Ethiopia - Year-over-year growth 2025-2030 (%)
Data Table on Ethiopia - Year-over-year growth 2025-2030 (%)

12.7.5 Angola - Market size and forecast 2025-2030

Chart on Angola - Market size and forecast 2025-2030 ($ million)
Data Table on Angola - Market size and forecast 2025-2030 ($ million)
Chart on Angola - Year-over-year growth 2025-2030 (%)
Data Table on Angola - Year-over-year growth 2025-2030 (%)

12.8 Market opportunity by geography

Market opportunity by geography ($ million)
Data Tables on Market opportunity by geography ($ million)

13. Drivers, Challenges, and Opportunity

13.1 Market drivers

Global proliferation of craft brewing culture and trend of premiumization
Culinary versatility and integration of innovative flavor profiles
Technological advancements in distribution and rise of direct digital engagement

13.2 Market challenges

Intensification of supply chain volatility and raw material procurement costs
Proliferation of health-conscious consumption and rise of low-calorie alternatives
Technical brewing complexities and high barriers to entry for specialized production

13.3 Impact of drivers and challenges

Impact of drivers and challenges in 2025 and 2030

13.4 Market opportunities

Evolution of consumer preference toward indulgent and dessert-inspired profiles
Integration of sustainability and ethical sourcing in dark beer production
Sophistication of wood-aging and premiumization of barrel-aged varieties

14. Competitive Landscape

14.1 Overview

14.2

Overview on criticality of inputs and factors of differentiation

14.3 Landscape disruption

Overview on factors of disruption

14.4 Industry risks

Impact of key risks on business

15. Competitive Analysis

15.1 Companies profiled

Companies covered

15.2 Company ranking index

15.3 Market positioning of companies

Matrix on companies position and classification

15.4 Anheuser Busch InBev SA NV

Anheuser Busch InBev SA NV - Overview
Anheuser Busch InBev SA NV - Business segments
Anheuser Busch InBev SA NV - Key offerings
Anheuser Busch InBev SA NV - Segment focus
SWOT

15.5 Asahi Group Holdings Ltd.

Asahi Group Holdings Ltd. - Overview
Asahi Group Holdings Ltd. - Business segments
Asahi Group Holdings Ltd. - Key offerings
Asahi Group Holdings Ltd. - Segment focus
SWOT

15.6 Carlsberg Breweries AS

Carlsberg Breweries AS - Overview
Carlsberg Breweries AS - Business segments
Carlsberg Breweries AS - Key news
Carlsberg Breweries AS - Key offerings
Carlsberg Breweries AS - Segment focus
SWOT

15.7 Coopers Brewery Ltd.

Coopers Brewery Ltd. - Overview
Coopers Brewery Ltd. - Product / Service
Coopers Brewery Ltd. - Key offerings
SWOT

15.8 Deschutes Brewery

Deschutes Brewery - Overview
Deschutes Brewery - Product / Service
Deschutes Brewery - Key offerings
SWOT

15.9 Diageo PLC

Diageo PLC - Overview
Diageo PLC - Business segments
Diageo PLC - Key offerings
Diageo PLC - Segment focus
SWOT

15.10 Fuller, Smith and Turner P.L.C.

Fuller, Smith and Turner P.L.C. - Overview
Fuller, Smith and Turner P.L.C. - Product / Service
Fuller, Smith and Turner P.L.C. - Key offerings
SWOT

15.11 Goose Island Beer Co.

Goose Island Beer Co. - Overview
Goose Island Beer Co. - Product / Service
Goose Island Beer Co. - Key offerings
SWOT

15.12 Guinness

Guinness - Overview
Guinness - Product / Service
Guinness - Key offerings
SWOT

15.13 Kirin Holdings Co. Ltd.

Kirin Holdings Co. Ltd. - Overview
Kirin Holdings Co. Ltd. - Business segments
Kirin Holdings Co. Ltd. - Key offerings
Kirin Holdings Co. Ltd. - Segment focus
SWOT

15.14 Molson Coors Beverage Co.

Molson Coors Beverage Co. - Overview
Molson Coors Beverage Co. - Business segments
Molson Coors Beverage Co. - Key news
Molson Coors Beverage Co. - Key offerings
Molson Coors Beverage Co. - Segment focus
SWOT

15.15 Sierra Nevada Brewing Co.

Sierra Nevada Brewing Co. - Overview
Sierra Nevada Brewing Co. - Product / Service
Sierra Nevada Brewing Co. - Key offerings
SWOT

15.16 Stone Brewing Co. LLC

Stone Brewing Co. LLC - Overview
Stone Brewing Co. LLC - Product / Service
Stone Brewing Co. LLC - Key offerings
SWOT

15.17 The Boston Beer Co. Inc.

The Boston Beer Co. Inc. - Overview
The Boston Beer Co. Inc. - Product / Service
The Boston Beer Co. Inc. - Key offerings
SWOT

15.18 The Brooklyn Brewery Corp.

The Brooklyn Brewery Corp. - Overview
The Brooklyn Brewery Corp. - Product / Service
The Brooklyn Brewery Corp. - Key offerings
SWOT

16. Appendix

16.1 Scope of the report

Market definition
Objectives
Notes and caveats

16.2 Inclusions and exclusions checklist

Inclusions checklist
Exclusions checklist

16.3 Currency conversion rates for US$

16.4 Research methodology

16.5 Data procurement

Information sources

16.6 Data validation

16.7 Validation techniques employed for market sizing

16.8 Data synthesis

16.9 360 degree market analysis

16.10 List of abbreviations

Research Methodology

Technavio presents a detailed picture of the market by way of study, synthesis, and summation of data from multiple sources. The analysts have presented the various facets of the market with a particular focus on identifying the key industry influencers. The data thus presented is comprehensive, reliable, and the result of extensive research, both primary and secondary.

INFORMATION SOURCES

Primary sources

  • Manufacturers and suppliers
  • Channel partners
  • Industry experts
  • Strategic decision makers

Secondary sources

  • Industry journals and periodicals
  • Government data
  • Financial reports of key industry players
  • Historical data
  • Press releases

DATA ANALYSIS

Data Synthesis

  • Collation of data
  • Estimation of key figures
  • Analysis of derived insights

Data Validation

  • Triangulation with data models
  • Reference against proprietary databases
  • Corroboration with industry experts

REPORT WRITING

Qualitative

  • Market drivers
  • Market challenges
  • Market trends
  • Five forces analysis

Quantitative

  • Market size and forecast
  • Market segmentation
  • Geographical insights
  • Competitive landscape

Interested in this report?

Get your sample now to see our research methodology and insights!

Download Now

Frequently Asked Questions

Stout And Porter Beer market growth will increase by USD 21248.7 million during 2026-2030.

The Stout And Porter Beer market is expected to grow at a CAGR of 5.2% during 2026-2030.

Stout And Porter Beer market is segmented by Packaging (Cans, Bottles) Distribution channel (On-trade, Off-trade) Type (Stout, Porter)

Anheuser Busch InBev SA NV, Asahi Group Holdings Ltd., Brewery Ommegang, Carlsberg Breweries AS, Coopers Brewery Ltd., Deschutes Brewery, Diageo PLC, Fuller, Smith and Turner P.L.C., Goose Island Beer Co., Guinness, Kirin Holdings Co. Ltd., Molson Coors Beverage Co., New Belgium Brewing Co. Inc., North Coast Brewing Co., Oskar Blues, Samuel Smith Old Brewery, Sierra Nevada Brewing Co., Stone Brewing Co. LLC, The Boston Beer Co. Inc., The Brooklyn Brewery Corp. are a few of the key vendors in the Stout And Porter Beer market.

APAC will register the highest growth rate of 41.2% among the other regions. Therefore, the Stout And Porter Beer market in APAC is expected to garner significant business opportunities for the vendors during the forecast period.

China, Japan, Australia, India, South Korea, New Zealand, UK, Ireland, Germany, Poland, Spain, The Netherlands, US, Canada, Mexico, Brazil, Argentina, Colombia, South Africa, Nigeria, Kenya, Ethiopia, Angola

  • Global proliferation of craft brewing culture and trend of premiumization is the driving factor this market.

The Stout And Porter Beer market vendors should focus on grabbing business opportunities from the Packaging segment as it accounted for the largest market share in the base year.
RIA - Research AI Assistant
Ask RIA
