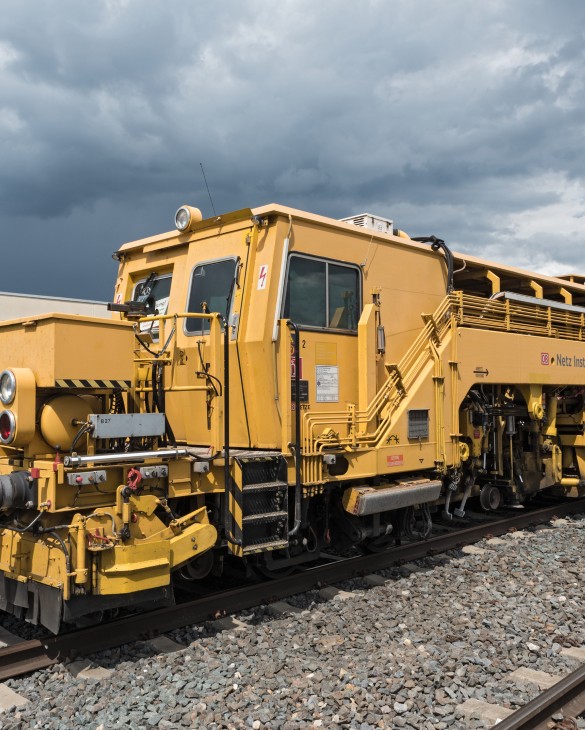
Tamping Machine Market Analysis, Size, and Forecast 2026-2030: APAC (China, Japan, and India), Europe (Germany, UK, and France), North America (US, Canada, and Mexico), South America (Brazil, Argentina, and Colombia), Middle East and Africa (Saudi Arabia, South Africa, and UAE), and Rest of World (ROW)

Tamping Machine Market Analysis, Size, and Forecast 2026-2030:
APAC (China, Japan, and India), Europe (Germany, UK, and France), North America (US, Canada, and Mexico), South America (Brazil, Argentina, and Colombia), Middle East and Africa (Saudi Arabia, South Africa, and UAE), and Rest of World (ROW)

Published: Oct 2026 285 Pages SKU: IRTNTR81683

Market Overview at a Glance

$485.5 Mn
Market Opportunity
4.7%
CAGR 2025 - 2030
46.9%
APAC Growth
$853.1 Mn
Universal tamping machines segment 2024

Tamping Machine Market Size 2026-2030

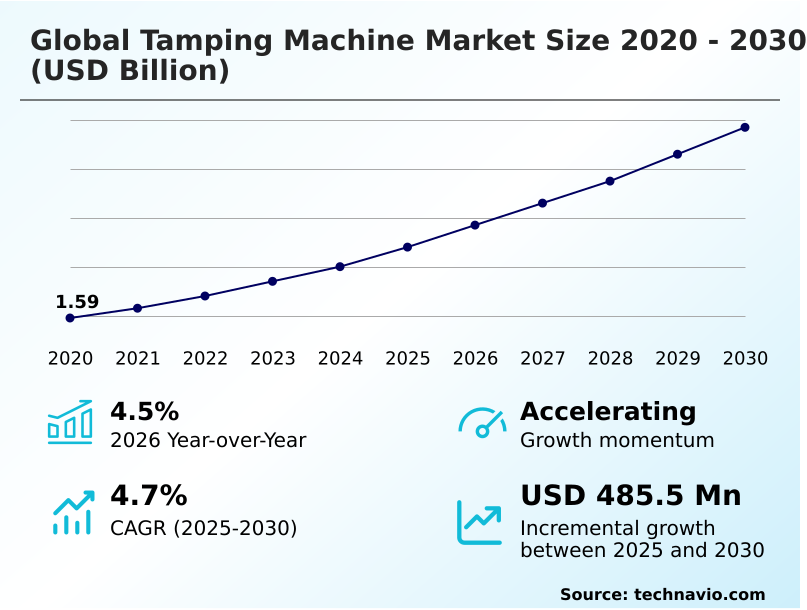
The tamping machine market size is valued to increase by USD 485.5 million, at a CAGR of 4.7% from 2025 to 2030. Accelerating high-speed rail infrastructure investments and network expansions will drive the tamping machine market.

Major Market Trends & Insights

  • APAC dominated the market and accounted for a 46.9% growth during the forecast period.
  • By Product Type - Universal tamping machines segment was valued at USD 853.1 million in 2024
  • By Application - Track maintenance and renewal segment accounted for the largest market revenue share in 2024

Market Size & Forecast

  • Market Opportunities: USD 773.6 million
  • Market Future Opportunities: USD 485.5 million
  • CAGR from 2025 to 2030 : 4.7%

Market Summary

  • The Tamping Machine market demonstrates sustained expansion driven by the critical necessity to maintain geometric precision across increasingly congested passenger and freight rail networks. In commercial logistics scenarios, heavy-haul freight operators utilize automated track measurement sensors to assess ballast degradation without interrupting cargo transit.
  • This proactive strategy allows network managers to schedule maintenance precisely, reducing unexpected track closures by 20% compared to reactive repair protocols. A primary driver of this sector is the rapid expansion of high-speed rail infrastructure, which demands flawless track alignment to ensure safe, high-velocity travel.
  • However, structural challenges persist due to the prohibitive capital costs associated with acquiring sophisticated multi-sleeper maintenance vehicles. Regional rail authorities frequently encounter budget constraints, extending the lifecycle of legacy equipment rather than investing in modern digital units.
  • Despite these financial hurdles, the integration of predictive maintenance models continues to optimize asset utilization, ensuring that mechanized track stabilization remains a fundamental component of modern transit engineering.

What will be the Size of the Tamping Machine Market during the forecast period?
Get Key Insights on Market Forecast (PDF) Get Free Sample

How is the Tamping Machine Market Segmented?

The tamping machine industry research report provides comprehensive data (region-wise segment analysis), with forecasts and estimates in "USD million" for the period 2026-2030, as well as historical data from 2020-2024 for the following segments.

  • Product type
    • Universal tamping machines
    • Plain track tamping machines
    • Points and crossings tamping machines
  • Application
    • Track maintenance and renewal
    • New track construction
  • Type
    • Single sleeper tamping machines
    • Multi sleeper tamping machines
  • Geography
    • APAC
      • China
      • Japan
      • India
      • South Korea
      • Australia
      • Indonesia
    • Europe
      • Germany
      • UK
      • France
      • Italy
      • Spain
      • The Netherlands
    • North America
      • US
      • Canada
      • Mexico
    • South America
      • Brazil
      • Argentina
      • Colombia
    • Middle East and Africa
      • Saudi Arabia
      • South Africa
      • UAE
      • Turkey
      • Israel

By Product Type Insights

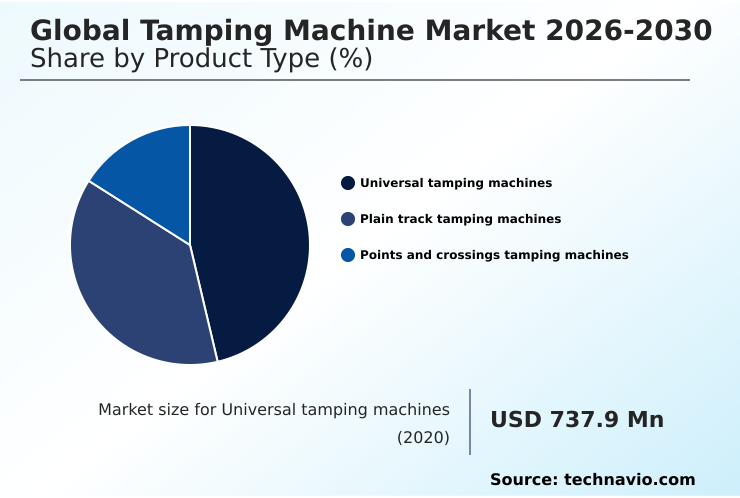
The universal tamping machines segment is estimated to witness significant growth during the forecast period.

Universal tamping machines operate as highly adaptable assets, seamlessly transitioning between standard open rail lines and complex switch zones to maximize equipment utilization rates.

By combining the capabilities of plain track and specialized turnout equipment, these units effectively streamline railway maintenance operations. Infrastructure managers leverage continuous-action tamping mechanisms and multi-sleeper tamping vehicles to execute precise track geometry parameters without needing separate specialized fleets.

This multi-purpose functionality reduces transport delays between worksites, allowing track access windows to be optimized. Consequently, deployment of these adaptable systems has improved operational turnaround by 25% compared to single-purpose machinery.

The integration of advanced ballast compaction units supports high-speed rail infrastructure by maintaining strict alignment tolerances. This unified approach delivers a 15% reduction in overall maintenance cycle durations, ensuring continuous commercial train mobility.
Get Free Sample

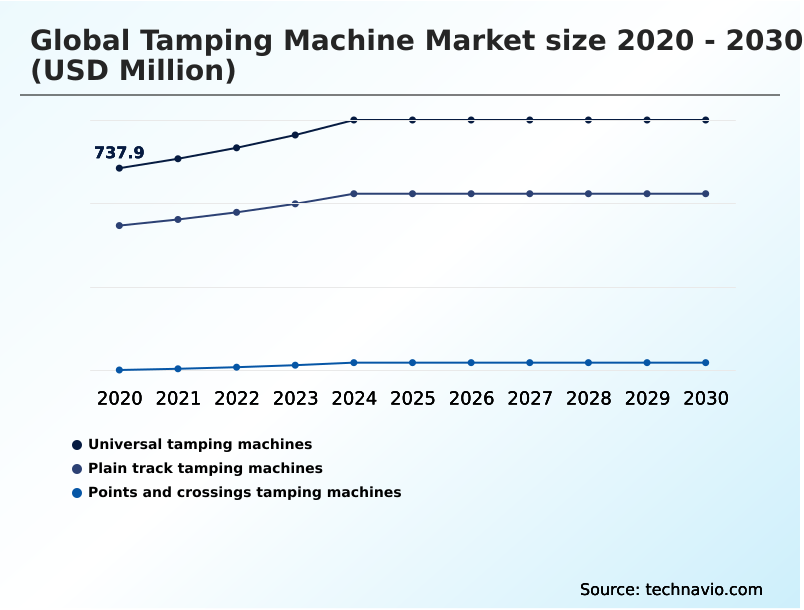
The Universal tamping machines segment was valued at USD 853.1 million in 2024 and showed a gradual increase during the forecast period.
Get Free Sample

Regional Analysis

APAC is estimated to contribute 46.9% to the growth of the global market during the forecast period.Technavio’s analysts have elaborately explained the regional trends and drivers that shape the market during the forecast period.
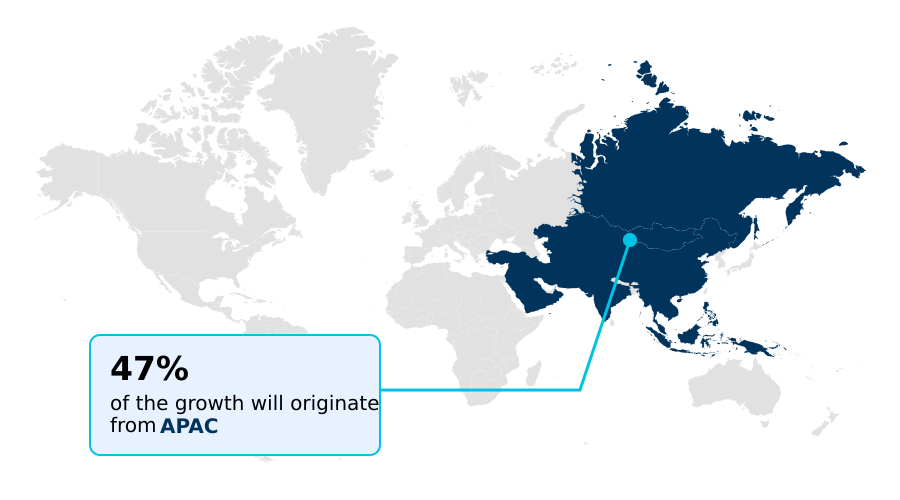
See How Tamping Machine Market Demand is Rising in APAC Get Free Sample

Regional demand for track maintenance machinery varies significantly based on network density and industrial application. APAC leads the sector through massive network construction and heavy-haul freight corridors, requiring continuous track bed stabilization.

In contrast, Europe prioritizes the modernization of aging, high-density networks through digital twin integration and stringent environmental compliance. APAC rail operators deploy intelligent tamping units to accommodate massive cargo volumes, improving track processing efficiency by 18% over legacy methods.

Meanwhile, European authorities focus on minimizing noise and emissions, utilizing automated systems that reduce localized operational costs by 12% during restricted nighttime maintenance.

Furthermore, North America exhibits steady adoption of hybrid technologies to extend infrastructure lifecycle costs across vast freight lines, lowering fuel expenditures by nearly 15%.

These geographic distinctions highlight how differing regulatory environments and traffic volumes dictate specialized equipment procurement strategies across international railway networks.

Market Dynamics

Our researchers analyzed the data with 2025 as the base year, along with the key drivers, trends, and challenges. A holistic analysis of drivers will help companies refine their marketing strategies to gain a competitive advantage.

  • Modern railway engineering depends entirely on the structural integrity of the underlying ballast bed to sustain safe and efficient train operations. As freight tonnage and passenger velocities increase, network managers are rapidly shifting toward automated railway track geometry correction to eliminate manual variances and ensure compliance with strict safety parameters.
  • This transition fundamentally optimizes supply chain logistics by minimizing track-related transit delays. Heavy industrial routes specifically require high-capacity continuous track stabilization to counteract the severe mechanical degradation caused by excessive axle loads. By executing these proactive measures, rail operators achieve a nearly 25% improvement in overall track lifecycle longevity compared to networks relying on reactive spot repairs.
  • To further elevate precision, infrastructure authorities are integrating intelligent ballast compaction monitoring tools that provide real-time data on substrate density, allowing crews to verify structural soundness immediately during the tamping process. Urban transit networks facing strict emission regulations are increasingly adopting battery-electric multi-sleeper tamping equipment, which eliminates direct exhaust output while drastically lowering noise pollution during sensitive nighttime access windows.
  • For expansive cross-continental freight routes, laser-guided heavy-haul track maintenance has become an indispensable asset, ensuring absolute accuracy over thousands of miles. Ultimately, the systematic deployment of these advanced technologies allows transportation networks to maximize fleet velocity, reduce unscheduled downtime, and streamline complex operational planning across diverse geographic environments.
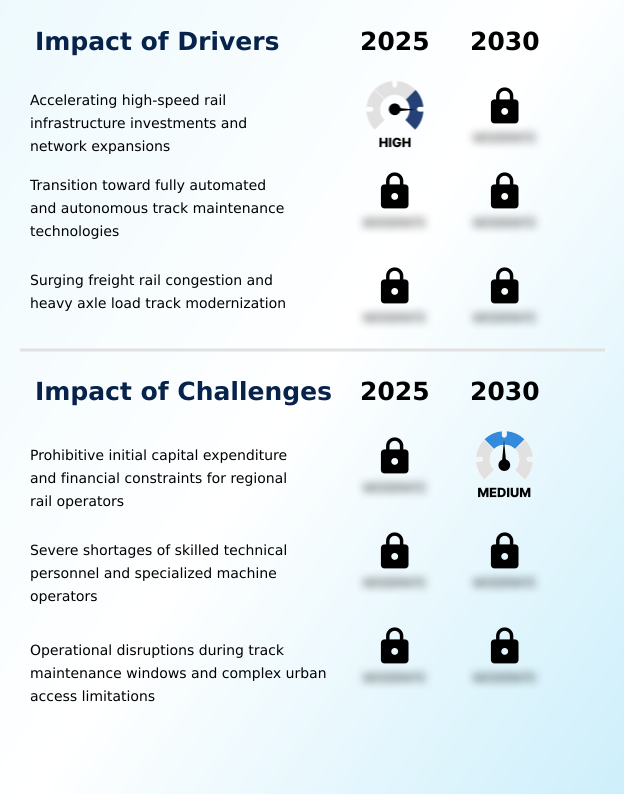
What are the key market drivers leading to the rise in the adoption of Tamping Machine Industry?

  • Accelerating investments in high-speed rail infrastructure and extensive network expansions serve as the primary catalyst propelling global demand for advanced track maintenance machinery.

  • Rising global trade volumes and the corresponding expansion of industrial logistics have severely intensified heavy axle traffic loads on existing rail foundations. This relentless mechanical stress deteriorates track stability rapidly, creating a critical operational requirement for heavy-duty continuous tamping machines.
  • Transit authorities are accelerating the procurement of these advanced units because maintaining uniform ballast packing density is essential to prevent catastrophic derailments and preserve fluid transit routes.
  • By utilizing multi-point lifting mechanisms paired with automated track measurement sensors, infrastructure managers have successfully mitigated freight rail congestion, increasing overall throughput capacity by 22%.
  • Furthermore, this proactive approach to structural reinforcement has lowered unexpected track maintenance costs by roughly 18%. Ultimately, continuous fleet modernization guarantees reliable, high-velocity freight movement across demanding operational environments.

What are the market trends shaping the Tamping Machine Industry?

  • The integration of electric and hybrid propulsion systems into track maintenance equipment has emerged as a defining trend. This shift is primarily driven by stringent environmental regulations requiring lower emissions during urban railway operations.

  • The transition toward highly digitized railway maintenance represents a defining shift in modern infrastructure management. Operations are increasingly deploying three-dimensional laser measuring technology alongside automated turnout recognition software to instantly process complex switch geometries without manual intervention. This technological adoption occurs because aging rail networks require faster, more precise interventions during restricted overnight windows.
  • As a result, maintenance crews have reduced diagnostic inspection times by nearly 35% while simultaneously improving alignment accuracy by 20%. Furthermore, digital data logging capabilities combined with continuous track measurement systems enable predictive analytics that verify ballast integrity in real time.
  • To address urban noise regulations, operators are integrating acoustic attenuation technology with dynamic track stabilizers, achieving a 15% decrease in localized noise pollution. These integrated innovations empower transit authorities to maximize network availability and streamline operational budgeting.

What challenges does the Tamping Machine Industry face during its growth?

  • Prohibitive initial capital expenditures and subsequent financial constraints among regional rail operators present a formidable barrier to widespread equipment modernization.

  • The execution of precise track alignment is consistently obstructed by severe logistical constraints and diminishing track possession times on highly congested corridors. High-frequency train schedules severely limit operational periods, forcing maintenance crews to condense complex stabilization procedures into narrow, high-pressure timeframes. This bottleneck occurs because passenger and freight demands prioritize continuous transit over infrastructural downtime.
  • Consequently, deploying massive rail-bound maintenance equipment becomes logistically complex, often reducing effective operational output by up to 30% during fragmented shifts. Furthermore, the lack of seamless structural settlement prediction and predictive maintenance models across legacy networks forces operators into reactive repair cycles, inadvertently increasing long-term capital repair expenses by approximately 15%.
  • Overcoming these formidable access limitations requires highly agile machinery capable of maximizing productivity without disrupting daily schedules.

Exclusive Technavio Analysis on Customer Landscape

The tamping machine market forecasting report includes the adoption lifecycle of the market, covering from the innovator’s stage to the laggard’s stage. It focuses on adoption rates in different regions based on penetration. Furthermore, the tamping machine market report also includes key purchase criteria and drivers of price sensitivity to help companies evaluate and develop their market growth analysis strategies.
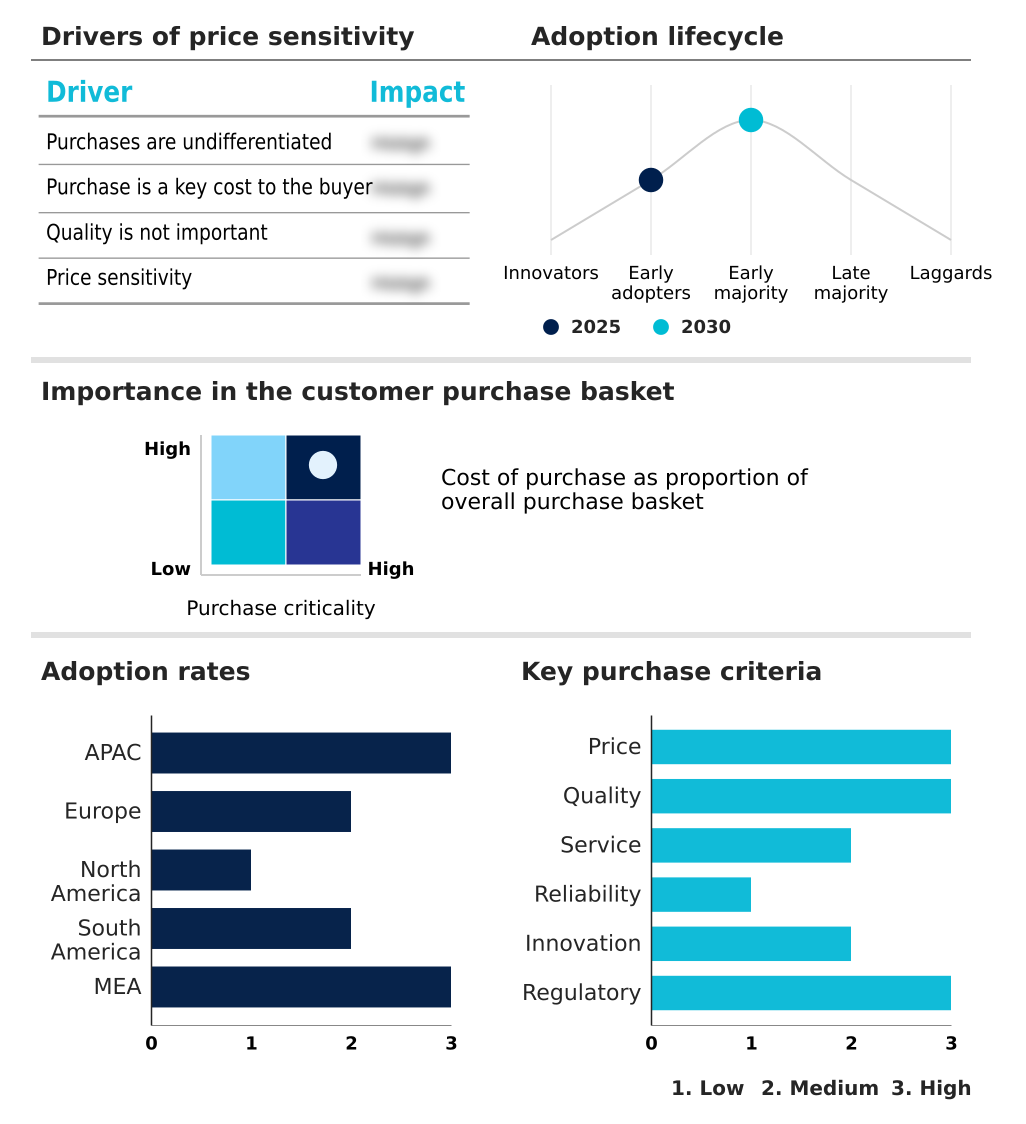
Customer Landscape of Tamping Machine Industry

Competitive Landscape

Companies are implementing various strategies, such as strategic alliances, tamping machine market forecast, partnerships, mergers and acquisitions, geographical expansion, and product/service launches, to enhance their presence in the industry.

Balfour Beatty Plc - The portfolio features an advanced fleet of mechanized tamping units engineered specifically for integrated track maintenance, delivering robust structural alignment and reliable railway corridor preservation.

The industry research and growth report includes detailed analyses of the competitive landscape of the market and information about key companies, including:

  • Balfour Beatty Plc
  • CRRC Corp. Ltd.
  • Geismar
  • Harsco Corp
  • MATISA MATERIEL INDUSTRIEL
  • Plasser and Theurer
  • Progress Rail Corp
  • ROBEL GmbH
  • Sinara Group
  • Strukton Groep NV

Qualitative and quantitative analysis of companies has been conducted to help clients understand the wider business environment as well as the strengths and weaknesses of key industry players. Data is qualitatively analyzed to categorize companies as pure play, category-focused, industry-focused, and diversified; it is quantitatively analyzed to categorize companies as dominant, leading, strong, tentative, and weak.

Recent Development and News in Tamping machine market

  • In the Rail Transportation industry, the aggressive expansion of high-capacity logistics lines to support supply chain velocity has drastically increased mechanical stress on existing track foundations, directly impacting Tamping Machine demand by accelerating the requirement for heavy-duty ballast consolidation equipment.
  • The mandated transition toward carbon neutrality targets across urban mass transit networks has spurred the electrification of rail-bound maintenance vehicles, pulling Tamping Machine demand toward zero-emission battery-electric platforms that operate within strict municipal acoustic regulations.
  • Stringent passenger safety standards implemented by national rail authorities mandate narrower track geometry tolerances, forcing railway maintenance operations to deploy continuous condition monitoring tools, which drives the Tamping Machine market toward units equipped with sophisticated digital diagnostics.
  • Capital allocations for cross-border rail projects and rail network modernization initiatives have minimized available track possession times, directly driving the Tamping Machine market as operators procure high-speed automated technology adoption to maximize output during restricted maintenance periods.

Dive into Technavio’s robust research methodology, blending expert interviews, extensive data synthesis, and validated models for unparalleled Tamping Machine Market insights. See full methodology.

Market Scope
Page number 285
Base year 2025
Historic period 2020-2024
Forecast period 2026-2030
Growth momentum & CAGR Accelerate at a CAGR of 4.7%
Market growth 2026-2030 USD 485.5 million
Market structure Concentrated
YoY growth 2025-2026(%) 4.5%
Key countries China, Japan, India, South Korea, Australia, Indonesia, Germany, UK, France, Italy, Spain, The Netherlands, US, Canada, Mexico, Brazil, Argentina, Colombia, Saudi Arabia, South Africa, UAE, Turkey and Israel
Competitive landscape Leading Companies, Market Positioning of Companies, Competitive Strategies, and Industry Risks

Request Free Sample

Research Analyst Overview

  • The structural integrity of transit networks depends heavily on the deployment of sophisticated mechanized track maintenance solutions. Boardroom executives are increasingly prioritizing sustainability mandates by investing in hybrid propulsion systems and zero-emission battery-electric vehicles to execute complex track geometry restorations in heavily regulated urban environments.
  • This shift directly addresses municipal noise compliance while cutting operational fuel expenditures by an estimated 25% compared to conventional diesel operations. Modern fleets now utilize laser-guided measuring systems and optical measurement systems to guarantee absolute precision during high-speed alignments. In tandem, high-frequency vibration units deliver optimized ballast consolidation without fracturing the aggregate structure.
  • Fleet managers also rely on satellite-based positioning and automated ballast profiling systems to trace equipment movement and execute flawless preventative maintenance across vast geographical spans. Furthermore, the incorporation of kinetic energy recovery systems mitigates power waste during cyclic operations.
  • These targeted technological procurements enable infrastructure authorities to maximize track availability, ensure uncompromising passenger safety, and dramatically streamline the overall logistics of railway corridor management.

What are the Key Data Covered in this Tamping Machine Market Research and Growth Report?

  • What is the expected growth of the Tamping Machine Market between 2026 and 2030?

    • USD 485.5 million, at a CAGR of 4.7%

  • What segmentation does the market report cover?

    • The report is segmented by Product Type (Universal tamping machines, Plain track tamping machines, and Points and crossings tamping machines), Application (Track maintenance and renewal, and New track construction), Type (Single sleeper tamping machines, and Multi sleeper tamping machines) and Geography (APAC, Europe, North America, South America, Middle East and Africa)

  • Which regions are analyzed in the report?

    • APAC, Europe, North America, South America and Middle East and Africa

  • What are the key growth drivers and market challenges?

    • Accelerating high-speed rail infrastructure investments and network expansions, Prohibitive initial capital expenditure and financial constraints for regional rail operators

  • Who are the major players in the Tamping Machine Market?

    • Balfour Beatty Plc, CRRC Corp. Ltd., Geismar, Harsco Corp, MATISA MATERIEL INDUSTRIEL, Plasser and Theurer, Progress Rail Corp, ROBEL GmbH, Sinara Group and Strukton Groep NV

Market Research Insights

  • The continuous evolution of modern rail transit demands highly precise track alignment corrections to uphold rigorous passenger safety standards and facilitate continuous freight movement. To combat rapid ballast degradation, infrastructure managers are accelerating automated technology adoption, which has demonstrated a 30% improvement in maintenance turnaround times.
  • By leveraging advanced data analytics for structural settlement prediction, operators can deploy targeted interventions that reduce unexpected line closures by roughly 22%. Compliance with strict railway engineering standards ensures that mechanized stabilization procedures optimize supply chain reliability without disrupting daily schedules.
  • These strategic upgrades directly enhance operational resilience, extending asset longevity and lowering long-term capital maintenance expenditures across critical transit corridors.

We can help! Our analysts can customize this tamping machine market research report to meet your requirements.

Get in touch

1. Executive Summary

1.1 Market overview

Executive Summary - Chart on Market Overview
Executive Summary - Data Table on Market Overview
Executive Summary - Chart on Global Market Characteristics
Executive Summary - Chart on Market by Geography
Executive Summary - Chart on Market Segmentation by Product Type
Executive Summary - Chart on Market Segmentation by Application
Executive Summary - Chart on Market Segmentation by Type
Executive Summary - Chart on Incremental Growth
Executive Summary - Data Table on Incremental Growth
Executive Summary - Chart on Company Market Positioning

2. Technavio Analysis

2.1 Analysis of price sensitivity, lifecycle, customer purchase basket, adoption rates, and purchase criteria

2.2 Criticality of inputs and Factors of differentiation

Chart on Overview on criticality of inputs and factors of differentiation

2.3 Factors of disruption

Chart on Overview on factors of disruption

2.4 Impact of drivers and challenges

Chart on Impact of drivers and challenges in 2025 and 2030

3. Market Landscape

3.1 Market ecosystem

Chart on Parent Market
Data Table on - Parent Market

3.2 Market characteristics

Chart on Market characteristics analysis

3.3 Value chain analysis

Chart on Value chain analysis

4. Market Sizing

4.1 Market definition

Data Table on Offerings of companies included in the market definition

4.2 Market segment analysis

Market segments

4.3 Market size 2025

4.4 Market outlook: Forecast for 2025-2030

Chart on Global - Market size and forecast 2025-2030 ($ million)
Data Table on Global - Market size and forecast 2025-2030 ($ million)
Chart on Global Market: Year-over-year growth 2025-2030 (%)
Data Table on Global Market: Year-over-year growth 2025-2030 (%)

5. Historic Market Size

5.1 Global Tamping Machine Market 2020 - 2024

Historic Market Size - Data Table on Global Tamping Machine Market 2020 - 2024 ($ million)

5.2 Product Type segment analysis 2020 - 2024

Historic Market Size - Product Type Segment 2020 - 2024 ($ million)

5.3 Application segment analysis 2020 - 2024

Historic Market Size - Application Segment 2020 - 2024 ($ million)

5.4 Type segment analysis 2020 - 2024

Historic Market Size - Type Segment 2020 - 2024 ($ million)

5.5 Geography segment analysis 2020 - 2024

Historic Market Size - Geography Segment 2020 - 2024 ($ million)

5.6 Country segment analysis 2020 - 2024

Historic Market Size - Country Segment 2020 - 2024 ($ million)

6. Qualitative Analysis

6.1 Impact of AI on Global Tamping Machine Market

6.2 Impact of Geopolitical Conflicts on Global Tamping Machine Market

7. Five Forces Analysis

7.1 Five forces summary

Five forces analysis - Comparison between 2025 and 2030

7.2 Bargaining power of buyers

Bargaining power of buyers - Impact of key factors 2025 and 2030

7.3 Bargaining power of suppliers

Bargaining power of suppliers - Impact of key factors in 2025 and 2030

7.4 Threat of new entrants

Threat of new entrants - Impact of key factors in 2025 and 2030

7.5 Threat of substitutes

Threat of substitutes - Impact of key factors in 2025 and 2030

7.6 Threat of rivalry

Threat of rivalry - Impact of key factors in 2025 and 2030

7.7 Market condition

Chart on Market condition - Five forces 2025 and 2030

8. Market Segmentation by Product Type

8.1 Market segments

Chart on Product Type - Market share 2025-2030 (%)
Data Table on Product Type - Market share 2025-2030 (%)

8.2 Comparison by Product Type

Chart on Comparison by Product Type
Data Table on Comparison by Product Type

8.3 Universal tamping machines - Market size and forecast 2025-2030

Chart on Universal tamping machines - Market size and forecast 2025-2030 ($ million)
Data Table on Universal tamping machines - Market size and forecast 2025-2030 ($ million)
Chart on Universal tamping machines - Year-over-year growth 2025-2030 (%)
Data Table on Universal tamping machines - Year-over-year growth 2025-2030 (%)

8.4 Plain track tamping machines - Market size and forecast 2025-2030

Chart on Plain track tamping machines - Market size and forecast 2025-2030 ($ million)
Data Table on Plain track tamping machines - Market size and forecast 2025-2030 ($ million)
Chart on Plain track tamping machines - Year-over-year growth 2025-2030 (%)
Data Table on Plain track tamping machines - Year-over-year growth 2025-2030 (%)

8.5 Points and crossings tamping machines - Market size and forecast 2025-2030

Chart on Points and crossings tamping machines - Market size and forecast 2025-2030 ($ million)
Data Table on Points and crossings tamping machines - Market size and forecast 2025-2030 ($ million)
Chart on Points and crossings tamping machines - Year-over-year growth 2025-2030 (%)
Data Table on Points and crossings tamping machines - Year-over-year growth 2025-2030 (%)

8.6 Market opportunity by Product Type

Market opportunity by Product Type ($ million)
Data Table on Market opportunity by Product Type ($ million)

9. Market Segmentation by Application

9.1 Market segments

Chart on Application - Market share 2025-2030 (%)
Data Table on Application - Market share 2025-2030 (%)

9.2 Comparison by Application

Chart on Comparison by Application
Data Table on Comparison by Application

9.3 Track maintenance and renewal - Market size and forecast 2025-2030

Chart on Track maintenance and renewal - Market size and forecast 2025-2030 ($ million)
Data Table on Track maintenance and renewal - Market size and forecast 2025-2030 ($ million)
Chart on Track maintenance and renewal - Year-over-year growth 2025-2030 (%)
Data Table on Track maintenance and renewal - Year-over-year growth 2025-2030 (%)

9.4 New track construction - Market size and forecast 2025-2030

Chart on New track construction - Market size and forecast 2025-2030 ($ million)
Data Table on New track construction - Market size and forecast 2025-2030 ($ million)
Chart on New track construction - Year-over-year growth 2025-2030 (%)
Data Table on New track construction - Year-over-year growth 2025-2030 (%)

9.5 Market opportunity by Application

Market opportunity by Application ($ million)
Data Table on Market opportunity by Application ($ million)

10. Market Segmentation by Type

10.1 Market segments

Chart on Type - Market share 2025-2030 (%)
Data Table on Type - Market share 2025-2030 (%)

10.2 Comparison by Type

Chart on Comparison by Type
Data Table on Comparison by Type

10.3 Single sleeper tamping machines - Market size and forecast 2025-2030

Chart on Single sleeper tamping machines - Market size and forecast 2025-2030 ($ million)
Data Table on Single sleeper tamping machines - Market size and forecast 2025-2030 ($ million)
Chart on Single sleeper tamping machines - Year-over-year growth 2025-2030 (%)
Data Table on Single sleeper tamping machines - Year-over-year growth 2025-2030 (%)

10.4 Multi sleeper tamping machines - Market size and forecast 2025-2030

Chart on Multi sleeper tamping machines - Market size and forecast 2025-2030 ($ million)
Data Table on Multi sleeper tamping machines - Market size and forecast 2025-2030 ($ million)
Chart on Multi sleeper tamping machines - Year-over-year growth 2025-2030 (%)
Data Table on Multi sleeper tamping machines - Year-over-year growth 2025-2030 (%)

10.5 Market opportunity by Type

Market opportunity by Type ($ million)
Data Table on Market opportunity by Type ($ million)

11. Customer Landscape

11.1 Customer landscape overview

Analysis of price sensitivity, lifecycle, customer purchase basket, adoption rates, and purchase criteria

12. Geographic Landscape

12.1 Geographic segmentation

Chart on Market share by geography 2025-2030 (%)
Data Table on Market share by geography 2025-2030 (%)

12.2 Geographic comparison

Chart on Geographic comparison
Data Table on Geographic comparison

12.3 APAC - Market size and forecast 2025-2030

Chart on APAC - Market size and forecast 2025-2030 ($ million)
Data Table on APAC - Market size and forecast 2025-2030 ($ million)
Chart on APAC - Year-over-year growth 2025-2030 (%)
Data Table on APAC - Year-over-year growth 2025-2030 (%)
Chart on Regional Comparison - APAC
Data Table on Regional Comparison - APAC

12.3.1 China - Market size and forecast 2025-2030

Chart on China - Market size and forecast 2025-2030 ($ million)
Data Table on China - Market size and forecast 2025-2030 ($ million)
Chart on China - Year-over-year growth 2025-2030 (%)
Data Table on China - Year-over-year growth 2025-2030 (%)

12.3.2 Japan - Market size and forecast 2025-2030

Chart on Japan - Market size and forecast 2025-2030 ($ million)
Data Table on Japan - Market size and forecast 2025-2030 ($ million)
Chart on Japan - Year-over-year growth 2025-2030 (%)
Data Table on Japan - Year-over-year growth 2025-2030 (%)

12.3.3 India - Market size and forecast 2025-2030

Chart on India - Market size and forecast 2025-2030 ($ million)
Data Table on India - Market size and forecast 2025-2030 ($ million)
Chart on India - Year-over-year growth 2025-2030 (%)
Data Table on India - Year-over-year growth 2025-2030 (%)

12.3.4 South Korea - Market size and forecast 2025-2030

Chart on South Korea - Market size and forecast 2025-2030 ($ million)
Data Table on South Korea - Market size and forecast 2025-2030 ($ million)
Chart on South Korea - Year-over-year growth 2025-2030 (%)
Data Table on South Korea - Year-over-year growth 2025-2030 (%)

12.3.5 Australia - Market size and forecast 2025-2030

Chart on Australia - Market size and forecast 2025-2030 ($ million)
Data Table on Australia - Market size and forecast 2025-2030 ($ million)
Chart on Australia - Year-over-year growth 2025-2030 (%)
Data Table on Australia - Year-over-year growth 2025-2030 (%)

12.3.6 Indonesia - Market size and forecast 2025-2030

Chart on Indonesia - Market size and forecast 2025-2030 ($ million)
Data Table on Indonesia - Market size and forecast 2025-2030 ($ million)
Chart on Indonesia - Year-over-year growth 2025-2030 (%)
Data Table on Indonesia - Year-over-year growth 2025-2030 (%)

12.4 Europe - Market size and forecast 2025-2030

Chart on Europe - Market size and forecast 2025-2030 ($ million)
Data Table on Europe - Market size and forecast 2025-2030 ($ million)
Chart on Europe - Year-over-year growth 2025-2030 (%)
Data Table on Europe - Year-over-year growth 2025-2030 (%)
Chart on Regional Comparison - Europe
Data Table on Regional Comparison - Europe

12.4.1 Germany - Market size and forecast 2025-2030

Chart on Germany - Market size and forecast 2025-2030 ($ million)
Data Table on Germany - Market size and forecast 2025-2030 ($ million)
Chart on Germany - Year-over-year growth 2025-2030 (%)
Data Table on Germany - Year-over-year growth 2025-2030 (%)

12.4.2 UK - Market size and forecast 2025-2030

Chart on UK - Market size and forecast 2025-2030 ($ million)
Data Table on UK - Market size and forecast 2025-2030 ($ million)
Chart on UK - Year-over-year growth 2025-2030 (%)
Data Table on UK - Year-over-year growth 2025-2030 (%)

12.4.3 France - Market size and forecast 2025-2030

Chart on France - Market size and forecast 2025-2030 ($ million)
Data Table on France - Market size and forecast 2025-2030 ($ million)
Chart on France - Year-over-year growth 2025-2030 (%)
Data Table on France - Year-over-year growth 2025-2030 (%)

12.4.4 Italy - Market size and forecast 2025-2030

Chart on Italy - Market size and forecast 2025-2030 ($ million)
Data Table on Italy - Market size and forecast 2025-2030 ($ million)
Chart on Italy - Year-over-year growth 2025-2030 (%)
Data Table on Italy - Year-over-year growth 2025-2030 (%)

12.4.5 Spain - Market size and forecast 2025-2030

Chart on Spain - Market size and forecast 2025-2030 ($ million)
Data Table on Spain - Market size and forecast 2025-2030 ($ million)
Chart on Spain - Year-over-year growth 2025-2030 (%)
Data Table on Spain - Year-over-year growth 2025-2030 (%)

12.4.6 The Netherlands - Market size and forecast 2025-2030

Chart on The Netherlands - Market size and forecast 2025-2030 ($ million)
Data Table on The Netherlands - Market size and forecast 2025-2030 ($ million)
Chart on The Netherlands - Year-over-year growth 2025-2030 (%)
Data Table on The Netherlands - Year-over-year growth 2025-2030 (%)

12.5 North America - Market size and forecast 2025-2030

Chart on North America - Market size and forecast 2025-2030 ($ million)
Data Table on North America - Market size and forecast 2025-2030 ($ million)
Chart on North America - Year-over-year growth 2025-2030 (%)
Data Table on North America - Year-over-year growth 2025-2030 (%)
Chart on Regional Comparison - North America
Data Table on Regional Comparison - North America

12.5.1 US - Market size and forecast 2025-2030

Chart on US - Market size and forecast 2025-2030 ($ million)
Data Table on US - Market size and forecast 2025-2030 ($ million)
Chart on US - Year-over-year growth 2025-2030 (%)
Data Table on US - Year-over-year growth 2025-2030 (%)

12.5.2 Canada - Market size and forecast 2025-2030

Chart on Canada - Market size and forecast 2025-2030 ($ million)
Data Table on Canada - Market size and forecast 2025-2030 ($ million)
Chart on Canada - Year-over-year growth 2025-2030 (%)
Data Table on Canada - Year-over-year growth 2025-2030 (%)

12.5.3 Mexico - Market size and forecast 2025-2030

Chart on Mexico - Market size and forecast 2025-2030 ($ million)
Data Table on Mexico - Market size and forecast 2025-2030 ($ million)
Chart on Mexico - Year-over-year growth 2025-2030 (%)
Data Table on Mexico - Year-over-year growth 2025-2030 (%)

12.6 South America - Market size and forecast 2025-2030

Chart on South America - Market size and forecast 2025-2030 ($ million)
Data Table on South America - Market size and forecast 2025-2030 ($ million)
Chart on South America - Year-over-year growth 2025-2030 (%)
Data Table on South America - Year-over-year growth 2025-2030 (%)
Chart on Regional Comparison - South America
Data Table on Regional Comparison - South America

12.6.1 Brazil - Market size and forecast 2025-2030

Chart on Brazil - Market size and forecast 2025-2030 ($ million)
Data Table on Brazil - Market size and forecast 2025-2030 ($ million)
Chart on Brazil - Year-over-year growth 2025-2030 (%)
Data Table on Brazil - Year-over-year growth 2025-2030 (%)

12.6.2 Argentina - Market size and forecast 2025-2030

Chart on Argentina - Market size and forecast 2025-2030 ($ million)
Data Table on Argentina - Market size and forecast 2025-2030 ($ million)
Chart on Argentina - Year-over-year growth 2025-2030 (%)
Data Table on Argentina - Year-over-year growth 2025-2030 (%)

12.6.3 Colombia - Market size and forecast 2025-2030

Chart on Colombia - Market size and forecast 2025-2030 ($ million)
Data Table on Colombia - Market size and forecast 2025-2030 ($ million)
Chart on Colombia - Year-over-year growth 2025-2030 (%)
Data Table on Colombia - Year-over-year growth 2025-2030 (%)

12.7 Middle East and Africa - Market size and forecast 2025-2030

Chart on Middle East and Africa - Market size and forecast 2025-2030 ($ million)
Data Table on Middle East and Africa - Market size and forecast 2025-2030 ($ million)
Chart on Middle East and Africa - Year-over-year growth 2025-2030 (%)
Data Table on Middle East and Africa - Year-over-year growth 2025-2030 (%)
Chart on Regional Comparison - Middle East and Africa
Data Table on Regional Comparison - Middle East and Africa

12.7.1 Saudi Arabia - Market size and forecast 2025-2030

Chart on Saudi Arabia - Market size and forecast 2025-2030 ($ million)
Data Table on Saudi Arabia - Market size and forecast 2025-2030 ($ million)
Chart on Saudi Arabia - Year-over-year growth 2025-2030 (%)
Data Table on Saudi Arabia - Year-over-year growth 2025-2030 (%)

12.7.2 South Africa - Market size and forecast 2025-2030

Chart on South Africa - Market size and forecast 2025-2030 ($ million)
Data Table on South Africa - Market size and forecast 2025-2030 ($ million)
Chart on South Africa - Year-over-year growth 2025-2030 (%)
Data Table on South Africa - Year-over-year growth 2025-2030 (%)

12.7.3 UAE - Market size and forecast 2025-2030

Chart on UAE - Market size and forecast 2025-2030 ($ million)
Data Table on UAE - Market size and forecast 2025-2030 ($ million)
Chart on UAE - Year-over-year growth 2025-2030 (%)
Data Table on UAE - Year-over-year growth 2025-2030 (%)

12.7.4 Turkey - Market size and forecast 2025-2030

Chart on Turkey - Market size and forecast 2025-2030 ($ million)
Data Table on Turkey - Market size and forecast 2025-2030 ($ million)
Chart on Turkey - Year-over-year growth 2025-2030 (%)
Data Table on Turkey - Year-over-year growth 2025-2030 (%)

12.7.5 Israel - Market size and forecast 2025-2030

Chart on Israel - Market size and forecast 2025-2030 ($ million)
Data Table on Israel - Market size and forecast 2025-2030 ($ million)
Chart on Israel - Year-over-year growth 2025-2030 (%)
Data Table on Israel - Year-over-year growth 2025-2030 (%)

12.8 Market opportunity by geography

Market opportunity by geography ($ million)
Data Tables on Market opportunity by geography ($ million)

13. Drivers, Challenges, and Opportunity

13.1 Market drivers

Accelerating high-speed rail infrastructure investments and network expansions
Transition toward fully automated and autonomous track maintenance technologies
Surging freight rail congestion and heavy axle load track modernization

13.2 Market challenges

Prohibitive initial capital expenditure and financial constraints for regional rail operators
Severe shortages of skilled technical personnel and specialized machine operators
Operational disruptions during track maintenance windows and complex urban access limitations

13.3 Impact of drivers and challenges

Impact of drivers and challenges in 2025 and 2030

13.4 Market opportunities

Adoption of electric and hybrid propulsion systems in tamping machinery
Integration of AI and data-driven predictive track inspection
Customization of compact and versatile tamping solutions for urban mass transit networks

14. Competitive Landscape

14.1 Overview

14.2

Overview on criticality of inputs and factors of differentiation

14.3 Landscape disruption

Overview on factors of disruption

14.4 Industry risks

Impact of key risks on business

15. Competitive Analysis

15.1 Companies profiled

Companies covered

15.2 Company ranking index

15.3 Market positioning of companies

Matrix on companies position and classification

15.4 Balfour Beatty Plc

Balfour Beatty Plc - Overview
Balfour Beatty Plc - Business segments
Balfour Beatty Plc - Key offerings
Balfour Beatty Plc - Segment focus
SWOT

15.5 CRRC Corp. Ltd.

CRRC Corp. Ltd. - Overview
CRRC Corp. Ltd. - Product / Service
CRRC Corp. Ltd. - Key offerings
SWOT

15.6 Geismar

Geismar - Overview
Geismar - Product / Service
Geismar - Key offerings
SWOT

15.7 Harsco Corp

Harsco Corp - Overview
Harsco Corp - Product / Service
Harsco Corp - Key offerings
SWOT

15.8 MATISA MATERIEL INDUSTRIEL

MATISA MATERIEL INDUSTRIEL - Overview
MATISA MATERIEL INDUSTRIEL - Product / Service
MATISA MATERIEL INDUSTRIEL - Key offerings
SWOT

15.9 Plasser and Theurer

Plasser and Theurer - Overview
Plasser and Theurer - Product / Service
Plasser and Theurer - Key offerings
SWOT

15.10 Progress Rail Corp

Progress Rail Corp - Overview
Progress Rail Corp - Product / Service
Progress Rail Corp - Key offerings
SWOT

15.11 ROBEL GmbH

ROBEL GmbH - Overview
ROBEL GmbH - Product / Service
ROBEL GmbH - Key offerings
SWOT

15.12 Sinara Group

Sinara Group - Overview
Sinara Group - Product / Service
Sinara Group - Key offerings
SWOT

15.13 Strukton Groep NV

Strukton Groep NV - Overview
Strukton Groep NV - Product / Service
Strukton Groep NV - Key offerings
SWOT

16. Appendix

16.1 Scope of the report

Market definition
Objectives
Notes and caveats

16.2 Inclusions and exclusions checklist

Inclusions checklist
Exclusions checklist

16.3 Currency conversion rates for US$

16.4 Research methodology

16.5 Data procurement

Information sources

16.6 Data validation

16.7 Validation techniques employed for market sizing

16.8 Data synthesis

16.9 360 degree market analysis

16.10 List of abbreviations

Research Methodology

Technavio presents a detailed picture of the market by way of study, synthesis, and summation of data from multiple sources. The analysts have presented the various facets of the market with a particular focus on identifying the key industry influencers. The data thus presented is comprehensive, reliable, and the result of extensive research, both primary and secondary.

INFORMATION SOURCES

Primary sources

  • Manufacturers and suppliers
  • Channel partners
  • Industry experts
  • Strategic decision makers

Secondary sources

  • Industry journals and periodicals
  • Government data
  • Financial reports of key industry players
  • Historical data
  • Press releases

DATA ANALYSIS

Data Synthesis

  • Collation of data
  • Estimation of key figures
  • Analysis of derived insights

Data Validation

  • Triangulation with data models
  • Reference against proprietary databases
  • Corroboration with industry experts

REPORT WRITING

Qualitative

  • Market drivers
  • Market challenges
  • Market trends
  • Five forces analysis

Quantitative

  • Market size and forecast
  • Market segmentation
  • Geographical insights
  • Competitive landscape

Interested in this report?

Get your sample now to see our research methodology and insights!

Download Now

Frequently Asked Questions

Tamping Machine market growth will increase by USD 485.5 million during 2026-2030.

The Tamping Machine market is expected to grow at a CAGR of 4.7% during 2026-2030.

Tamping Machine market is segmented by Product type (Universal tamping machines, Plain track tamping machines, Points and crossings tamping machines) Application (Track maintenance and renewal, New track construction) Type (Single sleeper tamping machines, Multi sleeper tamping machines)

Balfour Beatty Plc, CRRC Corp. Ltd., Geismar, Harsco Corp, MATISA MATERIEL INDUSTRIEL, Plasser and Theurer, Progress Rail Corp, ROBEL GmbH, Sinara Group, Strukton Groep NV are a few of the key vendors in the Tamping Machine market.

APAC will register the highest growth rate of 46.9% among the other regions. Therefore, the Tamping Machine market in APAC is expected to garner significant business opportunities for the vendors during the forecast period.

China, Japan, India, South Korea, Australia, Indonesia, Germany, UK, France, Italy, Spain, The Netherlands, US, Canada, Mexico, Brazil, Argentina, Colombia, Saudi Arabia, South Africa, UAE, Turkey, Israel

  • Accelerating high-speed rail infrastructure investments and network expansions is the driving factor this market.

The Tamping Machine market vendors should focus on grabbing business opportunities from the Product type segment as it accounted for the largest market share in the base year.
RIA - Research AI Assistant
Ask RIA
