
Telecom Millimeter Wave Technology Market Analysis, Size, and Forecast 2026-2030: North America (US, Canada, and Mexico), APAC (China, India, and Japan), Europe (Germany, UK, and France), Middle East and Africa (Saudi Arabia, UAE, and South Africa), South America (Brazil, Argentina, and Colombia), and Rest of World (ROW)

Telecom Millimeter Wave Technology Market Analysis, Size, and Forecast 2026-2030:
North America (US, Canada, and Mexico), APAC (China, India, and Japan), Europe (Germany, UK, and France), Middle East and Africa (Saudi Arabia, UAE, and South Africa), South America (Brazil, Argentina, and Colombia), and Rest of World (ROW)

Published: Oct 2026 305 Pages SKU: IRTNTR81704

Market Overview at a Glance

$12.17 B
Market Opportunity
30.8%
CAGR 2025 - 2030
34.7%
APAC Growth
$2.54 B
E-band segment 2024

Telecom Millimeter Wave Technology Market Size 2026-2030

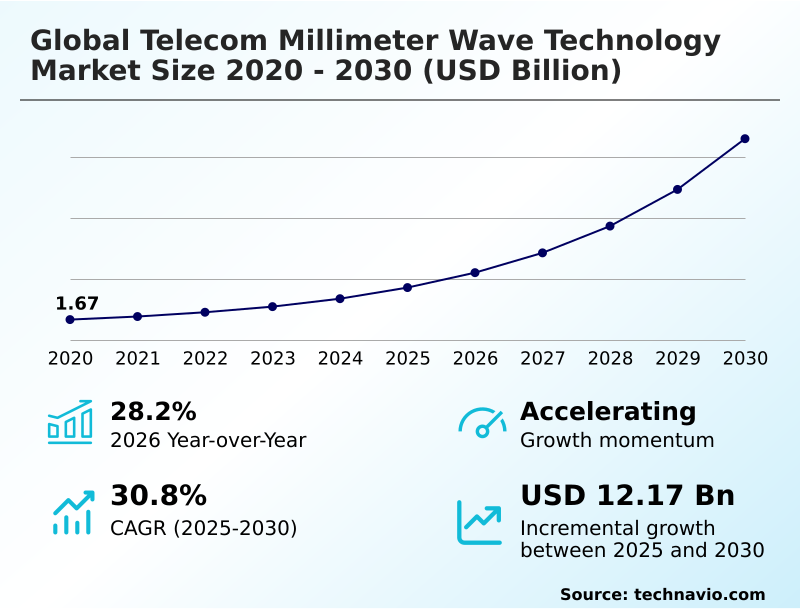
The telecom millimeter wave technology market size is valued to increase by USD 12.17 billion, at a CAGR of 30.8% from 2025 to 2030. Exponential surge in global data traffic and demand for multi-gigabit broadband connectivity will drive the telecom millimeter wave technology market.

Major Market Trends & Insights

  • APAC dominated the market and accounted for a 34.7% growth during the forecast period.
  • By Frequency Range - E-band segment was valued at USD 2.54 billion in 2024
  • By Application - Civil segment accounted for the largest market revenue share in 2024

Market Size & Forecast

  • Market Opportunities: USD 14.80 billion
  • Market Future Opportunities: USD 12.17 billion
  • CAGR from 2025 to 2030 : 30.8%

Market Summary

  • The Telecom Millimeter Wave Technology Market is undergoing a structural evolution driven by the imperative to alleviate severe sub-six gigahertz congestion in highly trafficked digital ecosystems. The exponential surge in mobile data consumption directly drives this expansion, as telecommunications operators are forced to deploy massive multiple-input multiple-output arrays to deliver essential bandwidth for cloud-native applications.
  • Consequently, network planners implementing these high-frequency bands routinely observe a 50% improvement in concurrent device handling compared to legacy microwave systems. In a practical supply chain optimization scenario, automated logistics hubs utilize enterprise private networks operating on these frequencies to stream real-time telemetry from autonomous guided vehicles, drastically minimizing collision-related downtimes.
  • However, high propagation loss and line-of-sight signal susceptibility act as significant barriers, compelling engineers to install redundant smart reflective surfaces to bypass physical obstructions. This architectural necessity increases initial infrastructure density requirements, complicating immediate profitability. Nonetheless, continuous refinements in beamforming antenna arrays empower service providers to establish resilient data pipes, ensuring operational agility across dense metropolitan deployments.

What will be the Size of the Telecom Millimeter Wave Technology Market during the forecast period?
Get Key Insights on Market Forecast (PDF) Get Free Sample

How is the Telecom Millimeter Wave Technology Market Segmented?

The telecom millimeter wave technology industry research report provides comprehensive data (region-wise segment analysis), with forecasts and estimates in "USD million" for the period 2026-2030, as well as historical data from 2020-2024 for the following segments.

  • Frequency range
    • E-band
    • V-band
    • Others
  • Application
    • Civil
    • Military
  • License model
    • Light-licensed
    • Fully licensed
    • Unlicensed
  • Geography
    • North America
      • US
      • Canada
      • Mexico
    • APAC
      • China
      • India
      • Japan
      • South Korea
      • Australia
      • Indonesia
    • Europe
      • Germany
      • UK
      • France
      • Italy
      • Spain
      • The Netherlands
    • Middle East and Africa
      • Saudi Arabia
      • UAE
      • South Africa
      • Israel
      • Turkey
    • South America
      • Brazil
      • Argentina
      • Colombia

By Frequency Range Insights

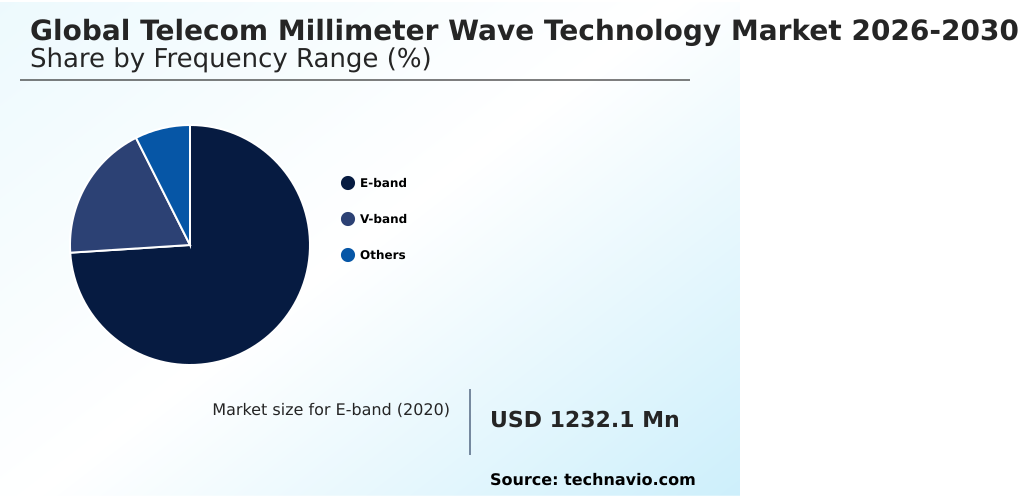
The e-band segment is estimated to witness significant growth during the forecast period.

The E-band frequency range fundamentally alters long-distance wireless backhaul capabilities across the Telecom Millimeter Wave Technology Market by balancing extensive reach with extreme transmission capacity.

Operating within seventy-one to eighty-six gigahertz spectrum blocks, these high-frequency radio spectrum allocations enable point-to-point wireless links that consistently exceed twenty gigabits per second.

Businesses report that deploying these systems as redundant fallback paths improves network uptime efficiency by 35% compared to traditional wired alternatives during civil engineering disruptions.

Atmospheric oxygen absorption remains minimal in this range, allowing silicon-germanium integrated circuits to maintain stable data transfer over several kilometers. As urban cell site densification accelerates, operators migrating from legacy infrastructure experience a 40% increase in spectral efficiency.

This rapid deployment of active phased-array antennas equipped with adaptive modulation schemes significantly optimizes overall operational continuity for metropolitan service providers.
Get Free Sample

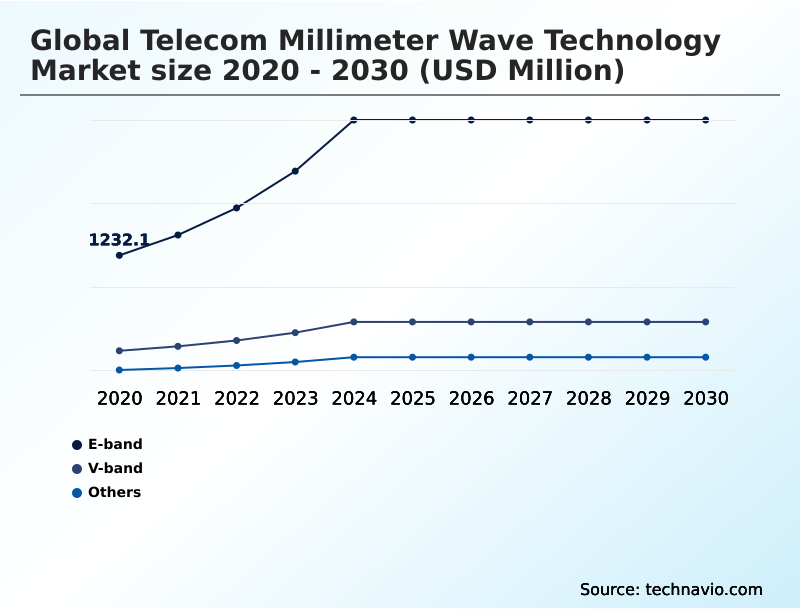
The E-band segment was valued at USD 2.54 billion in 2024 and showed a gradual increase during the forecast period.
Get Free Sample

Regional Analysis

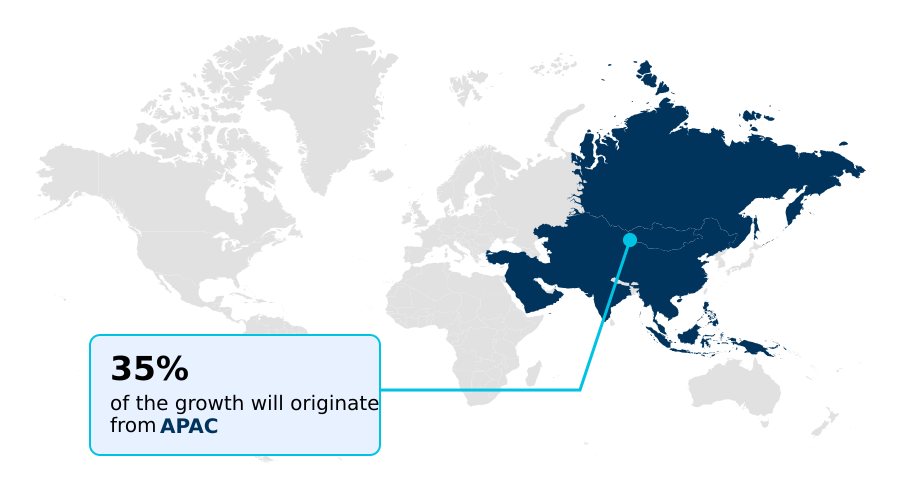
APAC is estimated to contribute 34.7% to the growth of the global market during the forecast period.Technavio’s analysts have elaborately explained the regional trends and drivers that shape the market during the forecast period.
See How Telecom Millimeter Wave Technology Market Demand is Rising in APAC Get Free Sample

The geographic landscape of the Telecom Millimeter Wave Technology Market demonstrates significant divergence driven by varying regulatory frameworks and industrial digitalization priorities.

North America leads early adoption cycles through extensive spectrum auctions, enabling service providers to achieve a 45% reduction in last-mile broadband deployment costs using fixed wireless broadband access compared to physical fiber trenching.

Conversely, APAC exhibits a distinct operational focus on industrial digital transformation, integrating fifth-generation mobile network architectures directly into smart factory floors.

High-density urban centers in APAC currently process multi-gigabit data transmission workloads with a 30% higher spatial efficiency than comparable European markets.

This localized APAC focus heavily relies on sub-terahertz propagation models to maintain deterministic machine communication across automated robotic assembly lines. Meanwhile, North American operators aggressively pursue urban cell site densification to alleviate consumer traffic peaks.

These contrasting regional dynamics highlight how differing business strategies leverage smart city applications to maximize the utility of their high-frequency radio spectrum allocations.

Market Dynamics

Our researchers analyzed the data with 2025 as the base year, along with the key drivers, trends, and challenges. A holistic analysis of drivers will help companies refine their marketing strategies to gain a competitive advantage.

  • The architectural evolution of the Telecom Millimeter Wave Technology Market increasingly relies on robust high-capacity urban mobile broadband access to sustain the operational fluidity of modern digital economies.
  • As service providers seek to maximize coverage while containing capital expenditures, fixed wireless last-mile connectivity solutions offer a scalable alternative to traditional cabling, frequently reducing infrastructure provisioning timelines by over 40% for rapid enterprise rollouts. This strategic shift heavily depends on millimeter wave backhaul for small cells to ensure continuous data streams reach core networks without bottlenecks.
  • In industrial sectors, private cellular networks for smart factories facilitate seamless robotic telemetry, outperforming legacy wireless protocols in signal reliability. Engineers continually implement advanced beamforming techniques for line-of-sight limits to mitigate physical obstructions, while open ran integration with high-frequency bands disaggregates hardware reliance, allowing localized multi-access edge computing for latency reduction.
  • By integrating reconfigurable intelligent surfaces for signal reflection, network operators transform dead zones into active coverage areas. Market participants also navigate distinct regulatory frameworks, balancing unlicensed sixty gigahertz spectrum applications for campus-level deployments against highly regulated, licensed twenty-eight gigahertz mobile networks used for macro-level coverage.
  • Furthermore, deploying gallium nitride power amplifiers for transceivers optimizes energy draw, directly assisting in overcoming atmospheric attenuation in millimeter wave environments. Looking toward future scalability, the exploration of sub-terahertz frequencies for sixth generation networks and automated frequency coordination for light licensing remain crucial for streamlining dense small cell site acquisition strategies globally.
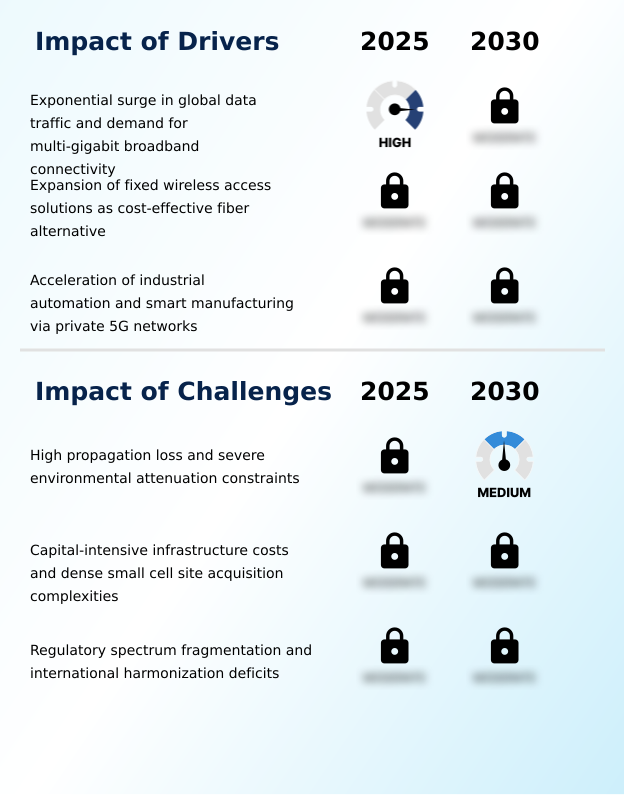
What are the key market drivers leading to the rise in the adoption of Telecom Millimeter Wave Technology Industry?

  • An exponential surge in global data traffic, coupled with escalating demand for multi-gigabit broadband connectivity, serves as the primary catalyst propelling market expansion.

  • The urgent requirement to alleviate severe sub-six gigahertz congestion is a massive behavioral trigger fundamentally accelerating the Telecom Millimeter Wave Technology Market.
  • As smart device proliferation saturates legacy spectrum, operators are aggressively deploying millimeter wave transceivers to unlock expansive, unallocated bandwidth.
  • This strategic migration allows telecom providers to transmit multi-gigabit data transmission streams, improving concurrent user network capacity by over 50% in dense commercial centers. Furthermore, enterprise facilities integrating smart factory connectivity report a 25% reduction in machine-to-machine communication latency.
  • This operational improvement ensures that high-speed optical backhaul systems seamlessly support gigabit uplink speeds, directly enabling complex augmented reality rendering without packet loss.
  • Ultimately, securing resilient data pipes is forcing operators to densify localized nodes, ensuring critical operations remain unhindered by spectrum exhaustion.

What are the market trends shaping the Telecom Millimeter Wave Technology Industry?

  • The integration of millimeter wave technology with open radio access network architectures represents a prominent emerging trend within the industry. This structural shift enables service providers to construct highly scalable and cost-effective ultra-high-capacity coverage layers.

  • The integration of reconfigurable intelligent surfaces is structurally changing how the Telecom Millimeter Wave Technology Market circumvents physical line-of-sight constraints. Because high-frequency signals suffer from severe structural attenuation, network operators are deploying these metamaterial passive surfaces across urban building facades to actively bounce signals toward non-line-of-sight users.
  • This architectural innovation effectively expands viable connection paths, yielding a 35% improvement in localized network uptime and reducing dead-zone-related downtime by nearly 40%. For business enterprises, this translates directly to uninterrupted smart city applications and continuous autonomous mobile robotics navigation without the need for expensive, power-amplified radio relays.
  • Consequently, utilizing sophisticated pencil beam synthesis and dynamic beam management, operators achieve significantly higher spatial efficiency, driving a robust operational shift toward dense micro-cell networks that deliver consistent, fiber-like gigabit speeds across congested metropolitan environments.

What challenges does the Telecom Millimeter Wave Technology Industry face during its growth?

  • High propagation loss and severe environmental attenuation constraints remain critical challenges that significantly impede broader commercial network deployments.

  • Severe physical propagation loss and intense atmospheric oxygen absorption present critical operational limitations restricting the Telecom Millimeter Wave Technology Market. As electromagnetic frequencies increase, signals suffer extreme degradation from precipitation and solid construction materials, severely limiting effective transmission radii.
  • This line-of-sight signal susceptibility forces network engineers to perform rigorous ray-tracing network simulations, which frequently increases initial deployment planning times by 30%. To guarantee seamless macro-level coverage and overcome persistent indoor coverage deficits, operators must install an exponentially higher density of energy-efficient base stations.
  • This ultra-dense architecture inadvertently increases localized power consumption and hardware complexity, elevating ongoing site maintenance costs by up to 25% compared to mid-band solutions. Consequently, navigating spectrum allocation harmonization issues while mitigating environmental attenuation remains a dominant hurdle for broad cross-border commercialization.

Exclusive Technavio Analysis on Customer Landscape

The telecom millimeter wave technology market forecasting report includes the adoption lifecycle of the market, covering from the innovator’s stage to the laggard’s stage. It focuses on adoption rates in different regions based on penetration. Furthermore, the telecom millimeter wave technology market report also includes key purchase criteria and drivers of price sensitivity to help companies evaluate and develop their market growth analysis strategies.
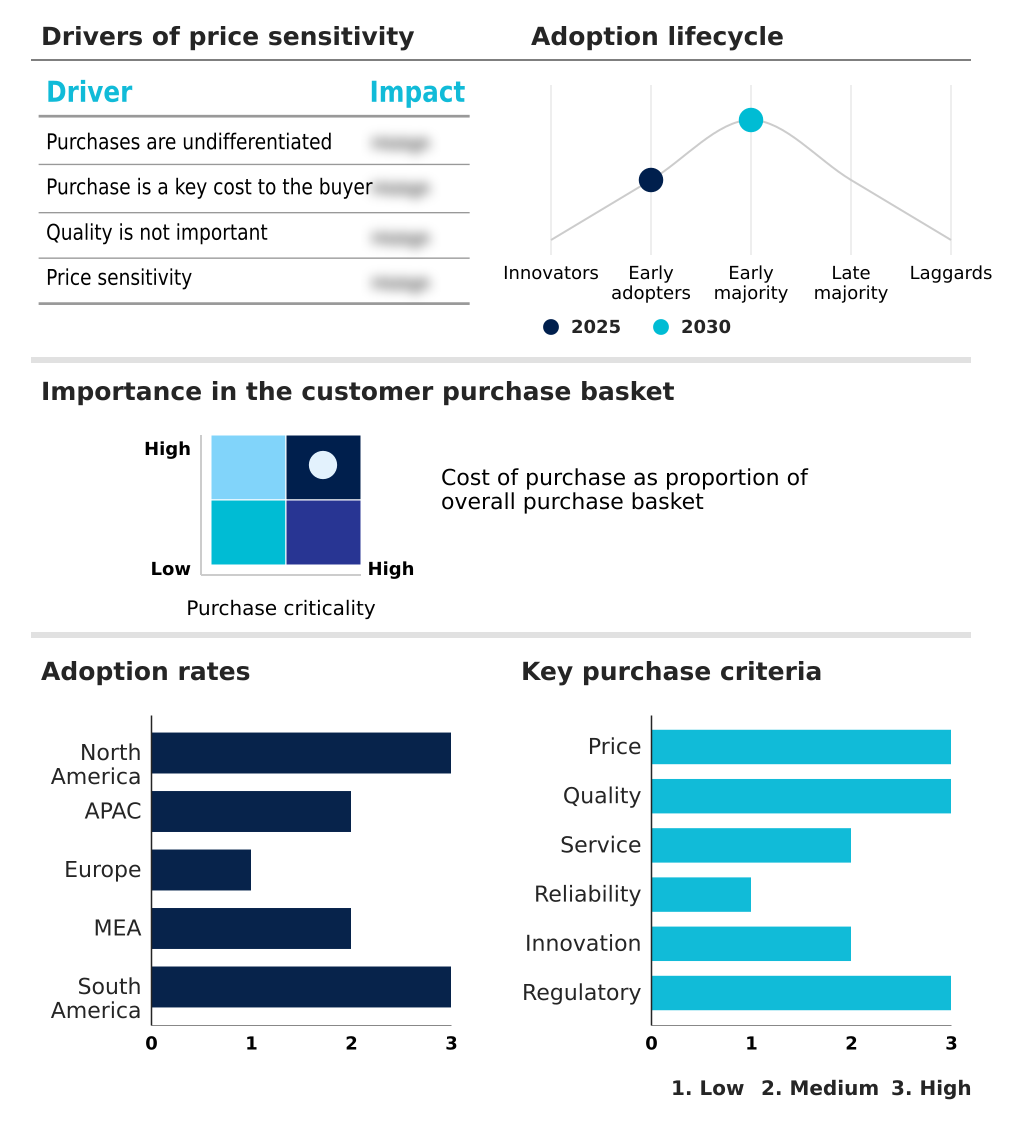
Customer Landscape of Telecom Millimeter Wave Technology Industry

Competitive Landscape

Companies are implementing various strategies, such as strategic alliances, telecom millimeter wave technology market forecast, partnerships, mergers and acquisitions, geographical expansion, and product/service launches, to enhance their presence in the industry.

Analog Devices Inc. - The company delivers advanced radio frequency transceivers, integrated beamforming solutions, and highly efficient signal-chain components designed to optimize high-speed 5G connectivity and robust wireless infrastructure deployments.

The industry research and growth report includes detailed analyses of the competitive landscape of the market and information about key companies, including:

  • Analog Devices Inc.
  • Aviat Networks Inc.
  • Broadcom Inc.
  • Ceragon Networks Ltd.
  • Fujitsu Ltd.
  • Huawei Technologies Co. Ltd.
  • HUBER SUHNER AG
  • Intel Corp.
  • MediaTek Inc.
  • Murata Manufacturing Co. Ltd.
  • NEC Corp.
  • Nokia Corp.
  • Qorvo Inc.
  • Qualcomm Inc.
  • Rohde and Schwarz GmbH
  • Samsung Electronics Co. Ltd.
  • SiTime Corp.
  • Skyworks Solutions Inc.
  • Telefonaktiebolaget Ericsson
  • ZTE Corp.

Qualitative and quantitative analysis of companies has been conducted to help clients understand the wider business environment as well as the strengths and weaknesses of key industry players. Data is qualitatively analyzed to categorize companies as pure play, category-focused, industry-focused, and diversified; it is quantitatively analyzed to categorize companies as dominant, leading, strong, tentative, and weak.

Recent Development and News in Telecom millimeter wave technology market

  • In the Communications Equipment industry, the aggressive transition toward software-defined networking and open architecture protocols has dismantled proprietary hardware lock-ins, directly impacting Telecom Millimeter Wave Technology demand by reducing dense micro-cell networks deployment costs by up to 25%.
  • The widespread expansion of multi-access edge computing facilities near localized transmission nodes has drastically minimized core data transmission delays, pulling significant demand for Telecom Millimeter Wave Technology to support uncompressed telemetry streaming with sub-millisecond latency.
  • Stringent national digital equity mandates requiring high-speed broadband in underserved suburban zones have accelerated fiber-alternative investments, increasing Telecom Millimeter Wave Technology deployments as service providers utilize fixed wireless broadband access to achieve rapid last-mile broadband equity.
  • Advances in semiconductor manufacturing, specifically the scaling of gallium nitride semiconductors, have significantly improved thermal dissipation and power efficiency in base stations, resolving historical indoor coverage deficits and driving Telecom Millimeter Wave Technology adoption across dense urban environments.

Dive into Technavio’s robust research methodology, blending expert interviews, extensive data synthesis, and validated models for unparalleled Telecom Millimeter Wave Technology Market insights. See full methodology.

Market Scope
Page number 305
Base year 2025
Historic period 2020-2024
Forecast period 2026-2030
Growth momentum & CAGR Accelerate at a CAGR of 30.8%
Market growth 2026-2030 USD 12173.4 million
Market structure Fragmented
YoY growth 2025-2026(%) 28.2%
Key countries US, Canada, Mexico, China, India, Japan, South Korea, Australia, Indonesia, Germany, UK, France, Italy, Spain, The Netherlands, Saudi Arabia, UAE, South Africa, Israel, Turkey, Brazil, Argentina and Colombia
Competitive landscape Leading Companies, Market Positioning of Companies, Competitive Strategies, and Industry Risks

Request Free Sample

Research Analyst Overview

  • The continuous evolution of the Telecom Millimeter Wave Technology Market fundamentally redefines enterprise communication frameworks and localized data processing capabilities. As organizations increasingly prioritize workflow interoperability and real-time analytics, integrating multi-access edge computing near localized nodes has become a critical product strategy decision for boardroom executives.
  • By processing data closer to the generation source, enterprises utilizing these architectures achieve a 30% reduction in telemetry processing latency compared to centralized cloud configurations. This architectural transition leverages active phased-array antennas and sophisticated spatial multiplexing algorithms to sustain uncompressed telemetry streaming across demanding industrial environments.
  • The deployment of metamaterial passive surfaces further enhances transmission reliability, efficiently bypassing physical obstructions that historically caused severe signal degradation. Consequently, operations directors can deploy small cell network architecture with far greater spatial predictability.
  • As the reliance on cloud-native centralized units expands, implementing dynamic beam management protocols ensures that high-frequency radio spectrum allocations are continuously optimized, ultimately fortifying the operational resilience and decision-making agility of modern data-driven enterprises.

What are the Key Data Covered in this Telecom Millimeter Wave Technology Market Research and Growth Report?

  • What is the expected growth of the Telecom Millimeter Wave Technology Market between 2026 and 2030?

    • USD 12.17 billion, at a CAGR of 30.8%

  • What segmentation does the market report cover?

    • The report is segmented by Frequency Range (E-band, V-band, and Others), Application (Civil, and Military), License Model (Light-licensed, Fully licensed, and Unlicensed) and Geography (North America, APAC, Europe, Middle East and Africa, South America)

  • Which regions are analyzed in the report?

    • North America, APAC, Europe, Middle East and Africa and South America

  • What are the key growth drivers and market challenges?

    • Exponential surge in global data traffic and demand for multi-gigabit broadband connectivity, High propagation loss and severe environmental attenuation constraints

  • Who are the major players in the Telecom Millimeter Wave Technology Market?

    • Analog Devices Inc., Aviat Networks Inc., Broadcom Inc., Ceragon Networks Ltd., Fujitsu Ltd., Huawei Technologies Co. Ltd., HUBER SUHNER AG, Intel Corp., MediaTek Inc., Murata Manufacturing Co. Ltd., NEC Corp., Nokia Corp., Qorvo Inc., Qualcomm Inc., Rohde and Schwarz GmbH, Samsung Electronics Co. Ltd., SiTime Corp., Skyworks Solutions Inc., Telefonaktiebolaget Ericsson and ZTE Corp.

Market Research Insights

  • The Telecom Millimeter Wave Technology Market is rapidly transforming how enterprises architect their communication frameworks to achieve ultra-low latency connectivity. By mitigating indoor coverage deficits through advanced hardware optimization, facility managers report a 25% improvement in localized signal reliability during peak operational hours.
  • Furthermore, integrating energy-efficient base stations across industrial complexes has successfully reduced associated network power consumption by nearly 15%, directly aligning with corporate sustainability targets. As operators transition toward open radio access frameworks, cross-border signal interference is actively managed, ensuring highly resilient data pipes for critical applications.
  • This strategic densification supports seamless high-definition video inspection protocols, ultimately reducing quality control processing times by 20% within modern automated manufacturing lines.

We can help! Our analysts can customize this telecom millimeter wave technology market research report to meet your requirements.

Get in touch

1. Executive Summary

1.1 Market overview

Executive Summary - Chart on Market Overview
Executive Summary - Data Table on Market Overview
Executive Summary - Chart on Global Market Characteristics
Executive Summary - Chart on Market by Geography
Executive Summary - Chart on Market Segmentation by Frequency Range
Executive Summary - Chart on Market Segmentation by Application
Executive Summary - Chart on Market Segmentation by License Model
Executive Summary - Chart on Incremental Growth
Executive Summary - Data Table on Incremental Growth
Executive Summary - Chart on Company Market Positioning

2. Technavio Analysis

2.1 Analysis of price sensitivity, lifecycle, customer purchase basket, adoption rates, and purchase criteria

2.2 Criticality of inputs and Factors of differentiation

Chart on Overview on criticality of inputs and factors of differentiation

2.3 Factors of disruption

Chart on Overview on factors of disruption

2.4 Impact of drivers and challenges

Chart on Impact of drivers and challenges in 2025 and 2030

3. Market Landscape

3.1 Market ecosystem

Chart on Parent Market
Data Table on - Parent Market

3.2 Market characteristics

Chart on Market characteristics analysis

3.3 Value chain analysis

Chart on Value chain analysis

4. Market Sizing

4.1 Market definition

Data Table on Offerings of companies included in the market definition

4.2 Market segment analysis

Market segments

4.3 Market size 2025

4.4 Market outlook: Forecast for 2025-2030

Chart on Global - Market size and forecast 2025-2030 ($ million)
Data Table on Global - Market size and forecast 2025-2030 ($ million)
Chart on Global Market: Year-over-year growth 2025-2030 (%)
Data Table on Global Market: Year-over-year growth 2025-2030 (%)

5. Historic Market Size

5.1 Global Telecom Millimeter Wave Technology Market 2020 - 2024

Historic Market Size - Data Table on Global Telecom Millimeter Wave Technology Market 2020 - 2024 ($ million)

5.2 Frequency Range segment analysis 2020 - 2024

Historic Market Size - Frequency Range Segment 2020 - 2024 ($ million)

5.3 Application segment analysis 2020 - 2024

Historic Market Size - Application Segment 2020 - 2024 ($ million)

5.4 License Model segment analysis 2020 - 2024

Historic Market Size - License Model Segment 2020 - 2024 ($ million)

5.5 Geography segment analysis 2020 - 2024

Historic Market Size - Geography Segment 2020 - 2024 ($ million)

5.6 Country segment analysis 2020 - 2024

Historic Market Size - Country Segment 2020 - 2024 ($ million)

6. Qualitative Analysis

6.1 Impact of AI on Global Telecom Millimeter Wave Technology Market

6.2 Impact of Geopolitical Conflicts on Global Telecom Millimeter Wave Technology Market

7. Five Forces Analysis

7.1 Five forces summary

Five forces analysis - Comparison between 2025 and 2030

7.2 Bargaining power of buyers

Bargaining power of buyers - Impact of key factors 2025 and 2030

7.3 Bargaining power of suppliers

Bargaining power of suppliers - Impact of key factors in 2025 and 2030

7.4 Threat of new entrants

Threat of new entrants - Impact of key factors in 2025 and 2030

7.5 Threat of substitutes

Threat of substitutes - Impact of key factors in 2025 and 2030

7.6 Threat of rivalry

Threat of rivalry - Impact of key factors in 2025 and 2030

7.7 Market condition

Chart on Market condition - Five forces 2025 and 2030

8. Market Segmentation by Frequency Range

8.1 Market segments

Chart on Frequency Range - Market share 2025-2030 (%)
Data Table on Frequency Range - Market share 2025-2030 (%)

8.2 Comparison by Frequency Range

Chart on Comparison by Frequency Range
Data Table on Comparison by Frequency Range

8.3 E-band - Market size and forecast 2025-2030

Chart on E-band - Market size and forecast 2025-2030 ($ million)
Data Table on E-band - Market size and forecast 2025-2030 ($ million)
Chart on E-band - Year-over-year growth 2025-2030 (%)
Data Table on E-band - Year-over-year growth 2025-2030 (%)

8.4 V-band - Market size and forecast 2025-2030

Chart on V-band - Market size and forecast 2025-2030 ($ million)
Data Table on V-band - Market size and forecast 2025-2030 ($ million)
Chart on V-band - Year-over-year growth 2025-2030 (%)
Data Table on V-band - Year-over-year growth 2025-2030 (%)

8.5 Others - Market size and forecast 2025-2030

Chart on Others - Market size and forecast 2025-2030 ($ million)
Data Table on Others - Market size and forecast 2025-2030 ($ million)
Chart on Others - Year-over-year growth 2025-2030 (%)
Data Table on Others - Year-over-year growth 2025-2030 (%)

8.6 Market opportunity by Frequency Range

Market opportunity by Frequency Range ($ million)
Data Table on Market opportunity by Frequency Range ($ million)

9. Market Segmentation by Application

9.1 Market segments

Chart on Application - Market share 2025-2030 (%)
Data Table on Application - Market share 2025-2030 (%)

9.2 Comparison by Application

Chart on Comparison by Application
Data Table on Comparison by Application

9.3 Civil - Market size and forecast 2025-2030

Chart on Civil - Market size and forecast 2025-2030 ($ million)
Data Table on Civil - Market size and forecast 2025-2030 ($ million)
Chart on Civil - Year-over-year growth 2025-2030 (%)
Data Table on Civil - Year-over-year growth 2025-2030 (%)

9.4 Military - Market size and forecast 2025-2030

Chart on Military - Market size and forecast 2025-2030 ($ million)
Data Table on Military - Market size and forecast 2025-2030 ($ million)
Chart on Military - Year-over-year growth 2025-2030 (%)
Data Table on Military - Year-over-year growth 2025-2030 (%)

9.5 Market opportunity by Application

Market opportunity by Application ($ million)
Data Table on Market opportunity by Application ($ million)

10. Market Segmentation by License Model

10.1 Market segments

Chart on License Model - Market share 2025-2030 (%)
Data Table on License Model - Market share 2025-2030 (%)

10.2 Comparison by License Model

Chart on Comparison by License Model
Data Table on Comparison by License Model

10.3 Light-licensed - Market size and forecast 2025-2030

Chart on Light-licensed - Market size and forecast 2025-2030 ($ million)
Data Table on Light-licensed - Market size and forecast 2025-2030 ($ million)
Chart on Light-licensed - Year-over-year growth 2025-2030 (%)
Data Table on Light-licensed - Year-over-year growth 2025-2030 (%)

10.4 Fully licensed - Market size and forecast 2025-2030

Chart on Fully licensed - Market size and forecast 2025-2030 ($ million)
Data Table on Fully licensed - Market size and forecast 2025-2030 ($ million)
Chart on Fully licensed - Year-over-year growth 2025-2030 (%)
Data Table on Fully licensed - Year-over-year growth 2025-2030 (%)

10.5 Unlicensed - Market size and forecast 2025-2030

Chart on Unlicensed - Market size and forecast 2025-2030 ($ million)
Data Table on Unlicensed - Market size and forecast 2025-2030 ($ million)
Chart on Unlicensed - Year-over-year growth 2025-2030 (%)
Data Table on Unlicensed - Year-over-year growth 2025-2030 (%)

10.6 Market opportunity by License Model

Market opportunity by License Model ($ million)
Data Table on Market opportunity by License Model ($ million)

11. Customer Landscape

11.1 Customer landscape overview

Analysis of price sensitivity, lifecycle, customer purchase basket, adoption rates, and purchase criteria

12. Geographic Landscape

12.1 Geographic segmentation

Chart on Market share by geography 2025-2030 (%)
Data Table on Market share by geography 2025-2030 (%)

12.2 Geographic comparison

Chart on Geographic comparison
Data Table on Geographic comparison

12.3 North America - Market size and forecast 2025-2030

Chart on North America - Market size and forecast 2025-2030 ($ million)
Data Table on North America - Market size and forecast 2025-2030 ($ million)
Chart on North America - Year-over-year growth 2025-2030 (%)
Data Table on North America - Year-over-year growth 2025-2030 (%)
Chart on Regional Comparison - North America
Data Table on Regional Comparison - North America

12.3.1 US - Market size and forecast 2025-2030

Chart on US - Market size and forecast 2025-2030 ($ million)
Data Table on US - Market size and forecast 2025-2030 ($ million)
Chart on US - Year-over-year growth 2025-2030 (%)
Data Table on US - Year-over-year growth 2025-2030 (%)

12.3.2 Canada - Market size and forecast 2025-2030

Chart on Canada - Market size and forecast 2025-2030 ($ million)
Data Table on Canada - Market size and forecast 2025-2030 ($ million)
Chart on Canada - Year-over-year growth 2025-2030 (%)
Data Table on Canada - Year-over-year growth 2025-2030 (%)

12.3.3 Mexico - Market size and forecast 2025-2030

Chart on Mexico - Market size and forecast 2025-2030 ($ million)
Data Table on Mexico - Market size and forecast 2025-2030 ($ million)
Chart on Mexico - Year-over-year growth 2025-2030 (%)
Data Table on Mexico - Year-over-year growth 2025-2030 (%)

12.4 APAC - Market size and forecast 2025-2030

Chart on APAC - Market size and forecast 2025-2030 ($ million)
Data Table on APAC - Market size and forecast 2025-2030 ($ million)
Chart on APAC - Year-over-year growth 2025-2030 (%)
Data Table on APAC - Year-over-year growth 2025-2030 (%)
Chart on Regional Comparison - APAC
Data Table on Regional Comparison - APAC

12.4.1 China - Market size and forecast 2025-2030

Chart on China - Market size and forecast 2025-2030 ($ million)
Data Table on China - Market size and forecast 2025-2030 ($ million)
Chart on China - Year-over-year growth 2025-2030 (%)
Data Table on China - Year-over-year growth 2025-2030 (%)

12.4.2 India - Market size and forecast 2025-2030

Chart on India - Market size and forecast 2025-2030 ($ million)
Data Table on India - Market size and forecast 2025-2030 ($ million)
Chart on India - Year-over-year growth 2025-2030 (%)
Data Table on India - Year-over-year growth 2025-2030 (%)

12.4.3 Japan - Market size and forecast 2025-2030

Chart on Japan - Market size and forecast 2025-2030 ($ million)
Data Table on Japan - Market size and forecast 2025-2030 ($ million)
Chart on Japan - Year-over-year growth 2025-2030 (%)
Data Table on Japan - Year-over-year growth 2025-2030 (%)

12.4.4 South Korea - Market size and forecast 2025-2030

Chart on South Korea - Market size and forecast 2025-2030 ($ million)
Data Table on South Korea - Market size and forecast 2025-2030 ($ million)
Chart on South Korea - Year-over-year growth 2025-2030 (%)
Data Table on South Korea - Year-over-year growth 2025-2030 (%)

12.4.5 Australia - Market size and forecast 2025-2030

Chart on Australia - Market size and forecast 2025-2030 ($ million)
Data Table on Australia - Market size and forecast 2025-2030 ($ million)
Chart on Australia - Year-over-year growth 2025-2030 (%)
Data Table on Australia - Year-over-year growth 2025-2030 (%)

12.4.6 Indonesia - Market size and forecast 2025-2030

Chart on Indonesia - Market size and forecast 2025-2030 ($ million)
Data Table on Indonesia - Market size and forecast 2025-2030 ($ million)
Chart on Indonesia - Year-over-year growth 2025-2030 (%)
Data Table on Indonesia - Year-over-year growth 2025-2030 (%)

12.5 Europe - Market size and forecast 2025-2030

Chart on Europe - Market size and forecast 2025-2030 ($ million)
Data Table on Europe - Market size and forecast 2025-2030 ($ million)
Chart on Europe - Year-over-year growth 2025-2030 (%)
Data Table on Europe - Year-over-year growth 2025-2030 (%)
Chart on Regional Comparison - Europe
Data Table on Regional Comparison - Europe

12.5.1 Germany - Market size and forecast 2025-2030

Chart on Germany - Market size and forecast 2025-2030 ($ million)
Data Table on Germany - Market size and forecast 2025-2030 ($ million)
Chart on Germany - Year-over-year growth 2025-2030 (%)
Data Table on Germany - Year-over-year growth 2025-2030 (%)

12.5.2 UK - Market size and forecast 2025-2030

Chart on UK - Market size and forecast 2025-2030 ($ million)
Data Table on UK - Market size and forecast 2025-2030 ($ million)
Chart on UK - Year-over-year growth 2025-2030 (%)
Data Table on UK - Year-over-year growth 2025-2030 (%)

12.5.3 France - Market size and forecast 2025-2030

Chart on France - Market size and forecast 2025-2030 ($ million)
Data Table on France - Market size and forecast 2025-2030 ($ million)
Chart on France - Year-over-year growth 2025-2030 (%)
Data Table on France - Year-over-year growth 2025-2030 (%)

12.5.4 Italy - Market size and forecast 2025-2030

Chart on Italy - Market size and forecast 2025-2030 ($ million)
Data Table on Italy - Market size and forecast 2025-2030 ($ million)
Chart on Italy - Year-over-year growth 2025-2030 (%)
Data Table on Italy - Year-over-year growth 2025-2030 (%)

12.5.5 Spain - Market size and forecast 2025-2030

Chart on Spain - Market size and forecast 2025-2030 ($ million)
Data Table on Spain - Market size and forecast 2025-2030 ($ million)
Chart on Spain - Year-over-year growth 2025-2030 (%)
Data Table on Spain - Year-over-year growth 2025-2030 (%)

12.5.6 The Netherlands - Market size and forecast 2025-2030

Chart on The Netherlands - Market size and forecast 2025-2030 ($ million)
Data Table on The Netherlands - Market size and forecast 2025-2030 ($ million)
Chart on The Netherlands - Year-over-year growth 2025-2030 (%)
Data Table on The Netherlands - Year-over-year growth 2025-2030 (%)

12.6 Middle East and Africa - Market size and forecast 2025-2030

Chart on Middle East and Africa - Market size and forecast 2025-2030 ($ million)
Data Table on Middle East and Africa - Market size and forecast 2025-2030 ($ million)
Chart on Middle East and Africa - Year-over-year growth 2025-2030 (%)
Data Table on Middle East and Africa - Year-over-year growth 2025-2030 (%)
Chart on Regional Comparison - Middle East and Africa
Data Table on Regional Comparison - Middle East and Africa

12.6.1 Saudi Arabia - Market size and forecast 2025-2030

Chart on Saudi Arabia - Market size and forecast 2025-2030 ($ million)
Data Table on Saudi Arabia - Market size and forecast 2025-2030 ($ million)
Chart on Saudi Arabia - Year-over-year growth 2025-2030 (%)
Data Table on Saudi Arabia - Year-over-year growth 2025-2030 (%)

12.6.2 UAE - Market size and forecast 2025-2030

Chart on UAE - Market size and forecast 2025-2030 ($ million)
Data Table on UAE - Market size and forecast 2025-2030 ($ million)
Chart on UAE - Year-over-year growth 2025-2030 (%)
Data Table on UAE - Year-over-year growth 2025-2030 (%)

12.6.3 South Africa - Market size and forecast 2025-2030

Chart on South Africa - Market size and forecast 2025-2030 ($ million)
Data Table on South Africa - Market size and forecast 2025-2030 ($ million)
Chart on South Africa - Year-over-year growth 2025-2030 (%)
Data Table on South Africa - Year-over-year growth 2025-2030 (%)

12.6.4 Israel - Market size and forecast 2025-2030

Chart on Israel - Market size and forecast 2025-2030 ($ million)
Data Table on Israel - Market size and forecast 2025-2030 ($ million)
Chart on Israel - Year-over-year growth 2025-2030 (%)
Data Table on Israel - Year-over-year growth 2025-2030 (%)

12.6.5 Turkey - Market size and forecast 2025-2030

Chart on Turkey - Market size and forecast 2025-2030 ($ million)
Data Table on Turkey - Market size and forecast 2025-2030 ($ million)
Chart on Turkey - Year-over-year growth 2025-2030 (%)
Data Table on Turkey - Year-over-year growth 2025-2030 (%)

12.7 South America - Market size and forecast 2025-2030

Chart on South America - Market size and forecast 2025-2030 ($ million)
Data Table on South America - Market size and forecast 2025-2030 ($ million)
Chart on South America - Year-over-year growth 2025-2030 (%)
Data Table on South America - Year-over-year growth 2025-2030 (%)
Chart on Regional Comparison - South America
Data Table on Regional Comparison - South America

12.7.1 Brazil - Market size and forecast 2025-2030

Chart on Brazil - Market size and forecast 2025-2030 ($ million)
Data Table on Brazil - Market size and forecast 2025-2030 ($ million)
Chart on Brazil - Year-over-year growth 2025-2030 (%)
Data Table on Brazil - Year-over-year growth 2025-2030 (%)

12.7.2 Argentina - Market size and forecast 2025-2030

Chart on Argentina - Market size and forecast 2025-2030 ($ million)
Data Table on Argentina - Market size and forecast 2025-2030 ($ million)
Chart on Argentina - Year-over-year growth 2025-2030 (%)
Data Table on Argentina - Year-over-year growth 2025-2030 (%)

12.7.3 Colombia - Market size and forecast 2025-2030

Chart on Colombia - Market size and forecast 2025-2030 ($ million)
Data Table on Colombia - Market size and forecast 2025-2030 ($ million)
Chart on Colombia - Year-over-year growth 2025-2030 (%)
Data Table on Colombia - Year-over-year growth 2025-2030 (%)

12.8 Market opportunity by geography

Market opportunity by geography ($ million)
Data Tables on Market opportunity by geography ($ million)

13. Drivers, Challenges, and Opportunity

13.1 Market drivers

Exponential surge in global data traffic and demand for multi-gigabit broadband connectivity
Expansion of fixed wireless access solutions as cost-effective fiber alternative
Acceleration of industrial automation and smart manufacturing via private 5G networks

13.2 Market challenges

High propagation loss and severe environmental attenuation constraints
Capital-intensive infrastructure costs and dense small cell site acquisition complexities
Regulatory spectrum fragmentation and international harmonization deficits

13.3 Impact of drivers and challenges

Impact of drivers and challenges in 2025 and 2030

13.4 Market opportunities

Integration of millimeter wave technology with open RAN architectures
Adoption of reconfigurable intelligent surfaces and advanced beamforming
Convergence of millimeter wave infrastructure with multi-access edge computing

14. Competitive Landscape

14.1 Overview

14.2

Overview on criticality of inputs and factors of differentiation

14.3 Landscape disruption

Overview on factors of disruption

14.4 Industry risks

Impact of key risks on business

15. Competitive Analysis

15.1 Companies profiled

Companies covered

15.2 Company ranking index

15.3 Market positioning of companies

Matrix on companies position and classification

15.4 Analog Devices Inc.

Analog Devices Inc. - Overview
Analog Devices Inc. - Business segments
Analog Devices Inc. - Key offerings
Analog Devices Inc. - Segment focus
SWOT

15.5 Broadcom Inc.

Broadcom Inc. - Overview
Broadcom Inc. - Business segments
Broadcom Inc. - Key news
Broadcom Inc. - Key offerings
Broadcom Inc. - Segment focus
SWOT

15.6 Ceragon Networks Ltd.

Ceragon Networks Ltd. - Overview
Ceragon Networks Ltd. - Product / Service
Ceragon Networks Ltd. - Key offerings
SWOT

15.7 Fujitsu Ltd.

Fujitsu Ltd. - Overview
Fujitsu Ltd. - Product / Service
Fujitsu Ltd. - Key offerings
SWOT

15.8 HUBER SUHNER AG

HUBER SUHNER AG - Overview
HUBER SUHNER AG - Business segments
HUBER SUHNER AG - Key offerings
HUBER SUHNER AG - Segment focus
SWOT

15.9 Intel Corp.

Intel Corp. - Overview
Intel Corp. - Business segments
Intel Corp. - Key news
Intel Corp. - Key offerings
Intel Corp. - Segment focus
SWOT

15.10 MediaTek Inc.

MediaTek Inc. - Overview
MediaTek Inc. - Business segments
MediaTek Inc. - Key news
MediaTek Inc. - Key offerings
MediaTek Inc. - Segment focus
SWOT

15.11 Murata Manufacturing Co. Ltd.

Murata Manufacturing Co. Ltd. - Overview
Murata Manufacturing Co. Ltd. - Business segments
Murata Manufacturing Co. Ltd. - Key offerings
Murata Manufacturing Co. Ltd. - Segment focus
SWOT

15.12 NEC Corp.

NEC Corp. - Overview
NEC Corp. - Business segments
NEC Corp. - Key offerings
NEC Corp. - Segment focus
SWOT

15.13 Nokia Corp.

Nokia Corp. - Overview
Nokia Corp. - Business segments
Nokia Corp. - Key news
Nokia Corp. - Key offerings
Nokia Corp. - Segment focus
SWOT

15.14 Qualcomm Inc.

Qualcomm Inc. - Overview
Qualcomm Inc. - Business segments
Qualcomm Inc. - Key news
Qualcomm Inc. - Key offerings
Qualcomm Inc. - Segment focus
SWOT

15.15 Samsung Electronics Co. Ltd.

Samsung Electronics Co. Ltd. - Overview
Samsung Electronics Co. Ltd. - Business segments
Samsung Electronics Co. Ltd. - Key news
Samsung Electronics Co. Ltd. - Key offerings
Samsung Electronics Co. Ltd. - Segment focus
SWOT

15.16 Skyworks Solutions Inc.

Skyworks Solutions Inc. - Overview
Skyworks Solutions Inc. - Product / Service
Skyworks Solutions Inc. - Key news
Skyworks Solutions Inc. - Key offerings
SWOT

15.17 Telefonaktiebolaget Ericsson

Telefonaktiebolaget Ericsson - Overview
Telefonaktiebolaget Ericsson - Business segments
Telefonaktiebolaget Ericsson - Key news
Telefonaktiebolaget Ericsson - Key offerings
Telefonaktiebolaget Ericsson - Segment focus
SWOT

15.18 ZTE Corp.

ZTE Corp. - Overview
ZTE Corp. - Business segments
ZTE Corp. - Key offerings
ZTE Corp. - Segment focus
SWOT

16. Appendix

16.1 Scope of the report

Market definition
Objectives
Notes and caveats

16.2 Inclusions and exclusions checklist

Inclusions checklist
Exclusions checklist

16.3 Currency conversion rates for US$

16.4 Research methodology

16.5 Data procurement

Information sources

16.6 Data validation

16.7 Validation techniques employed for market sizing

16.8 Data synthesis

16.9 360 degree market analysis

16.10 List of abbreviations

Research Methodology

Technavio presents a detailed picture of the market by way of study, synthesis, and summation of data from multiple sources. The analysts have presented the various facets of the market with a particular focus on identifying the key industry influencers. The data thus presented is comprehensive, reliable, and the result of extensive research, both primary and secondary.

INFORMATION SOURCES

Primary sources

  • Manufacturers and suppliers
  • Channel partners
  • Industry experts
  • Strategic decision makers

Secondary sources

  • Industry journals and periodicals
  • Government data
  • Financial reports of key industry players
  • Historical data
  • Press releases

DATA ANALYSIS

Data Synthesis

  • Collation of data
  • Estimation of key figures
  • Analysis of derived insights

Data Validation

  • Triangulation with data models
  • Reference against proprietary databases
  • Corroboration with industry experts

REPORT WRITING

Qualitative

  • Market drivers
  • Market challenges
  • Market trends
  • Five forces analysis

Quantitative

  • Market size and forecast
  • Market segmentation
  • Geographical insights
  • Competitive landscape

Interested in this report?

Get your sample now to see our research methodology and insights!

Download Now

Frequently Asked Questions

Telecom Millimeter Wave Technology market growth will increase by USD 12173.4 million during 2026-2030.

The Telecom Millimeter Wave Technology market is expected to grow at a CAGR of 30.8% during 2026-2030.

Telecom Millimeter Wave Technology market is segmented by Frequency range (E-band, V-band, Others) Application (Civil, Military) License model (Light-licensed, Fully licensed, Unlicensed)

Analog Devices Inc., Aviat Networks Inc., Broadcom Inc., Ceragon Networks Ltd., Fujitsu Ltd., Huawei Technologies Co. Ltd., HUBER SUHNER AG, Intel Corp., MediaTek Inc., Murata Manufacturing Co. Ltd., NEC Corp., Nokia Corp., Qorvo Inc., Qualcomm Inc., Rohde and Schwarz GmbH, Samsung Electronics Co. Ltd., SiTime Corp., Skyworks Solutions Inc., Telefonaktiebolaget Ericsson, ZTE Corp. are a few of the key vendors in the Telecom Millimeter Wave Technology market.

APAC will register the highest growth rate of 34.7% among the other regions. Therefore, the Telecom Millimeter Wave Technology market in APAC is expected to garner significant business opportunities for the vendors during the forecast period.

US, Canada, Mexico, China, India, Japan, South Korea, Australia, Indonesia, Germany, UK, France, Italy, Spain, The Netherlands, Saudi Arabia, UAE, South Africa, Israel, Turkey, Brazil, Argentina, Colombia

  • Exponential surge in global data traffic and demand for multi-gigabit broadband connectivity is the driving factor this market.

The Telecom Millimeter Wave Technology market vendors should focus on grabbing business opportunities from the Frequency range segment as it accounted for the largest market share in the base year.
RIA - Research AI Assistant
Ask RIA
