Three Phase Distribution Transformer Market Analysis, Size, and Forecast 2026-2030: APAC (China, India, and Japan), North America (US, Canada, and Mexico), Europe (Germany, France, and UK), Middle East and Africa (Saudi Arabia, UAE, and South Africa), South America (Brazil, Argentina, and Chile), and Rest of World (ROW)

Three Phase Distribution Transformer Market Analysis, Size, and Forecast 2026-2030:
APAC (China, India, and Japan), North America (US, Canada, and Mexico), Europe (Germany, France, and UK), Middle East and Africa (Saudi Arabia, UAE, and South Africa), South America (Brazil, Argentina, and Chile), and Rest of World (ROW)

Published: Oct 2026 310 Pages SKU: IRTNTR81635

Market Overview at a Glance

$5.92 B
Market Opportunity
7.3%
CAGR 2025 - 2030
48.3%
APAC Growth
$9.40 B
Oil-immersed segment 2024

Three Phase Distribution Transformer Market Size 2026-2030

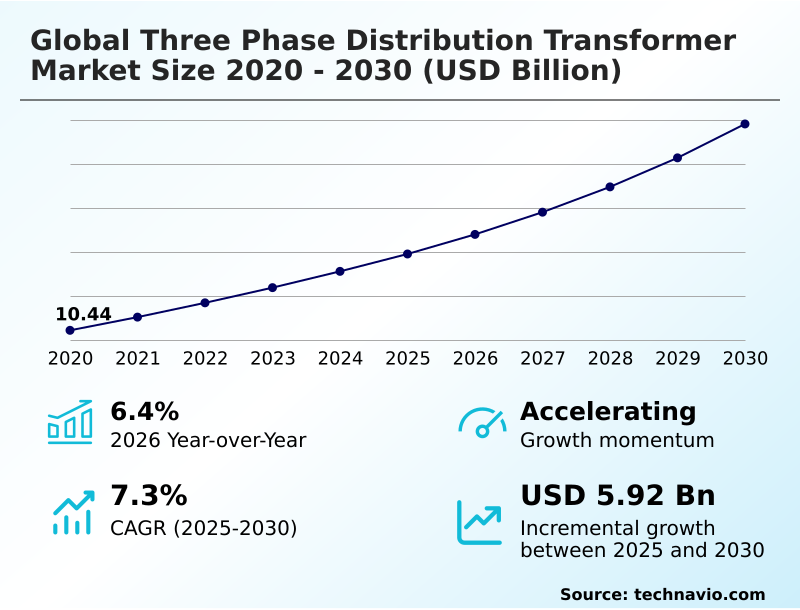
The three phase distribution transformer market size is valued to increase by USD 5.92 billion, at a CAGR of 7.3% from 2025 to 2030. Acceleration of renewable energy integration and grid decarbonization will drive the three phase distribution transformer market.

Major Market Trends & Insights

  • APAC dominated the market and accounted for a 48.3% growth during the forecast period.
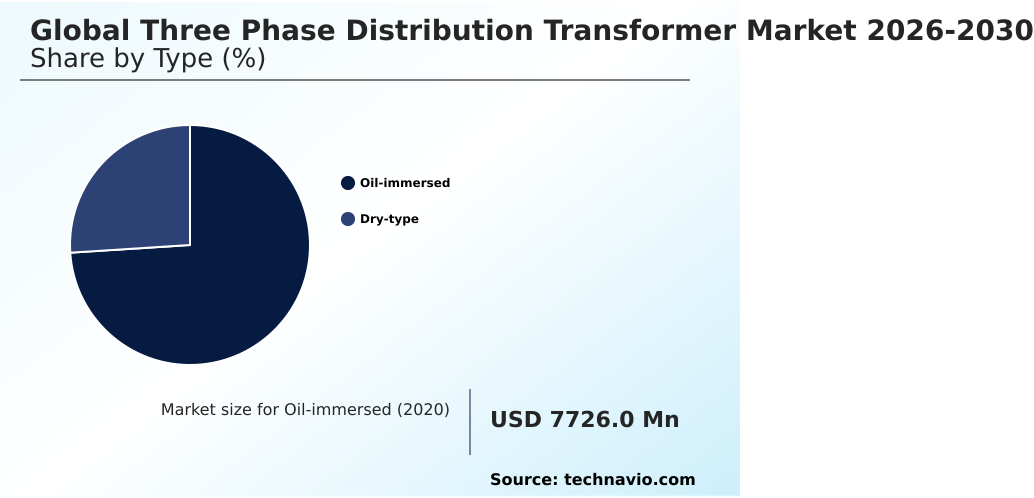
  • By Type - Oil-immersed segment was valued at USD 9.40 billion in 2024
  • By Power Rating - More than 500 KVA to 1000 KVA segment accounted for the largest market revenue share in 2024

Market Size & Forecast

  • Market Opportunities: USD 9.38 billion
  • Market Future Opportunities: USD 5.92 billion
  • CAGR from 2025 to 2030 : 7.3%

Market Summary

  • The Three Phase Distribution Transformer market demonstrates robust structural expansion driven by urgent electrification mandates and widespread grid modernization efforts. In a notable supply chain optimization scenario, municipal utility providers transitioning to smart grid integration have overhauled procurement protocols to prioritize units featuring dissolved gas analysis and remote diagnostic capabilities.
  • This strategic shift has enabled network operators to improve predictive maintenance efficiency by 22% compared to legacy reactive servicing models. The primary driver of this market remains the rapid deployment of decentralized power networks and localized energy storage, requiring advanced hardware to manage complex bidirectional power flows seamlessly.
  • Conversely, manufacturers face persistent challenges stemming from the fluctuating cost of grain oriented electrical steel and copper, which compress operational margins and complicate long-term infrastructure planning. Despite these material constraints, the continued push toward renewable energy substation development necessitates resilient distribution components, solidifying the critical role of these transformers in maintaining high-grade power quality and uninterrupted urban grid densification.

What will be the Size of the Three Phase Distribution Transformer Market during the forecast period?
Get Key Insights on Market Forecast (PDF) Get Free Sample

How is the Three Phase Distribution Transformer Market Segmented?

The three phase distribution transformer industry research report provides comprehensive data (region-wise segment analysis), with forecasts and estimates in "USD million" for the period 2026-2030, as well as historical data from 2020-2024 for the following segments.

  • Type
    • Oil-immersed
    • Dry-type
  • Power rating
    • More than 500 KVA to 1000 KVA
    • More than 1000 KVA to 2000 KVA
    • Below 500 KVA
    • Above 2000 KVA
  • Application
    • Utilities
    • Industrial
    • Commercial
    • Residential
  • Geography
    • APAC
      • China
      • India
      • Japan
      • South Korea
      • Australia
      • Indonesia
    • North America
      • US
      • Canada
      • Mexico
    • Europe
      • Germany
      • France
      • UK
      • Italy
      • Spain
      • The Netherlands
    • Middle East and Africa
      • Saudi Arabia
      • UAE
      • South Africa
      • Turkey
      • Israel
    • South America
      • Brazil
      • Argentina
      • Chile

By Type Insights

The oil-immersed segment is estimated to witness significant growth during the forecast period.

The oil-immersed segment defines the operational backbone of the Three Phase Distribution Transformer landscape, engineered to provide superior cooling capacity and reliable long-term performance under demanding conditions.

These units utilize advanced mineral oil replacement strategies, incorporating ester fluid insulation to effectively transfer heat generated by electromagnetic induction away from the laminated magnetic core.

This liquid cooling mechanism enables the equipment to endure heavy load surges while maintaining precise voltage regulation across diverse network architectures.

Implementing these advanced systems has allowed utility operators to enhance extreme weather hardening efforts, resulting in a 15% reduction in weather-related failure rates.

Furthermore, the adoption of sustainable dielectric fluids mitigates flammability risks, empowering grid managers to deploy high-capacity units safely within densely populated urban grids while significantly lowering environmental compliance costs.
Get Free Sample

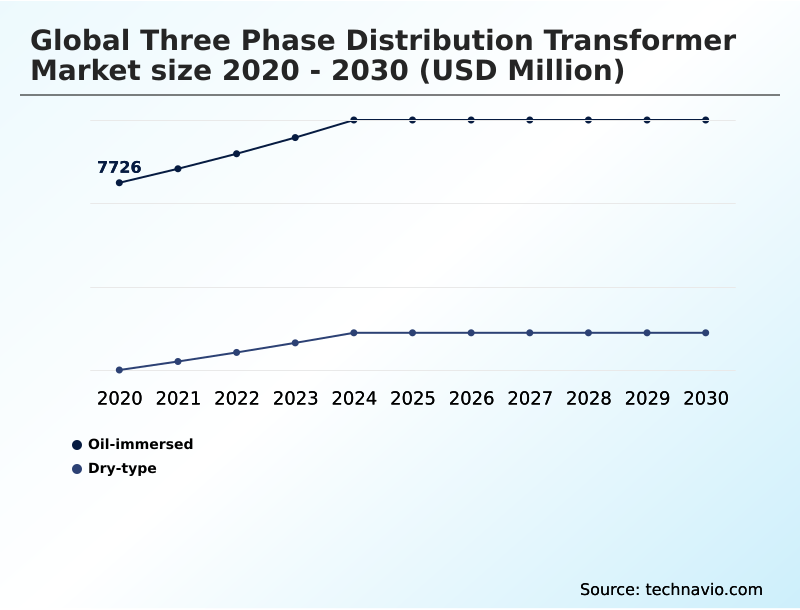
The Oil-immersed segment was valued at USD 9.40 billion in 2024 and showed a gradual increase during the forecast period.
Get Free Sample

Regional Analysis

APAC is estimated to contribute 48.3% to the growth of the global market during the forecast period.Technavio’s analysts have elaborately explained the regional trends and drivers that shape the market during the forecast period.
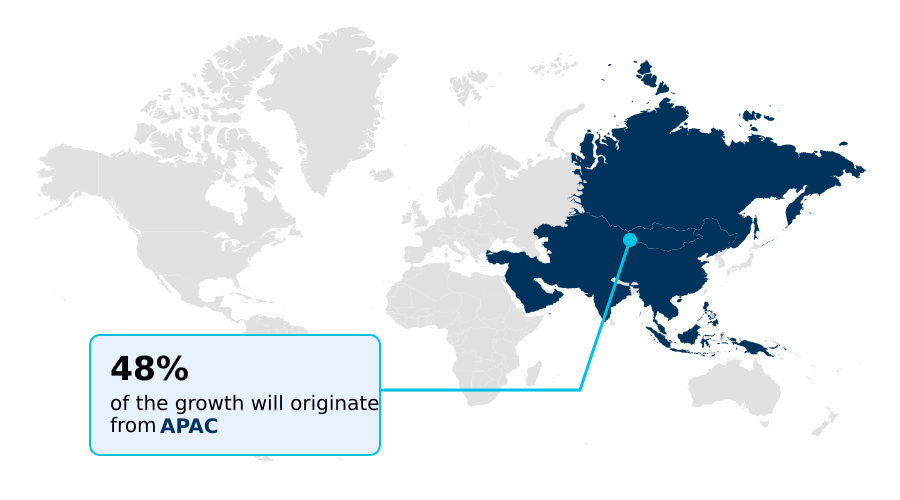
See How Three Phase Distribution Transformer Market Demand is Rising in APAC Get Free Sample

The regional dynamics of the Three Phase Distribution Transformer highlight distinct approaches to network modernization. Asia Pacific leads infrastructure expansion, driven by rapid urban grid densification and massive utility scale solar deployments.

Network operators in this region have accelerated the installation of units featuring advanced dry type construction, achieving a 35% higher adoption rate of smart monitoring sensors compared to legacy systems.

Conversely, North America focuses on extreme weather hardening and replacing aging medium voltage distribution assets.

This strategic divergence has led North American utilities to increase investments in condition based asset management by 20%, prioritizing predictive maintenance diagnostics to mitigate outage risks.

While Asia Pacific concentrates on expanding raw capacity through extensive pole mounted installation networks, North American operators emphasize digital twin simulation to optimize existing grid loads.

These contrasting strategies reflect how different regions balance immediate capacity requirements against long-term resilience and operational efficiency optimization.

Market Dynamics

Our researchers analyzed the data with 2025 as the base year, along with the key drivers, trends, and challenges. A holistic analysis of drivers will help companies refine their marketing strategies to gain a competitive advantage.

  • The strategic deployment of the Three Phase Distribution Transformer is undergoing a fundamental transformation as utilities prioritize resilience, environmental safety, and digital integration. As decentralized renewable energy generation scales up, the necessity for advanced bidirectional power flow management becomes critical to prevent grid instability during peak production hours.
  • Utilities are actively leveraging smart grid digital twin simulation to model these complex energy inputs, allowing them to optimize load distribution and reduce system stress before physical deployment. To address stringent environmental regulations, particularly in ecologically sensitive or densely populated urban areas, there is a pronounced shift toward the utilization of biodegradable synthetic ester fluid insulation.
  • This material transition not only mitigates fire risks but also improves thermal handling capabilities. Furthermore, the proliferation of electric vehicle fast-charging infrastructure introduces severe electrical noise to the grid, mandating high frequency harmonic distortion mitigation to protect sensitive downstream equipment from premature degradation.
  • To further maximize operational efficiency and align with net-zero carbon targets, manufacturers are heavily focusing on amorphous steel magnetic core efficiency, which drastically minimizes standby energy losses.
  • In a comparative operational analysis, facilities upgrading to these advanced core materials and predictive digital frameworks achieve a nearly 40% reduction in long-term maintenance expenditures compared to those relying on traditional silicon steel and reactive service models, fundamentally reshaping supply chain forecasting and capital asset planning.
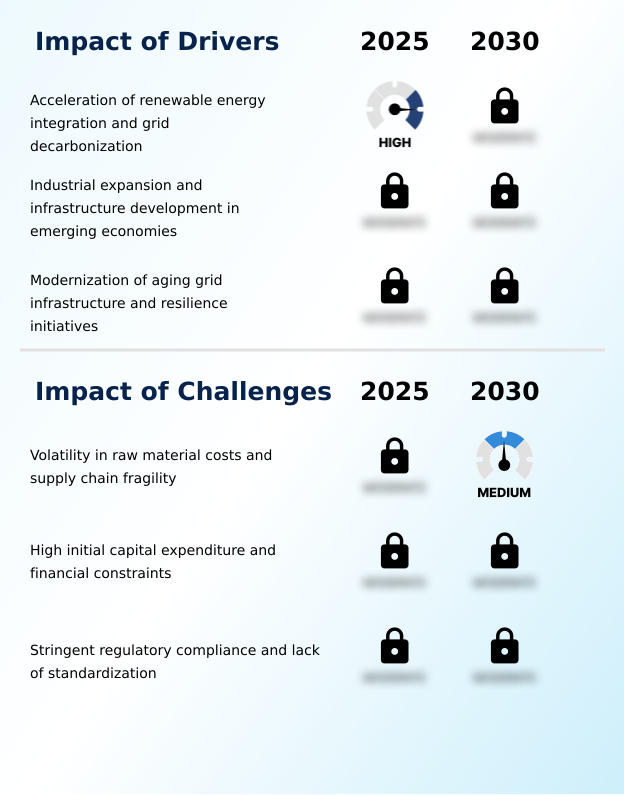
What are the key market drivers leading to the rise in the adoption of Three Phase Distribution Transformer Industry?

  • The acceleration of renewable energy integration and grid decarbonization serves as the primary catalyst propelling market expansion.

  • Surging investments in data center step down infrastructure and the rapid expansion of the electric vehicle charging hub network are aggressively driving demand for the Three Phase Distribution Transformer.
  • This behavioral shift stems from the critical need for ultra-reliable power delivery capable of withstanding continuous, intensive loads. To accommodate these extreme demands, modern units feature advanced cast resin encapsulation and vacuum pressure impregnation, vastly improving thermal endurance.
  • By upgrading to these heavy-duty configurations, industrial operators have reduced heat-related system degradation by 28%. Additionally, the implementation of these high-efficiency architectures has improved overall base load energy conversion by 15%.
  • This modernization significantly lowers lifecycle maintenance expenses and ensures maximum uptime for mission-critical digital and transportation networks.

What are the market trends shaping the Three Phase Distribution Transformer Industry?

  • The integration of digital intelligence and smart monitoring systems represents a pivotal trend shaping the market landscape.

  • The technological evolution of the Three Phase Distribution Transformer is characterized by a rapid shift toward automated diagnostics and sustainable materials. Operators are increasingly integrating on load tap changer mechanisms and real-time insulation resistance monitoring to manage the fluctuating inputs of onshore wind integration. This transition is primarily driven by the necessity to stabilize grid frequencies without manual intervention.
  • By adopting these automated voltage regulation systems, utilities have improved localized energy storage efficiency by 25%. Furthermore, the replacement of traditional fluids with a synthetic ester dielectric has reduced environmental compliance incident costs by 30%, safeguarding sensitive commercial deployments.
  • This strategic upgrade directly lowers total operational risks, enabling facility managers to maintain uninterrupted power delivery during severe load variations while extending the operational lifespan of critical infrastructure assets.

What challenges does the Three Phase Distribution Transformer Industry face during its growth?

  • Volatility in raw material costs combined with persistent supply chain fragility remains a significant structural challenge constraining industry growth.

  • A prominent structural limitation confronting the Three Phase Distribution Transformer sector is the chronic scarcity of high-grade raw materials necessary for maximum efficiency. The limited availability of specialized grain oriented electrical steel directly hinders the mass production of low-loss units, inflating initial capital expenditures for utility buyers.
  • This supply bottleneck is exacerbated by the stringent technical requirements of modern renewable energy integration, which demands robust short circuit resistance and complex harmonic filtering capabilities. Consequently, procurement lead times for advanced units have extended, reducing new project deployment speed by roughly 22%.
  • Furthermore, the integration of complex dissolved gas analysis hardware into standard pad mounted enclosure systems increases assembly complexity, pushing overall manufacturing costs upward by 18% and forcing grid operators to carefully balance budgets against technical modernization.

Exclusive Technavio Analysis on Customer Landscape

The three phase distribution transformer market forecasting report includes the adoption lifecycle of the market, covering from the innovator’s stage to the laggard’s stage. It focuses on adoption rates in different regions based on penetration. Furthermore, the three phase distribution transformer market report also includes key purchase criteria and drivers of price sensitivity to help companies evaluate and develop their market growth analysis strategies.
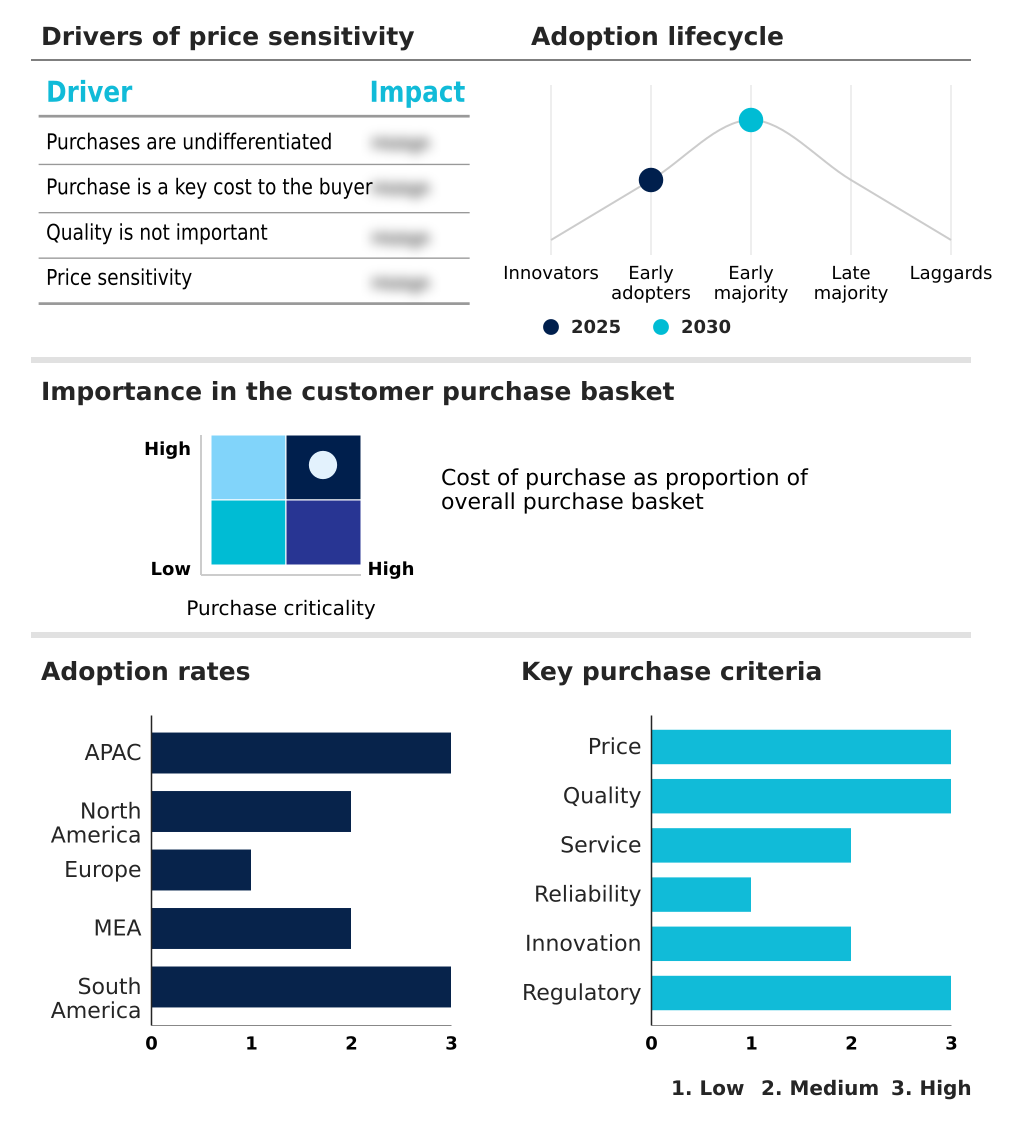
Customer Landscape of Three Phase Distribution Transformer Industry

Competitive Landscape

Companies are implementing various strategies, such as strategic alliances, three phase distribution transformer market forecast, partnerships, mergers and acquisitions, geographical expansion, and product/service launches, to enhance their presence in the industry.

CG Power and Industrial Ltd. - The offering encompasses high-efficiency three phase distribution transformers, including oil-immersed, dry-type, and amorphous core models, specifically engineered to optimize utility, industrial, and commercial power distribution networks.

The industry research and growth report includes detailed analyses of the competitive landscape of the market and information about key companies, including:

  • CG Power and Industrial Ltd.
  • CHINT Group
  • Eaton Corp. Plc
  • EL Sewedy Electric Co.
  • Fuji Electric Co. Ltd.
  • GE Vernova Inc.
  • Hammond Power Inc.
  • Hitachi Energy India Ltd.
  • Howard Industries Inc.
  • Hyosung Heavy Industries Corp.
  • Kirloskar Group
  • Meidensha Corp.
  • Mitsubishi Electric Corp.
  • Prolec Energy
  • Schneider Electric SE
  • SGB-SMIT Group
  • Siemens Energy AG
  • TBEA Co. Ltd.
  • Toshiba Corp.
  • WEG S.A

Qualitative and quantitative analysis of companies has been conducted to help clients understand the wider business environment as well as the strengths and weaknesses of key industry players. Data is qualitatively analyzed to categorize companies as pure play, category-focused, industry-focused, and diversified; it is quantitatively analyzed to categorize companies as dominant, leading, strong, tentative, and weak.

Recent Development and News in Three phase distribution transformer market

  • In the Heavy Electrical Equipment industry, the mandatory transition toward biodegradable dielectric fluid regulations has accelerated the phase-out of traditional mineral oils, directly impacting Three Phase Distribution Transformer demand by requiring a 40% increase in the production of eco-friendly insulation variants.
  • The implementation of stringent grid efficiency standards aimed at reducing no load losses mandated a shift toward high-permeability grain oriented electrical steel, driving a 25% improvement in base energy retention across medium voltage distribution networks.
  • Widespread deployment of smart monitoring sensors within utility scale solar projects transformed condition based asset management, allowing operators to reduce unplanned downtime by 30% through predictive maintenance diagnostics.
  • The exponential growth of electric vehicle charging hub installations necessitated advanced bidirectional power flow management capabilities, resulting in a 50% expansion in the procurement of high-capacity step-down units capable of mitigating high frequency harmonic distortion.

Dive into Technavio’s robust research methodology, blending expert interviews, extensive data synthesis, and validated models for unparalleled Three Phase Distribution Transformer Market insights. See full methodology.

Market Scope
Page number 310
Base year 2025
Historic period 2020-2024
Forecast period 2026-2030
Growth momentum & CAGR Accelerate at a CAGR of 7.3%
Market growth 2026-2030 USD 5915.7 million
Market structure Fragmented
YoY growth 2025-2026(%) 6.4%
Key countries China, India, Japan, South Korea, Australia, Indonesia, US, Canada, Mexico, Germany, France, UK, Italy, Spain, The Netherlands, Saudi Arabia, UAE, South Africa, Turkey, Israel, Brazil, Argentina and Chile
Competitive landscape Leading Companies, Market Positioning of Companies, Competitive Strategies, and Industry Risks

Request Free Sample

Research Analyst Overview

  • The Three Phase Distribution Transformer continues to evolve from a static grid component into a highly dynamic, intelligent asset central to modern energy infrastructure. A profound shift is occurring as facility planners integrate digital twin simulation and condition based asset management into their core budgeting and procurement strategies.
  • By analyzing real-time data on thermal dissipation capacity and load fluctuations, network operators can anticipate component fatigue before catastrophic failure occurs. This proactive approach has enabled major infrastructure developers to decrease unplanned operational downtime by an impressive 34%.
  • The continuous transition toward dry type construction and the implementation of advanced electromagnetic induction techniques are crucial for maintaining safety and efficiency in high-density data centers and urban high-rises. Furthermore, minimizing no load losses through superior core engineering directly supports corporate sustainability mandates and long-term cost reduction initiatives.
  • As bidirectional power flow becomes the standard across all commercial and industrial tiers, securing robust, digitally connected distribution hardware is now a critical boardroom priority for ensuring absolute energy resilience.

What are the Key Data Covered in this Three Phase Distribution Transformer Market Research and Growth Report?

  • What is the expected growth of the Three Phase Distribution Transformer Market between 2026 and 2030?

    • USD 5.92 billion, at a CAGR of 7.3%

  • What segmentation does the market report cover?

    • The report is segmented by Type (Oil-immersed, and Dry-type), Power Rating (More than 500 KVA to 1000 KVA, More than 1000 KVA to 2000 KVA, Below 500 KVA, and Above 2000 KVA), Application (Utilities, Industrial, Commercial, and Residential) and Geography (APAC, North America, Europe, Middle East and Africa, South America)

  • Which regions are analyzed in the report?

    • APAC, North America, Europe, Middle East and Africa and South America

  • What are the key growth drivers and market challenges?

    • Acceleration of renewable energy integration and grid decarbonization, Volatility in raw material costs and supply chain fragility

  • Who are the major players in the Three Phase Distribution Transformer Market?

    • CG Power and Industrial Ltd., CHINT Group, Eaton Corp. Plc, EL Sewedy Electric Co., Fuji Electric Co. Ltd., GE Vernova Inc., Hammond Power Inc., Hitachi Energy India Ltd., Howard Industries Inc., Hyosung Heavy Industries Corp., Kirloskar Group, Meidensha Corp., Mitsubishi Electric Corp., Prolec Energy, Schneider Electric SE, SGB-SMIT Group, Siemens Energy AG, TBEA Co. Ltd., Toshiba Corp. and WEG S.A

Market Research Insights

  • The Three Phase Distribution Transformer sector is rapidly evolving to support complex bidirectional grid architecture and heavy industrial power conversion. Driven by escalating rural electrification infrastructure mandates and commercial load management needs, network operators are modernizing legacy grids with advanced digital components.
  • Implementing condition based asset management systems has allowed utilities to decrease unexpected localized outages by 18%, significantly improving overall reliability. Furthermore, the integration of silicon carbide power electronics within specialized transformer units has enhanced high capacity load cycling performance by 25%.
  • This technological shift directly optimizes total cost of ownership by extending equipment lifespans and aligning with strict national energy conservation mandates, ensuring stable power delivery across commercial and industrial environments.

We can help! Our analysts can customize this three phase distribution transformer market research report to meet your requirements.

Get in touch

1. Executive Summary

1.1 Market overview

Executive Summary - Chart on Market Overview
Executive Summary - Data Table on Market Overview
Executive Summary - Chart on Global Market Characteristics
Executive Summary - Chart on Market by Geography
Executive Summary - Chart on Market Segmentation by Type
Executive Summary - Chart on Market Segmentation by Power Rating
Executive Summary - Chart on Market Segmentation by Application
Executive Summary - Chart on Incremental Growth
Executive Summary - Data Table on Incremental Growth
Executive Summary - Chart on Company Market Positioning

2. Technavio Analysis

2.1 Analysis of price sensitivity, lifecycle, customer purchase basket, adoption rates, and purchase criteria

2.2 Criticality of inputs and Factors of differentiation

Chart on Overview on criticality of inputs and factors of differentiation

2.3 Factors of disruption

Chart on Overview on factors of disruption

2.4 Impact of drivers and challenges

Chart on Impact of drivers and challenges in 2025 and 2030

3. Market Landscape

3.1 Market ecosystem

Chart on Parent Market
Data Table on - Parent Market

3.2 Market characteristics

Chart on Market characteristics analysis

3.3 Value chain analysis

Chart on Value chain analysis

4. Market Sizing

4.1 Market definition

Data Table on Offerings of companies included in the market definition

4.2 Market segment analysis

Market segments

4.3 Market size 2025

4.4 Market outlook: Forecast for 2025-2030

Chart on Global - Market size and forecast 2025-2030 ($ million)
Data Table on Global - Market size and forecast 2025-2030 ($ million)
Chart on Global Market: Year-over-year growth 2025-2030 (%)
Data Table on Global Market: Year-over-year growth 2025-2030 (%)

5. Historic Market Size

5.1 Global Three Phase Distribution Transformer Market 2020 - 2024

Historic Market Size - Data Table on Global Three Phase Distribution Transformer Market 2020 - 2024 ($ million)

5.2 Type segment analysis 2020 - 2024

Historic Market Size - Type Segment 2020 - 2024 ($ million)

5.3 Power Rating segment analysis 2020 - 2024

Historic Market Size - Power Rating Segment 2020 - 2024 ($ million)

5.4 Application segment analysis 2020 - 2024

Historic Market Size - Application Segment 2020 - 2024 ($ million)

5.5 Geography segment analysis 2020 - 2024

Historic Market Size - Geography Segment 2020 - 2024 ($ million)

5.6 Country segment analysis 2020 - 2024

Historic Market Size - Country Segment 2020 - 2024 ($ million)

6. Qualitative Analysis

6.1 Impact of AI on Global Three Phase Distribution Transformer Market

6.2 Impact of geopolitical conflicts on Global Three Phase Distribution Transformer Market

7. Five Forces Analysis

7.1 Five forces summary

Five forces analysis - Comparison between 2025 and 2030

7.2 Bargaining power of buyers

Bargaining power of buyers - Impact of key factors 2025 and 2030

7.3 Bargaining power of suppliers

Bargaining power of suppliers - Impact of key factors in 2025 and 2030

7.4 Threat of new entrants

Threat of new entrants - Impact of key factors in 2025 and 2030

7.5 Threat of substitutes

Threat of substitutes - Impact of key factors in 2025 and 2030

7.6 Threat of rivalry

Threat of rivalry - Impact of key factors in 2025 and 2030

7.7 Market condition

Chart on Market condition - Five forces 2025 and 2030

8. Market Segmentation by Type

8.1 Market segments

Chart on Type - Market share 2025-2030 (%)
Data Table on Type - Market share 2025-2030 (%)

8.2 Comparison by Type

Chart on Comparison by Type
Data Table on Comparison by Type

8.3 Oil-immersed - Market size and forecast 2025-2030

Chart on Oil-immersed - Market size and forecast 2025-2030 ($ million)
Data Table on Oil-immersed - Market size and forecast 2025-2030 ($ million)
Chart on Oil-immersed - Year-over-year growth 2025-2030 (%)
Data Table on Oil-immersed - Year-over-year growth 2025-2030 (%)

8.4 Dry-type - Market size and forecast 2025-2030

Chart on Dry-type - Market size and forecast 2025-2030 ($ million)
Data Table on Dry-type - Market size and forecast 2025-2030 ($ million)
Chart on Dry-type - Year-over-year growth 2025-2030 (%)
Data Table on Dry-type - Year-over-year growth 2025-2030 (%)

8.5 Market opportunity by Type

Market opportunity by Type ($ million)
Data Table on Market opportunity by Type ($ million)

9. Market Segmentation by Power Rating

9.1 Market segments

Chart on Power Rating - Market share 2025-2030 (%)
Data Table on Power Rating - Market share 2025-2030 (%)

9.2 Comparison by Power Rating

Chart on Comparison by Power Rating
Data Table on Comparison by Power Rating

9.3 More than 500 KVA to 1000 KVA - Market size and forecast 2025-2030

Chart on More than 500 KVA to 1000 KVA - Market size and forecast 2025-2030 ($ million)
Data Table on More than 500 KVA to 1000 KVA - Market size and forecast 2025-2030 ($ million)
Chart on More than 500 KVA to 1000 KVA - Year-over-year growth 2025-2030 (%)
Data Table on More than 500 KVA to 1000 KVA - Year-over-year growth 2025-2030 (%)

9.4 More than 1000 KVA to 2000 KVA - Market size and forecast 2025-2030

Chart on More than 1000 KVA to 2000 KVA - Market size and forecast 2025-2030 ($ million)
Data Table on More than 1000 KVA to 2000 KVA - Market size and forecast 2025-2030 ($ million)
Chart on More than 1000 KVA to 2000 KVA - Year-over-year growth 2025-2030 (%)
Data Table on More than 1000 KVA to 2000 KVA - Year-over-year growth 2025-2030 (%)

9.5 Below 500 KVA - Market size and forecast 2025-2030

Chart on Below 500 KVA - Market size and forecast 2025-2030 ($ million)
Data Table on Below 500 KVA - Market size and forecast 2025-2030 ($ million)
Chart on Below 500 KVA - Year-over-year growth 2025-2030 (%)
Data Table on Below 500 KVA - Year-over-year growth 2025-2030 (%)

9.6 Above 2000 KVA - Market size and forecast 2025-2030

Chart on Above 2000 KVA - Market size and forecast 2025-2030 ($ million)
Data Table on Above 2000 KVA - Market size and forecast 2025-2030 ($ million)
Chart on Above 2000 KVA - Year-over-year growth 2025-2030 (%)
Data Table on Above 2000 KVA - Year-over-year growth 2025-2030 (%)

9.7 Market opportunity by Power Rating

Market opportunity by Power Rating ($ million)
Data Table on Market opportunity by Power Rating ($ million)

10. Market Segmentation by Application

10.1 Market segments

Chart on Application - Market share 2025-2030 (%)
Data Table on Application - Market share 2025-2030 (%)

10.2 Comparison by Application

Chart on Comparison by Application
Data Table on Comparison by Application

10.3 Utilities - Market size and forecast 2025-2030

Chart on Utilities - Market size and forecast 2025-2030 ($ million)
Data Table on Utilities - Market size and forecast 2025-2030 ($ million)
Chart on Utilities - Year-over-year growth 2025-2030 (%)
Data Table on Utilities - Year-over-year growth 2025-2030 (%)

10.4 Industrial - Market size and forecast 2025-2030

Chart on Industrial - Market size and forecast 2025-2030 ($ million)
Data Table on Industrial - Market size and forecast 2025-2030 ($ million)
Chart on Industrial - Year-over-year growth 2025-2030 (%)
Data Table on Industrial - Year-over-year growth 2025-2030 (%)

10.5 Commercial - Market size and forecast 2025-2030

Chart on Commercial - Market size and forecast 2025-2030 ($ million)
Data Table on Commercial - Market size and forecast 2025-2030 ($ million)
Chart on Commercial - Year-over-year growth 2025-2030 (%)
Data Table on Commercial - Year-over-year growth 2025-2030 (%)

10.6 Residential - Market size and forecast 2025-2030

Chart on Residential - Market size and forecast 2025-2030 ($ million)
Data Table on Residential - Market size and forecast 2025-2030 ($ million)
Chart on Residential - Year-over-year growth 2025-2030 (%)
Data Table on Residential - Year-over-year growth 2025-2030 (%)

10.7 Market opportunity by Application

Market opportunity by Application ($ million)
Data Table on Market opportunity by Application ($ million)

11. Customer Landscape

11.1 Customer landscape overview

Analysis of price sensitivity, lifecycle, customer purchase basket, adoption rates, and purchase criteria

12. Geographic Landscape

12.1 Geographic segmentation

Chart on Market share by geography 2025-2030 (%)
Data Table on Market share by geography 2025-2030 (%)

12.2 Geographic comparison

Chart on Geographic comparison
Data Table on Geographic comparison

12.3 APAC - Market size and forecast 2025-2030

Chart on APAC - Market size and forecast 2025-2030 ($ million)
Data Table on APAC - Market size and forecast 2025-2030 ($ million)
Chart on APAC - Year-over-year growth 2025-2030 (%)
Data Table on APAC - Year-over-year growth 2025-2030 (%)
Chart on Regional Comparison - APAC
Data Table on Regional Comparison - APAC

12.3.1 China - Market size and forecast 2025-2030

Chart on China - Market size and forecast 2025-2030 ($ million)
Data Table on China - Market size and forecast 2025-2030 ($ million)
Chart on China - Year-over-year growth 2025-2030 (%)
Data Table on China - Year-over-year growth 2025-2030 (%)

12.3.2 India - Market size and forecast 2025-2030

Chart on India - Market size and forecast 2025-2030 ($ million)
Data Table on India - Market size and forecast 2025-2030 ($ million)
Chart on India - Year-over-year growth 2025-2030 (%)
Data Table on India - Year-over-year growth 2025-2030 (%)

12.3.3 Japan - Market size and forecast 2025-2030

Chart on Japan - Market size and forecast 2025-2030 ($ million)
Data Table on Japan - Market size and forecast 2025-2030 ($ million)
Chart on Japan - Year-over-year growth 2025-2030 (%)
Data Table on Japan - Year-over-year growth 2025-2030 (%)

12.3.4 South Korea - Market size and forecast 2025-2030

Chart on South Korea - Market size and forecast 2025-2030 ($ million)
Data Table on South Korea - Market size and forecast 2025-2030 ($ million)
Chart on South Korea - Year-over-year growth 2025-2030 (%)
Data Table on South Korea - Year-over-year growth 2025-2030 (%)

12.3.5 Australia - Market size and forecast 2025-2030

Chart on Australia - Market size and forecast 2025-2030 ($ million)
Data Table on Australia - Market size and forecast 2025-2030 ($ million)
Chart on Australia - Year-over-year growth 2025-2030 (%)
Data Table on Australia - Year-over-year growth 2025-2030 (%)

12.3.6 Indonesia - Market size and forecast 2025-2030

Chart on Indonesia - Market size and forecast 2025-2030 ($ million)
Data Table on Indonesia - Market size and forecast 2025-2030 ($ million)
Chart on Indonesia - Year-over-year growth 2025-2030 (%)
Data Table on Indonesia - Year-over-year growth 2025-2030 (%)

12.4 North America - Market size and forecast 2025-2030

Chart on North America - Market size and forecast 2025-2030 ($ million)
Data Table on North America - Market size and forecast 2025-2030 ($ million)
Chart on North America - Year-over-year growth 2025-2030 (%)
Data Table on North America - Year-over-year growth 2025-2030 (%)
Chart on Regional Comparison - North America
Data Table on Regional Comparison - North America

12.4.1 US - Market size and forecast 2025-2030

Chart on US - Market size and forecast 2025-2030 ($ million)
Data Table on US - Market size and forecast 2025-2030 ($ million)
Chart on US - Year-over-year growth 2025-2030 (%)
Data Table on US - Year-over-year growth 2025-2030 (%)

12.4.2 Canada - Market size and forecast 2025-2030

Chart on Canada - Market size and forecast 2025-2030 ($ million)
Data Table on Canada - Market size and forecast 2025-2030 ($ million)
Chart on Canada - Year-over-year growth 2025-2030 (%)
Data Table on Canada - Year-over-year growth 2025-2030 (%)

12.4.3 Mexico - Market size and forecast 2025-2030

Chart on Mexico - Market size and forecast 2025-2030 ($ million)
Data Table on Mexico - Market size and forecast 2025-2030 ($ million)
Chart on Mexico - Year-over-year growth 2025-2030 (%)
Data Table on Mexico - Year-over-year growth 2025-2030 (%)

12.5 Europe - Market size and forecast 2025-2030

Chart on Europe - Market size and forecast 2025-2030 ($ million)
Data Table on Europe - Market size and forecast 2025-2030 ($ million)
Chart on Europe - Year-over-year growth 2025-2030 (%)
Data Table on Europe - Year-over-year growth 2025-2030 (%)
Chart on Regional Comparison - Europe
Data Table on Regional Comparison - Europe

12.5.1 Germany - Market size and forecast 2025-2030

Chart on Germany - Market size and forecast 2025-2030 ($ million)
Data Table on Germany - Market size and forecast 2025-2030 ($ million)
Chart on Germany - Year-over-year growth 2025-2030 (%)
Data Table on Germany - Year-over-year growth 2025-2030 (%)

12.5.2 France - Market size and forecast 2025-2030

Chart on France - Market size and forecast 2025-2030 ($ million)
Data Table on France - Market size and forecast 2025-2030 ($ million)
Chart on France - Year-over-year growth 2025-2030 (%)
Data Table on France - Year-over-year growth 2025-2030 (%)

12.5.3 UK - Market size and forecast 2025-2030

Chart on UK - Market size and forecast 2025-2030 ($ million)
Data Table on UK - Market size and forecast 2025-2030 ($ million)
Chart on UK - Year-over-year growth 2025-2030 (%)
Data Table on UK - Year-over-year growth 2025-2030 (%)

12.5.4 Italy - Market size and forecast 2025-2030

Chart on Italy - Market size and forecast 2025-2030 ($ million)
Data Table on Italy - Market size and forecast 2025-2030 ($ million)
Chart on Italy - Year-over-year growth 2025-2030 (%)
Data Table on Italy - Year-over-year growth 2025-2030 (%)

12.5.5 Spain - Market size and forecast 2025-2030

Chart on Spain - Market size and forecast 2025-2030 ($ million)
Data Table on Spain - Market size and forecast 2025-2030 ($ million)
Chart on Spain - Year-over-year growth 2025-2030 (%)
Data Table on Spain - Year-over-year growth 2025-2030 (%)

12.5.6 The Netherlands - Market size and forecast 2025-2030

Chart on The Netherlands - Market size and forecast 2025-2030 ($ million)
Data Table on The Netherlands - Market size and forecast 2025-2030 ($ million)
Chart on The Netherlands - Year-over-year growth 2025-2030 (%)
Data Table on The Netherlands - Year-over-year growth 2025-2030 (%)

12.6 Middle East and Africa - Market size and forecast 2025-2030

Chart on Middle East and Africa - Market size and forecast 2025-2030 ($ million)
Data Table on Middle East and Africa - Market size and forecast 2025-2030 ($ million)
Chart on Middle East and Africa - Year-over-year growth 2025-2030 (%)
Data Table on Middle East and Africa - Year-over-year growth 2025-2030 (%)
Chart on Regional Comparison - Middle East and Africa
Data Table on Regional Comparison - Middle East and Africa

12.6.1 Saudi Arabia - Market size and forecast 2025-2030

Chart on Saudi Arabia - Market size and forecast 2025-2030 ($ million)
Data Table on Saudi Arabia - Market size and forecast 2025-2030 ($ million)
Chart on Saudi Arabia - Year-over-year growth 2025-2030 (%)
Data Table on Saudi Arabia - Year-over-year growth 2025-2030 (%)

12.6.2 UAE - Market size and forecast 2025-2030

Chart on UAE - Market size and forecast 2025-2030 ($ million)
Data Table on UAE - Market size and forecast 2025-2030 ($ million)
Chart on UAE - Year-over-year growth 2025-2030 (%)
Data Table on UAE - Year-over-year growth 2025-2030 (%)

12.6.3 South Africa - Market size and forecast 2025-2030

Chart on South Africa - Market size and forecast 2025-2030 ($ million)
Data Table on South Africa - Market size and forecast 2025-2030 ($ million)
Chart on South Africa - Year-over-year growth 2025-2030 (%)
Data Table on South Africa - Year-over-year growth 2025-2030 (%)

12.6.4 Turkey - Market size and forecast 2025-2030

Chart on Turkey - Market size and forecast 2025-2030 ($ million)
Data Table on Turkey - Market size and forecast 2025-2030 ($ million)
Chart on Turkey - Year-over-year growth 2025-2030 (%)
Data Table on Turkey - Year-over-year growth 2025-2030 (%)

12.6.5 Israel - Market size and forecast 2025-2030

Chart on Israel - Market size and forecast 2025-2030 ($ million)
Data Table on Israel - Market size and forecast 2025-2030 ($ million)
Chart on Israel - Year-over-year growth 2025-2030 (%)
Data Table on Israel - Year-over-year growth 2025-2030 (%)

12.7 South America - Market size and forecast 2025-2030

Chart on South America - Market size and forecast 2025-2030 ($ million)
Data Table on South America - Market size and forecast 2025-2030 ($ million)
Chart on South America - Year-over-year growth 2025-2030 (%)
Data Table on South America - Year-over-year growth 2025-2030 (%)
Chart on Regional Comparison - South America
Data Table on Regional Comparison - South America

12.7.1 Brazil - Market size and forecast 2025-2030

Chart on Brazil - Market size and forecast 2025-2030 ($ million)
Data Table on Brazil - Market size and forecast 2025-2030 ($ million)
Chart on Brazil - Year-over-year growth 2025-2030 (%)
Data Table on Brazil - Year-over-year growth 2025-2030 (%)

12.7.2 Argentina - Market size and forecast 2025-2030

Chart on Argentina - Market size and forecast 2025-2030 ($ million)
Data Table on Argentina - Market size and forecast 2025-2030 ($ million)
Chart on Argentina - Year-over-year growth 2025-2030 (%)
Data Table on Argentina - Year-over-year growth 2025-2030 (%)

12.7.3 Chile - Market size and forecast 2025-2030

Chart on Chile - Market size and forecast 2025-2030 ($ million)
Data Table on Chile - Market size and forecast 2025-2030 ($ million)
Chart on Chile - Year-over-year growth 2025-2030 (%)
Data Table on Chile - Year-over-year growth 2025-2030 (%)

12.8 Market opportunity by geography

Market opportunity by geography ($ million)
Data Tables on Market opportunity by geography ($ million)

13. Drivers, Challenges, and Opportunity

13.1 Market drivers

Acceleration of renewable energy integration and grid decarbonization
Industrial expansion and infrastructure development in emerging economies
Modernization of aging grid infrastructure and resilience initiatives

13.2 Market challenges

Volatility in raw material costs and supply chain fragility
High initial capital expenditure and financial constraints
Stringent regulatory compliance and lack of standardization

13.3 Impact of drivers and challenges

Impact of drivers and challenges in 2025 and 2030

13.4 Market opportunities

Integration of digital intelligence and smart monitoring systems
Transition toward sustainable bio-based insulation fluids
Rise of specialized infrastructure for electric vehicle integration

14. Competitive Landscape

14.1 Overview

14.2

Overview on criticality of inputs and factors of differentiation

14.3 Landscape disruption

Overview on factors of disruption

14.4 Industry risks

Impact of key risks on business

15. Competitive Analysis

15.1 Companies profiled

Companies covered

15.2 Company ranking index

15.3 Market positioning of companies

Matrix on companies position and classification

15.4 CG Power and Industrial Ltd.

CG Power and Industrial Ltd. - Overview
CG Power and Industrial Ltd. - Business segments
CG Power and Industrial Ltd. - Key offerings
CG Power and Industrial Ltd. - Segment focus
SWOT

15.5 Eaton Corp. Plc

Eaton Corp. Plc - Overview
Eaton Corp. Plc - Business segments
Eaton Corp. Plc - Key news
Eaton Corp. Plc - Key offerings
Eaton Corp. Plc - Segment focus
SWOT

15.6 EL Sewedy Electric Co.

EL Sewedy Electric Co. - Overview
EL Sewedy Electric Co. - Business segments
EL Sewedy Electric Co. - Key offerings
EL Sewedy Electric Co. - Segment focus
SWOT

15.7 Fuji Electric Co. Ltd.

Fuji Electric Co. Ltd. - Overview
Fuji Electric Co. Ltd. - Business segments
Fuji Electric Co. Ltd. - Key offerings
Fuji Electric Co. Ltd. - Segment focus
SWOT

15.8 GE Vernova Inc.

GE Vernova Inc. - Overview
GE Vernova Inc. - Business segments
GE Vernova Inc. - Key offerings
GE Vernova Inc. - Segment focus
SWOT

15.9 Hitachi Energy India Ltd.

Hitachi Energy India Ltd. - Overview
Hitachi Energy India Ltd. - Product / Service
Hitachi Energy India Ltd. - Key offerings
SWOT

15.10 Howard Industries Inc.

Howard Industries Inc. - Overview
Howard Industries Inc. - Product / Service
Howard Industries Inc. - Key offerings
SWOT

15.11 Hyosung Heavy Industries Corp.

Hyosung Heavy Industries Corp. - Overview
Hyosung Heavy Industries Corp. - Product / Service
Hyosung Heavy Industries Corp. - Key offerings
SWOT

15.12 Kirloskar Group

Kirloskar Group - Overview
Kirloskar Group - Product / Service
Kirloskar Group - Key offerings
SWOT

15.13 Meidensha Corp.

Meidensha Corp. - Overview
Meidensha Corp. - Business segments
Meidensha Corp. - Key offerings
Meidensha Corp. - Segment focus
SWOT

15.14 Mitsubishi Electric Corp.

Mitsubishi Electric Corp. - Overview
Mitsubishi Electric Corp. - Business segments
Mitsubishi Electric Corp. - Key offerings
Mitsubishi Electric Corp. - Segment focus
SWOT

15.15 Schneider Electric SE

Schneider Electric SE - Overview
Schneider Electric SE - Business segments
Schneider Electric SE - Key news
Schneider Electric SE - Key offerings
Schneider Electric SE - Segment focus
SWOT

15.16 Siemens Energy AG

Siemens Energy AG - Overview
Siemens Energy AG - Business segments
Siemens Energy AG - Key news
Siemens Energy AG - Key offerings
Siemens Energy AG - Segment focus
SWOT

15.17 TBEA Co. Ltd.

TBEA Co. Ltd. - Overview
TBEA Co. Ltd. - Product / Service
TBEA Co. Ltd. - Key offerings
SWOT

15.18 Toshiba Corp.

Toshiba Corp. - Overview
Toshiba Corp. - Product / Service
Toshiba Corp. - Key offerings
SWOT

16. Appendix

16.1 Scope of the report

Market definition
Objectives
Notes and caveats

16.2 Inclusions and exclusions checklist

Inclusions checklist
Exclusions checklist

16.3 Currency conversion rates for US$

16.4 Research methodology

16.5 Data procurement

Information sources

16.6 Data validation

16.7 Validation techniques employed for market sizing

16.8 Data synthesis

16.9 360 degree market analysis

16.10 List of abbreviations

Research Methodology

Technavio presents a detailed picture of the market by way of study, synthesis, and summation of data from multiple sources. The analysts have presented the various facets of the market with a particular focus on identifying the key industry influencers. The data thus presented is comprehensive, reliable, and the result of extensive research, both primary and secondary.

INFORMATION SOURCES

Primary sources

  • Manufacturers and suppliers
  • Channel partners
  • Industry experts
  • Strategic decision makers

Secondary sources

  • Industry journals and periodicals
  • Government data
  • Financial reports of key industry players
  • Historical data
  • Press releases

DATA ANALYSIS

Data Synthesis

  • Collation of data
  • Estimation of key figures
  • Analysis of derived insights

Data Validation

  • Triangulation with data models
  • Reference against proprietary databases
  • Corroboration with industry experts

REPORT WRITING

Qualitative

  • Market drivers
  • Market challenges
  • Market trends
  • Five forces analysis

Quantitative

  • Market size and forecast
  • Market segmentation
  • Geographical insights
  • Competitive landscape

Interested in this report?

Get your sample now to see our research methodology and insights!

Download Now

Frequently Asked Questions

Three Phase Distribution Transformer market growth will increase by USD 5915.7 million during 2026-2030.

The Three Phase Distribution Transformer market is expected to grow at a CAGR of 7.3% during 2026-2030.

Three Phase Distribution Transformer market is segmented by Type (Oil-immersed, Dry-type) Power rating (More than 500 KVA to 1000 KVA, More than 1000 KVA to 2000 KVA, Below 500 KVA, Above 2000 KVA) Application (Utilities, Industrial, Commercial, Residential)

CG Power and Industrial Ltd., CHINT Group, Eaton Corp. Plc, EL Sewedy Electric Co., Fuji Electric Co. Ltd., GE Vernova Inc., Hammond Power Inc., Hitachi Energy India Ltd., Howard Industries Inc., Hyosung Heavy Industries Corp., Kirloskar Group, Meidensha Corp., Mitsubishi Electric Corp., Prolec Energy, Schneider Electric SE, SGB-SMIT Group, Siemens Energy AG, TBEA Co. Ltd., Toshiba Corp., WEG S.A are a few of the key vendors in the Three Phase Distribution Transformer market.

APAC will register the highest growth rate of 48.3% among the other regions. Therefore, the Three Phase Distribution Transformer market in APAC is expected to garner significant business opportunities for the vendors during the forecast period.

China, India, Japan, South Korea, Australia, Indonesia, US, Canada, Mexico, Germany, France, UK, Italy, Spain, The Netherlands, Saudi Arabia, UAE, South Africa, Turkey, Israel, Brazil, Argentina, Chile

  • Acceleration of renewable energy integration and grid decarbonization is the driving factor this market.

The Three Phase Distribution Transformer market vendors should focus on grabbing business opportunities from the Type segment as it accounted for the largest market share in the base year.
RIA - Research AI Assistant
Ask RIA
