
Trade Finance Market Analysis, Size, and Forecast 2026-2030: North America (US, Canada, and Mexico), Europe (UK, Germany, and France), APAC (China, Japan, and India), Middle East and Africa (UAE, Saudi Arabia, and South Africa), South America (Brazil, Chile, and Argentina), and Rest of World (ROW)

Trade Finance Market Analysis, Size, and Forecast 2026-2030:
North America (US, Canada, and Mexico), Europe (UK, Germany, and France), APAC (China, Japan, and India), Middle East and Africa (UAE, Saudi Arabia, and South Africa), South America (Brazil, Chile, and Argentina), and Rest of World (ROW)

Published: Oct 2026 325 Pages SKU: IRTNTR40571

Market Overview at a Glance

$19.39 B
Market Opportunity
5.7%
CAGR 2025 - 2030
36.6%
APAC Growth
$22.17 B
Traditional trade finance segment 2024

Trade Finance Market Size 2026-2030

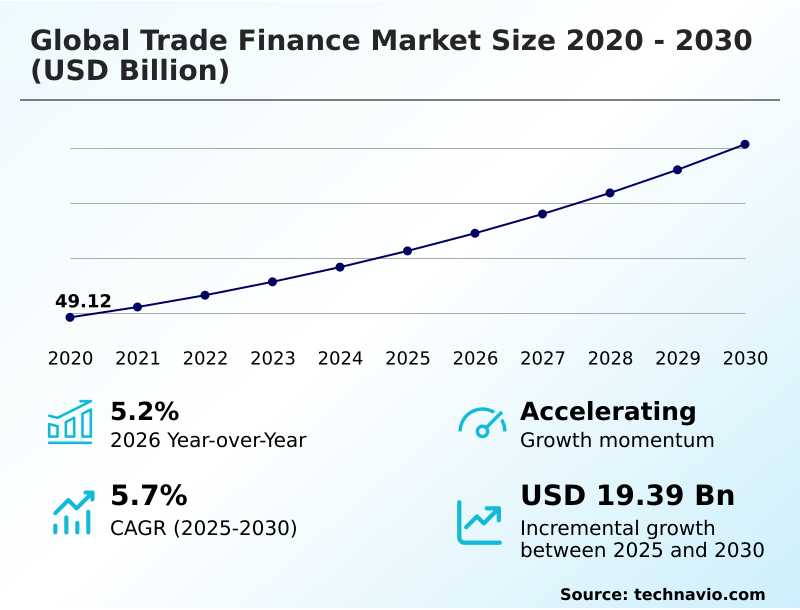
The trade finance market size is valued to increase by USD 19.39 billion, at a CAGR of 5.7% from 2025 to 2030. Integration of advanced digital technologies and blockchain systems will drive the trade finance market.

Major Market Trends & Insights

  • APAC dominated the market and accounted for a 36.6% growth during the forecast period.
  • By Type - Traditional trade finance segment was valued at USD 22.17 billion in 2024
  • By End-user - Importers and exporters segment accounted for the largest market revenue share in 2024

Market Size & Forecast

  • Market Opportunities: USD 31.47 billion
  • Market Future Opportunities: USD 19.39 billion
  • CAGR from 2025 to 2030 : 5.7%

Market Summary

  • The Trade Finance Market is experiencing a paradigm shift driven by the rapid transition from legacy paper-based documentation to automated digital architectures. In modern supply chain operations, multinational manufacturers are restructuring their procurement corridors, utilizing specialized financing programs to secure liquidity for upstream suppliers.
  • This embedded finance approach enhances operational continuity, as companies deploying integrated digital platforms report a 25% improvement in cash conversion cycles compared to traditional manual processing. The primary driver of this market is the integration of advanced digital technologies, such as artificial intelligence and distributed ledgers, which automate complex risk assessments and eliminate information asymmetry.
  • Conversely, the market faces a substantial challenge from stringent regulatory requirements and capital adequacy mandates. These regulatory burdens increase compliance costs, often leading financial institutions to withdraw services from high-risk emerging markets, effectively causing a de-risking phenomenon.
  • Ultimately, balancing technological modernization with complex regulatory frameworks remains critical for expanding trade credit access and sustaining resilient international commerce across evolving industrial sectors.

What will be the Size of the Trade Finance Market during the forecast period?
Get Key Insights on Market Forecast (PDF) Get Free Sample

How is the Trade Finance Market Segmented?

The trade finance industry research report provides comprehensive data (region-wise segment analysis), with forecasts and estimates in "USD million" for the period 2026-2030, as well as historical data from 2020-2024 for the following segments.

  • Type
    • Traditional trade finance
    • Supply chain finance
    • Structured trade finance
  • End-user
    • Importers and exporters
    • Banks and financiers
    • Insurers and ECAs
  • Product type
    • Letters of credit
    • Supply chain finance
    • Trade credit insurance
    • Documentary collections
    • Others
  • Business segment
    • Domestic trade finance
    • International trade finance
  • Geography
    • North America
      • US
      • Canada
      • Mexico
    • Europe
      • UK
      • Germany
      • France
      • The Netherlands
      • Italy
      • Spain
    • APAC
      • China
      • Japan
      • India
      • Singapore
      • South Korea
      • Australia
    • Middle East and Africa
      • UAE
      • Saudi Arabia
      • South Africa
      • Israel
      • Egypt
    • South America
      • Brazil
      • Chile
      • Argentina

By Type Insights

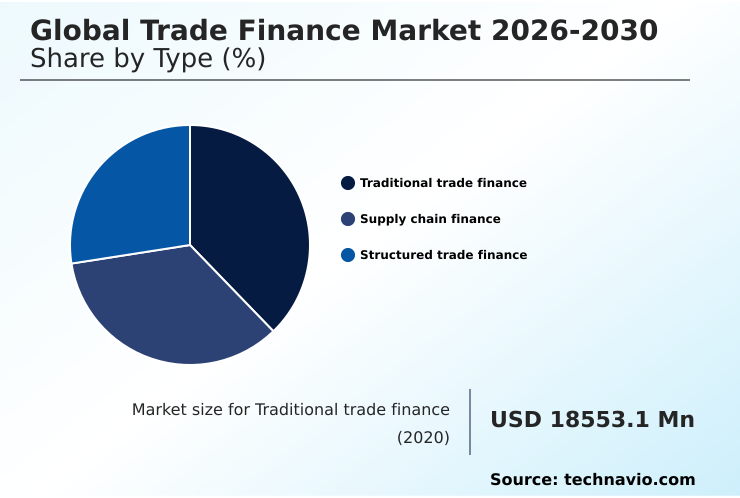
The traditional trade finance segment is estimated to witness significant growth during the forecast period.

The traditional segment forms the foundation of commercial exchanges, utilizing rigorous documentary credit management to mitigate counterparty risks. This sector heavily relies on pre-shipment financing and post-shipment financing to substitute private buyer risks with institutional assurance.

As international commerce expands, these transactions face modernization through electronic invoice presentation and automated factoring exchanges. The integration of optical character recognition has fundamentally optimized supply chain finance, enabling banks to process transactions with greater accuracy.

For instance, the deployment of receivables discounting models connected to enterprise resource planning software has improved document verification speed by 35%.

Consequently, transitioning to automated workflows ensures operational continuity while reducing manual discrepancy errors by 18%, significantly impacting overall business efficiency.
Get Free Sample

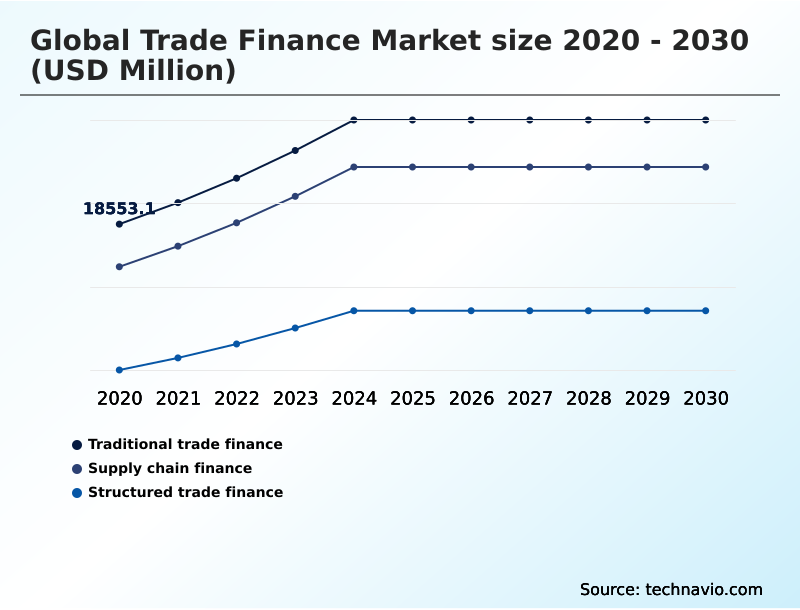
The Traditional trade finance segment was valued at USD 22.17 billion in 2024 and showed a gradual increase during the forecast period.
Get Free Sample

Regional Analysis

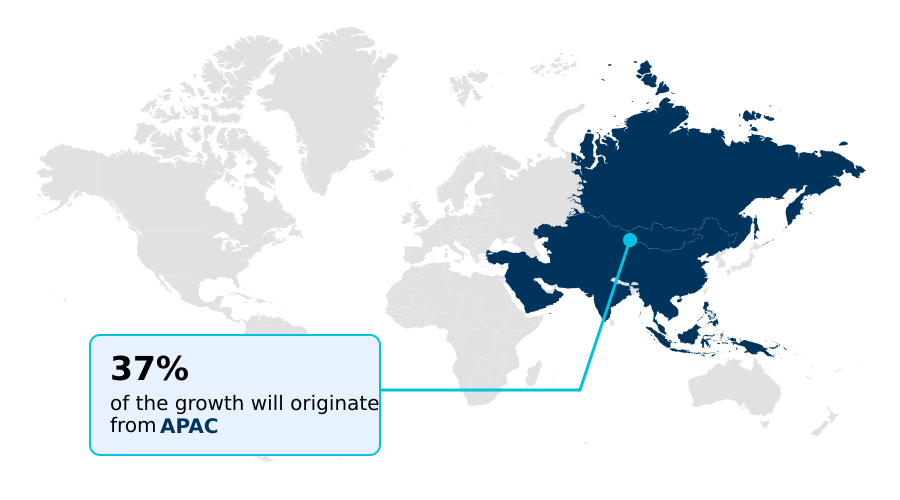
APAC is estimated to contribute 36.6% to the growth of the global market during the forecast period.Technavio’s analysts have elaborately explained the regional trends and drivers that shape the market during the forecast period.
See How Trade Finance Market Demand is Rising in APAC Get Free Sample

The geographic landscape of the Trade Finance highlights distinct regional adaptations in cross-border commercial transactions and documentary credit mechanisms.

North America leads the transition toward digital trade processing, where embedded finance solutions and cloud-native enterprise connectivity have improved enterprise payment efficiency by 28%.

In contrast, the APAC region demonstrates rapid acceleration in trade transaction management digitization, achieving a 35% reduction in fraud incidents through blockchain distributed ledgers.

While North America focuses on streamlining procurement corridors, APAC relies on robust risk mitigation instruments to bridge diverse regulatory frameworks among emerging economies.

Additionally, regional differences underscore how businesses utilize tailored borrowing base facilities and warehouse receipt financing to maintain competitiveness. The strategic use of tolling structures countertrade in developing markets has further reduced operational bottlenecks by 15%.

Market Dynamics

Our researchers analyzed the data with 2025 as the base year, along with the key drivers, trends, and challenges. A holistic analysis of drivers will help companies refine their marketing strategies to gain a competitive advantage.

  • The modernization of the Trade Finance is fundamentally altering how multinational corporations and financial institutions manage liquidity. Historically, manual documentation processes introduced significant friction into international supply chains. Today, the deployment of automated digital trade finance platforms offers unprecedented efficiency, reducing processing delays by nearly 40% compared to legacy paper-based systems.
  • This transformation is highly visible as institutions prioritize cross-border commercial transaction risk mitigation, ensuring that both buyers and sellers can navigate volatile currency and political landscapes securely. A key component of this evolution is the integration of distributed ledger technology trade finance, which establishes an immutable, decentralized record of all transactions.
  • This technological shift drastically lowers the incidence of fraud and duplicate invoice funding, directly enhancing operational planning predictability. Furthermore, enterprises are increasingly seeking embedded supply chain finance solutions that connect directly with their enterprise resource programming software. This seamless integration allows corporate treasurers to allocate working capital efficiently across multi-tier supplier networks.
  • Concurrently, the availability of early invoice financing for corporate suppliers has proven vital in maintaining overall network resilience, allowing smaller vendors to access immediate cash flow at competitive rates based on the buyer's creditworthiness. These sophisticated mechanisms collectively strengthen the operational foundation of commerce, bridging the persistent trade credit gap.
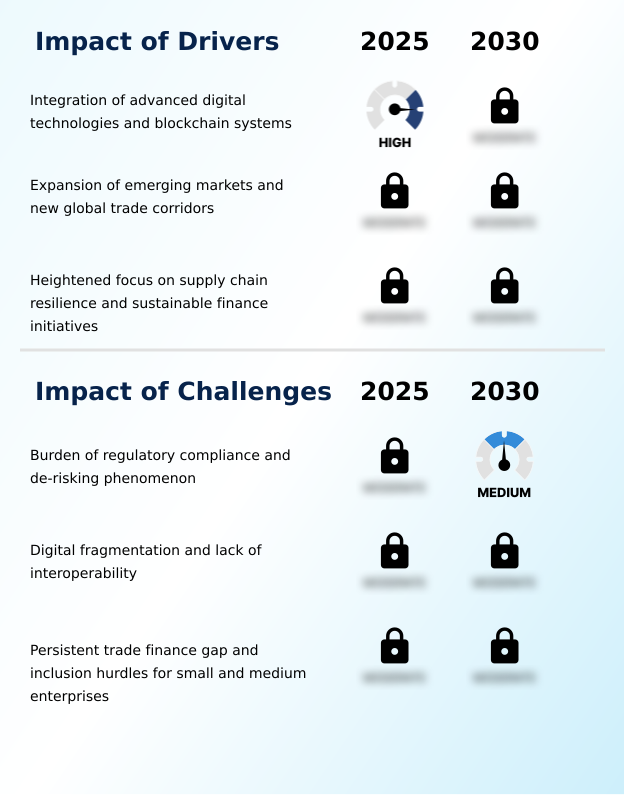
What are the key market drivers leading to the rise in the adoption of Trade Finance Industry?

  • The integration of advanced digital technologies and blockchain systems serves as the primary driver propelling market expansion and transactional efficiency.

  • The primary driver of the Trade Finance is the widespread integration of machine learning automation and artificial intelligence risk assessment tools. By transitioning to digital invoice financing and algorithmic risk assessment, lenders have reduced underwriting times by over 35%.
  • This enables real-time verification of electronic bills lading and electronic negotiable instruments, dramatically lowering fraud risks. Additionally, the shift toward open-account commercial structures requires efficient working capital optimization strategies.
  • Companies deploying reverse factoring solutions and dynamic discounting models secure non-recourse liquidity faster, improving their cash conversion cycles by 20%.
  • The seamless execution of automated credit scoring through robust invoice financing platforms allows corporations to maintain robust supplier relationships and increase processing efficiency by 18%.

What are the market trends shaping the Trade Finance Industry?

  • The acceleration of digitalization and the adoption of electronic transferable records represent the upcoming market trend. This shift significantly enhances operational efficiency and reduces manual documentation costs.

  • The Trade Finance is characterized by a rapid shift toward automated B2B payment systems and digital working capital solutions. Businesses are increasingly adopting electronic transferable records and distributed registry tools to replace physical documentation. This digital migration has enhanced supply chain resilience by accelerating document verification and reducing transit delays by 40%.
  • The emergence of sustainable credit evaluation has also fueled the demand for sustainable trade finance and green trade finance products. Consequently, companies aligning with environmental social governance standards experience a 25% improvement in access to preferential borrowing rates. By leveraging application programming interfaces, financial institutions can embed these services, creating highly efficient digital trade ecosystems.
  • This trend ensures robust market activity while significantly lowering operational overhead by 15%.

What challenges does the Trade Finance Industry face during its growth?

  • The burden of regulatory compliance and the widespread de-risking phenomenon constitute significant challenges affecting industry growth and equitable liquidity access.

  • A significant challenge within the Trade Finance involves the growing burden of stringent anti-money laundering requirements and capital adequacy requirements. These complex regulatory frameworks compel financial institutions to implement costly digital identity systems, which have increased compliance overhead by 30%. This de-risking phenomenon disproportionately restricts trade credit insurance and pre-export financing facilities for mid-sized enterprises.
  • Furthermore, the lack of interoperability across documentary collections processing platforms hampers the broader adoption of straight-through processing and digital guarantee registries. Consequently, manual discrepancy checks still account for a 25% delay in transaction settlements compared to automated systems.
  • The limited availability of Sharia-compliant products and alternative credit providers further widens the financing gap, constraining the operational capacity of vulnerable suppliers within international commodity trade finance networks by 12%.

Exclusive Technavio Analysis on Customer Landscape

The trade finance market forecasting report includes the adoption lifecycle of the market, covering from the innovator’s stage to the laggard’s stage. It focuses on adoption rates in different regions based on penetration. Furthermore, the trade finance market report also includes key purchase criteria and drivers of price sensitivity to help companies evaluate and develop their market growth analysis strategies.
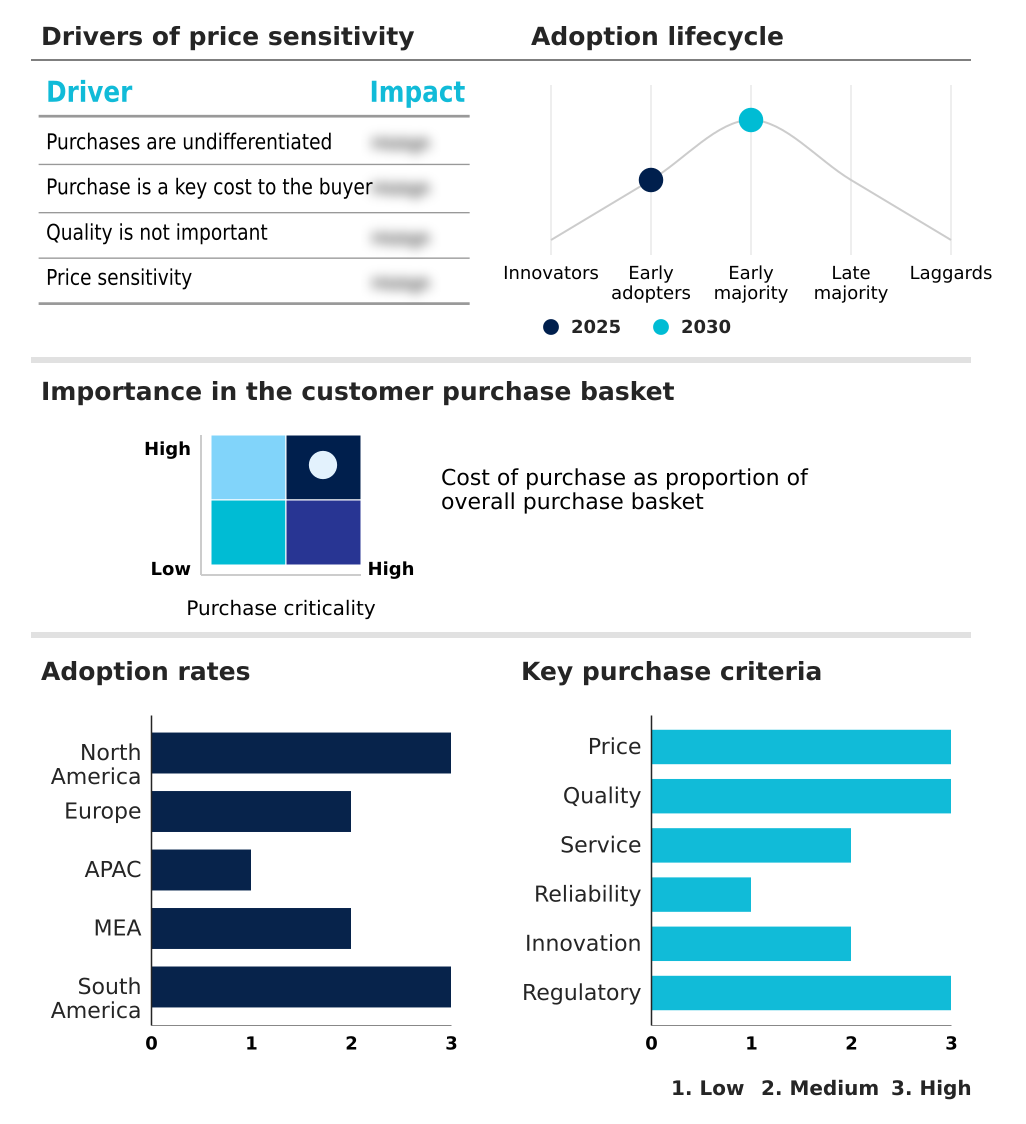
Customer Landscape of Trade Finance Industry

Competitive Landscape

Companies are implementing various strategies, such as strategic alliances, trade finance market forecast, partnerships, mergers and acquisitions, geographical expansion, and product/service launches, to enhance their presence in the industry.

Banco Santander SA - Offers comprehensive trade finance solutions, including import and export letters of credit, documentary collections, receivables finance, and supply chain finance to optimize global working capital operations.

The industry research and growth report includes detailed analyses of the competitive landscape of the market and information about key companies, including:

  • Banco Santander SA
  • Bank of America Corp.
  • Barclays PLC
  • BNP Paribas
  • China Systems Corp
  • Citigroup Inc.
  • DBS Group Holdings Ltd.
  • Deutsche Bank AG
  • Drip Capital Inc.
  • Finastra
  • HSBC Holdings Plc
  • JPMorgan Chase and Co.
  • Mitsubishi UFJ Financial Group
  • PrimeRevenue Inc.
  • Societe Generale SA
  • Standard Chartered PLC
  • Stenn International Ltd
  • Surecomp Inc.
  • UBS Group AG
  • Wells Fargo and Co.

Qualitative and quantitative analysis of companies has been conducted to help clients understand the wider business environment as well as the strengths and weaknesses of key industry players. Data is qualitatively analyzed to categorize companies as pure play, category-focused, industry-focused, and diversified; it is quantitatively analyzed to categorize companies as dominant, leading, strong, tentative, and weak.

Recent Development and News in Trade finance market

  • In the Diversified Financial Services industry, the accelerated integration of application programming interfaces has streamlined cross-border commercial transactions, directly impacting Trade Finance demand by reducing manual processing errors by 40%.
  • The widespread adoption of distributed registry tools for document verification has enhanced straight-through processing capabilities, significantly lowering compliance costs for digital trade ecosystems by 25%.
  • Stringent capital adequacy requirements and anti-money laundering requirements have prompted financial institutions to adopt automated credit scoring, improving risk assessment accuracy for supply chain finance by 30%.
  • The emergence of sustainable credit evaluation frameworks has incentivized the development of green trade finance, boosting the adoption of environmental social governance linked invoice financing platforms by over 20%.

Dive into Technavio’s robust research methodology, blending expert interviews, extensive data synthesis, and validated models for unparalleled Trade Finance Market insights. See full methodology.

Market Scope
Page number 325
Base year 2025
Historic period 2020-2024
Forecast period 2026-2030
Growth momentum & CAGR Accelerate at a CAGR of 5.7%
Market growth 2026-2030 USD 19394.8 million
Market structure Fragmented
YoY growth 2025-2026(%) 5.2%
Key countries US, Canada, Mexico, UK, Germany, France, The Netherlands, Italy, Spain, China, Japan, India, Singapore, South Korea, Australia, UAE, Saudi Arabia, South Africa, Israel, Egypt, Brazil, Chile and Argentina
Competitive landscape Leading Companies, Market Positioning of Companies, Competitive Strategies, and Industry Risks

Request Free Sample

Research Analyst Overview

  • The Trade Finance is undergoing a profound structural evolution driven by the necessity for greater supply chain resilience and automated liquidity management. Financial institutions are aggressively deploying predictive risk models and intelligent automation to streamline underwriting, which has successfully reduced manual processing errors by 30%.
  • This transition from legacy documentary collections processing to digital trade ecosystems is critical for modern corporate treasuries. Furthermore, the integration of environmental and social criteria into trade lending is reshaping product strategy. Banks are now linking preferential discount margins to verifiable sustainability metrics, incentivizing ethical sourcing.
  • The proliferation of electronic transferable records and character recognition technology accelerates straight-through processing, significantly lowering operational friction. Meanwhile, stringent anti-money laundering regulations and capital adequacy constraints continue to challenge market fluidity, forcing a reliance on robust digital identity verification.
  • Consequently, the adoption of dynamic discounting models and receivables discounting programs ensures that upstream suppliers receive timely non-recourse liquidity, solidifying the overarching stability and efficiency of global commercial exchanges.

What are the Key Data Covered in this Trade Finance Market Research and Growth Report?

  • What is the expected growth of the Trade Finance Market between 2026 and 2030?

    • USD 19.39 billion, at a CAGR of 5.7%

  • What segmentation does the market report cover?

    • The report is segmented by Type (Traditional trade finance, Supply chain finance, and Structured trade finance), End-user (Importers and exporters, Banks and financiers, and Insurers and ECAs), Product Type (Letters of credit, Supply chain finance, Trade credit insurance, Documentary collections, and Others), Business Segment (Domestic trade finance, and International trade finance) and Geography (North America, Europe, APAC, Middle East and Africa, South America)

  • Which regions are analyzed in the report?

    • North America, Europe, APAC, Middle East and Africa and South America

  • What are the key growth drivers and market challenges?

    • Integration of advanced digital technologies and blockchain systems, Burden of regulatory compliance and de-risking phenomenon

  • Who are the major players in the Trade Finance Market?

    • Banco Santander SA, Bank of America Corp., Barclays PLC, BNP Paribas, China Systems Corp, Citigroup Inc., DBS Group Holdings Ltd., Deutsche Bank AG, Drip Capital Inc., Finastra, HSBC Holdings Plc, JPMorgan Chase and Co., Mitsubishi UFJ Financial Group, PrimeRevenue Inc., Societe Generale SA, Standard Chartered PLC, Stenn International Ltd, Surecomp Inc., UBS Group AG and Wells Fargo and Co.

Market Research Insights

  • The Trade Finance Market relies heavily on cloud-native enterprise connectivity to optimize cross-border liquidity and secure commercial operations. By transitioning to digital trade processing, enterprises achieve a 30% reduction in transaction turnaround times, significantly improving supply chain resilience. Furthermore, the integration of algorithmic risk assessment allows financial institutions to identify potential fraud earlier, increasing compliance adherence by 22%.
  • The deployment of automated B2B payment systems and embedded finance solutions also reduces manual reconciliation costs by up to 18%. These measurable operational efficiency gains demonstrate how advanced risk mitigation instruments actively drive profitability and ensure continuous international commercial exchanges.

We can help! Our analysts can customize this trade finance market research report to meet your requirements.

Get in touch

1. Executive Summary

1.1 Market overview

Executive Summary - Chart on Market Overview
Executive Summary - Data Table on Market Overview
Executive Summary - Chart on Global Market Characteristics
Executive Summary - Chart on Market by Geography
Executive Summary - Chart on Market Segmentation by Type
Executive Summary - Chart on Market Segmentation by End-user
Executive Summary - Chart on Market Segmentation by Product Type
Executive Summary - Chart on Market Segmentation by Business Segment
Executive Summary - Chart on Incremental Growth
Executive Summary - Data Table on Incremental Growth
Executive Summary - Chart on Company Market Positioning

2. Technavio Analysis

2.1 Analysis of price sensitivity, lifecycle, customer purchase basket, adoption rates, and purchase criteria

2.2 Criticality of inputs and Factors of differentiation

Chart on Overview on criticality of inputs and factors of differentiation

2.3 Factors of disruption

Chart on Overview on factors of disruption

2.4 Impact of drivers and challenges

Chart on Impact of drivers and challenges in 2025 and 2030

3. Market Landscape

3.1 Market ecosystem

Chart on Parent Market
Data Table on - Parent Market

3.2 Market characteristics

Chart on Market characteristics analysis

3.3 Value chain analysis

Chart on Value chain analysis

4. Market Sizing

4.1 Market definition

Data Table on Offerings of companies included in the market definition

4.2 Market segment analysis

Market segments

4.3 Market size 2025

4.4 Market outlook: Forecast for 2025-2030

Chart on Global - Market size and forecast 2025-2030 ($ million)
Data Table on Global - Market size and forecast 2025-2030 ($ million)
Chart on Global Market: Year-over-year growth 2025-2030 (%)
Data Table on Global Market: Year-over-year growth 2025-2030 (%)

5. Historic Market Size

5.1 Global Trade Finance Market 2020 - 2024

Historic Market Size - Data Table on Global Trade Finance Market 2020 - 2024 ($ million)

5.2 Type segment analysis 2020 - 2024

Historic Market Size - Type Segment 2020 - 2024 ($ million)

5.3 End-user segment analysis 2020 - 2024

Historic Market Size - End-user Segment 2020 - 2024 ($ million)

5.4 Product Type segment analysis 2020 - 2024

Historic Market Size - Product Type Segment 2020 - 2024 ($ million)

5.5 Business segment analysis 2020 - 2024

Historic Market Size - Business Segment 2020 - 2024 ($ million)

5.6 Geography segment analysis 2020 - 2024

Historic Market Size - Geography Segment 2020 - 2024 ($ million)

5.7 Country segment analysis 2020 - 2024

Historic Market Size - Country Segment 2020 - 2024 ($ million)

6. Qualitative Analysis

6.1 Impact of AI on Global Trade Finance Market

6.2 Impact of Geopolitical Conflicts on Global Trade Finance Market

7. Five Forces Analysis

7.1 Five forces summary

Five forces analysis - Comparison between 2025 and 2030

7.2 Bargaining power of buyers

Bargaining power of buyers - Impact of key factors 2025 and 2030

7.3 Bargaining power of suppliers

Bargaining power of suppliers - Impact of key factors in 2025 and 2030

7.4 Threat of new entrants

Threat of new entrants - Impact of key factors in 2025 and 2030

7.5 Threat of substitutes

Threat of substitutes - Impact of key factors in 2025 and 2030

7.6 Threat of rivalry

Threat of rivalry - Impact of key factors in 2025 and 2030

7.7 Market condition

Chart on Market condition - Five forces 2025 and 2030

8. Market Segmentation by Type

8.1 Market segments

Chart on Type - Market share 2025-2030 (%)
Data Table on Type - Market share 2025-2030 (%)

8.2 Comparison by Type

Chart on Comparison by Type
Data Table on Comparison by Type

8.3 Traditional trade finance - Market size and forecast 2025-2030

Chart on Traditional trade finance - Market size and forecast 2025-2030 ($ million)
Data Table on Traditional trade finance - Market size and forecast 2025-2030 ($ million)
Chart on Traditional trade finance - Year-over-year growth 2025-2030 (%)
Data Table on Traditional trade finance - Year-over-year growth 2025-2030 (%)

8.4 Supply chain finance - Market size and forecast 2025-2030

Chart on Supply chain finance - Market size and forecast 2025-2030 ($ million)
Data Table on Supply chain finance - Market size and forecast 2025-2030 ($ million)
Chart on Supply chain finance - Year-over-year growth 2025-2030 (%)
Data Table on Supply chain finance - Year-over-year growth 2025-2030 (%)

8.5 Structured trade finance - Market size and forecast 2025-2030

Chart on Structured trade finance - Market size and forecast 2025-2030 ($ million)
Data Table on Structured trade finance - Market size and forecast 2025-2030 ($ million)
Chart on Structured trade finance - Year-over-year growth 2025-2030 (%)
Data Table on Structured trade finance - Year-over-year growth 2025-2030 (%)

8.6 Market opportunity by Type

Market opportunity by Type ($ million)
Data Table on Market opportunity by Type ($ million)

9. Market Segmentation by End-user

9.1 Market segments

Chart on End-user - Market share 2025-2030 (%)
Data Table on End-user - Market share 2025-2030 (%)

9.2 Comparison by End-user

Chart on Comparison by End-user
Data Table on Comparison by End-user

9.3 Importers and exporters - Market size and forecast 2025-2030

Chart on Importers and exporters - Market size and forecast 2025-2030 ($ million)
Data Table on Importers and exporters - Market size and forecast 2025-2030 ($ million)
Chart on Importers and exporters - Year-over-year growth 2025-2030 (%)
Data Table on Importers and exporters - Year-over-year growth 2025-2030 (%)

9.4 Banks and financiers - Market size and forecast 2025-2030

Chart on Banks and financiers - Market size and forecast 2025-2030 ($ million)
Data Table on Banks and financiers - Market size and forecast 2025-2030 ($ million)
Chart on Banks and financiers - Year-over-year growth 2025-2030 (%)
Data Table on Banks and financiers - Year-over-year growth 2025-2030 (%)

9.5 Insurers and ECAs - Market size and forecast 2025-2030

Chart on Insurers and ECAs - Market size and forecast 2025-2030 ($ million)
Data Table on Insurers and ECAs - Market size and forecast 2025-2030 ($ million)
Chart on Insurers and ECAs - Year-over-year growth 2025-2030 (%)
Data Table on Insurers and ECAs - Year-over-year growth 2025-2030 (%)

9.6 Market opportunity by End-user

Market opportunity by End-user ($ million)
Data Table on Market opportunity by End-user ($ million)

10. Market Segmentation by Product Type

10.1 Market segments

Chart on Product Type - Market share 2025-2030 (%)
Data Table on Product Type - Market share 2025-2030 (%)

10.2 Comparison by Product Type

Chart on Comparison by Product Type
Data Table on Comparison by Product Type

10.3 Letters of credit - Market size and forecast 2025-2030

Chart on Letters of credit - Market size and forecast 2025-2030 ($ million)
Data Table on Letters of credit - Market size and forecast 2025-2030 ($ million)
Chart on Letters of credit - Year-over-year growth 2025-2030 (%)
Data Table on Letters of credit - Year-over-year growth 2025-2030 (%)

10.4 Supply chain finance - Market size and forecast 2025-2030

Chart on Supply chain finance - Market size and forecast 2025-2030 ($ million)
Data Table on Supply chain finance - Market size and forecast 2025-2030 ($ million)
Chart on Supply chain finance - Year-over-year growth 2025-2030 (%)
Data Table on Supply chain finance - Year-over-year growth 2025-2030 (%)

10.5 Trade credit insurance - Market size and forecast 2025-2030

Chart on Trade credit insurance - Market size and forecast 2025-2030 ($ million)
Data Table on Trade credit insurance - Market size and forecast 2025-2030 ($ million)
Chart on Trade credit insurance - Year-over-year growth 2025-2030 (%)
Data Table on Trade credit insurance - Year-over-year growth 2025-2030 (%)

10.6 Documentary collections - Market size and forecast 2025-2030

Chart on Documentary collections - Market size and forecast 2025-2030 ($ million)
Data Table on Documentary collections - Market size and forecast 2025-2030 ($ million)
Chart on Documentary collections - Year-over-year growth 2025-2030 (%)
Data Table on Documentary collections - Year-over-year growth 2025-2030 (%)

10.7 Others - Market size and forecast 2025-2030

Chart on Others - Market size and forecast 2025-2030 ($ million)
Data Table on Others - Market size and forecast 2025-2030 ($ million)
Chart on Others - Year-over-year growth 2025-2030 (%)
Data Table on Others - Year-over-year growth 2025-2030 (%)

10.8 Market opportunity by Product Type

Market opportunity by Product Type ($ million)
Data Table on Market opportunity by Product Type ($ million)

11. Market Segmentation by Business Segment

11.1 Market segments

Chart on Market Segmentation by Business Segment - Market share 2025-2030 (%)
Data Table on Market Segmentation by Business Segment - Market share 2025-2030 (%)

11.2 Comparison by Market Segmentation by Business Segment

Chart on Comparison by Market Segmentation by Business Segment
Data Table on Comparison by Market Segmentation by Business Segment

11.3 Domestic trade finance - Market size and forecast 2025-2030

Chart on Domestic trade finance - Market size and forecast 2025-2030 ($ million)
Data Table on Domestic trade finance - Market size and forecast 2025-2030 ($ million)
Chart on Domestic trade finance - Year-over-year growth 2025-2030 (%)
Data Table on Domestic trade finance - Year-over-year growth 2025-2030 (%)

11.4 International trade finance - Market size and forecast 2025-2030

Chart on International trade finance - Market size and forecast 2025-2030 ($ million)
Data Table on International trade finance - Market size and forecast 2025-2030 ($ million)
Chart on International trade finance - Year-over-year growth 2025-2030 (%)
Data Table on International trade finance - Year-over-year growth 2025-2030 (%)

11.5 Market opportunity by Market Segmentation by Business Segment

Market opportunity by Market Segmentation by Business Segment ($ million)
Data Table on Market opportunity by Market Segmentation by Business Segment ($ million)

12. Customer Landscape

12.1 Customer landscape overview

Analysis of price sensitivity, lifecycle, customer purchase basket, adoption rates, and purchase criteria

13. Geographic Landscape

13.1 Geographic segmentation

Chart on Market share by geography 2025-2030 (%)
Data Table on Market share by geography 2025-2030 (%)

13.2 Geographic comparison

Chart on Geographic comparison
Data Table on Geographic comparison

13.3 North America - Market size and forecast 2025-2030

Chart on North America - Market size and forecast 2025-2030 ($ million)
Data Table on North America - Market size and forecast 2025-2030 ($ million)
Chart on North America - Year-over-year growth 2025-2030 (%)
Data Table on North America - Year-over-year growth 2025-2030 (%)
Chart on Regional Comparison - North America
Data Table on Regional Comparison - North America

13.3.1 US - Market size and forecast 2025-2030

Chart on US - Market size and forecast 2025-2030 ($ million)
Data Table on US - Market size and forecast 2025-2030 ($ million)
Chart on US - Year-over-year growth 2025-2030 (%)
Data Table on US - Year-over-year growth 2025-2030 (%)

13.3.2 Canada - Market size and forecast 2025-2030

Chart on Canada - Market size and forecast 2025-2030 ($ million)
Data Table on Canada - Market size and forecast 2025-2030 ($ million)
Chart on Canada - Year-over-year growth 2025-2030 (%)
Data Table on Canada - Year-over-year growth 2025-2030 (%)

13.3.3 Mexico - Market size and forecast 2025-2030

Chart on Mexico - Market size and forecast 2025-2030 ($ million)
Data Table on Mexico - Market size and forecast 2025-2030 ($ million)
Chart on Mexico - Year-over-year growth 2025-2030 (%)
Data Table on Mexico - Year-over-year growth 2025-2030 (%)

13.4 Europe - Market size and forecast 2025-2030

Chart on Europe - Market size and forecast 2025-2030 ($ million)
Data Table on Europe - Market size and forecast 2025-2030 ($ million)
Chart on Europe - Year-over-year growth 2025-2030 (%)
Data Table on Europe - Year-over-year growth 2025-2030 (%)
Chart on Regional Comparison - Europe
Data Table on Regional Comparison - Europe

13.4.1 UK - Market size and forecast 2025-2030

Chart on UK - Market size and forecast 2025-2030 ($ million)
Data Table on UK - Market size and forecast 2025-2030 ($ million)
Chart on UK - Year-over-year growth 2025-2030 (%)
Data Table on UK - Year-over-year growth 2025-2030 (%)

13.4.2 Germany - Market size and forecast 2025-2030

Chart on Germany - Market size and forecast 2025-2030 ($ million)
Data Table on Germany - Market size and forecast 2025-2030 ($ million)
Chart on Germany - Year-over-year growth 2025-2030 (%)
Data Table on Germany - Year-over-year growth 2025-2030 (%)

13.4.3 France - Market size and forecast 2025-2030

Chart on France - Market size and forecast 2025-2030 ($ million)
Data Table on France - Market size and forecast 2025-2030 ($ million)
Chart on France - Year-over-year growth 2025-2030 (%)
Data Table on France - Year-over-year growth 2025-2030 (%)

13.4.4 The Netherlands - Market size and forecast 2025-2030

Chart on The Netherlands - Market size and forecast 2025-2030 ($ million)
Data Table on The Netherlands - Market size and forecast 2025-2030 ($ million)
Chart on The Netherlands - Year-over-year growth 2025-2030 (%)
Data Table on The Netherlands - Year-over-year growth 2025-2030 (%)

13.4.5 Italy - Market size and forecast 2025-2030

Chart on Italy - Market size and forecast 2025-2030 ($ million)
Data Table on Italy - Market size and forecast 2025-2030 ($ million)
Chart on Italy - Year-over-year growth 2025-2030 (%)
Data Table on Italy - Year-over-year growth 2025-2030 (%)

13.4.6 Spain - Market size and forecast 2025-2030

Chart on Spain - Market size and forecast 2025-2030 ($ million)
Data Table on Spain - Market size and forecast 2025-2030 ($ million)
Chart on Spain - Year-over-year growth 2025-2030 (%)
Data Table on Spain - Year-over-year growth 2025-2030 (%)

13.5 APAC - Market size and forecast 2025-2030

Chart on APAC - Market size and forecast 2025-2030 ($ million)
Data Table on APAC - Market size and forecast 2025-2030 ($ million)
Chart on APAC - Year-over-year growth 2025-2030 (%)
Data Table on APAC - Year-over-year growth 2025-2030 (%)
Chart on Regional Comparison - APAC
Data Table on Regional Comparison - APAC

13.5.1 China - Market size and forecast 2025-2030

Chart on China - Market size and forecast 2025-2030 ($ million)
Data Table on China - Market size and forecast 2025-2030 ($ million)
Chart on China - Year-over-year growth 2025-2030 (%)
Data Table on China - Year-over-year growth 2025-2030 (%)

13.5.2 Japan - Market size and forecast 2025-2030

Chart on Japan - Market size and forecast 2025-2030 ($ million)
Data Table on Japan - Market size and forecast 2025-2030 ($ million)
Chart on Japan - Year-over-year growth 2025-2030 (%)
Data Table on Japan - Year-over-year growth 2025-2030 (%)

13.5.3 India - Market size and forecast 2025-2030

Chart on India - Market size and forecast 2025-2030 ($ million)
Data Table on India - Market size and forecast 2025-2030 ($ million)
Chart on India - Year-over-year growth 2025-2030 (%)
Data Table on India - Year-over-year growth 2025-2030 (%)

13.5.4 Singapore - Market size and forecast 2025-2030

Chart on Singapore - Market size and forecast 2025-2030 ($ million)
Data Table on Singapore - Market size and forecast 2025-2030 ($ million)
Chart on Singapore - Year-over-year growth 2025-2030 (%)
Data Table on Singapore - Year-over-year growth 2025-2030 (%)

13.5.5 South Korea - Market size and forecast 2025-2030

Chart on South Korea - Market size and forecast 2025-2030 ($ million)
Data Table on South Korea - Market size and forecast 2025-2030 ($ million)
Chart on South Korea - Year-over-year growth 2025-2030 (%)
Data Table on South Korea - Year-over-year growth 2025-2030 (%)

13.5.6 Australia - Market size and forecast 2025-2030

Chart on Australia - Market size and forecast 2025-2030 ($ million)
Data Table on Australia - Market size and forecast 2025-2030 ($ million)
Chart on Australia - Year-over-year growth 2025-2030 (%)
Data Table on Australia - Year-over-year growth 2025-2030 (%)

13.6 Middle East and Africa - Market size and forecast 2025-2030

Chart on Middle East and Africa - Market size and forecast 2025-2030 ($ million)
Data Table on Middle East and Africa - Market size and forecast 2025-2030 ($ million)
Chart on Middle East and Africa - Year-over-year growth 2025-2030 (%)
Data Table on Middle East and Africa - Year-over-year growth 2025-2030 (%)
Chart on Regional Comparison - Middle East and Africa
Data Table on Regional Comparison - Middle East and Africa

13.6.1 UAE - Market size and forecast 2025-2030

Chart on UAE - Market size and forecast 2025-2030 ($ million)
Data Table on UAE - Market size and forecast 2025-2030 ($ million)
Chart on UAE - Year-over-year growth 2025-2030 (%)
Data Table on UAE - Year-over-year growth 2025-2030 (%)

13.6.2 Saudi Arabia - Market size and forecast 2025-2030

Chart on Saudi Arabia - Market size and forecast 2025-2030 ($ million)
Data Table on Saudi Arabia - Market size and forecast 2025-2030 ($ million)
Chart on Saudi Arabia - Year-over-year growth 2025-2030 (%)
Data Table on Saudi Arabia - Year-over-year growth 2025-2030 (%)

13.6.3 South Africa - Market size and forecast 2025-2030

Chart on South Africa - Market size and forecast 2025-2030 ($ million)
Data Table on South Africa - Market size and forecast 2025-2030 ($ million)
Chart on South Africa - Year-over-year growth 2025-2030 (%)
Data Table on South Africa - Year-over-year growth 2025-2030 (%)

13.6.4 Israel - Market size and forecast 2025-2030

Chart on Israel - Market size and forecast 2025-2030 ($ million)
Data Table on Israel - Market size and forecast 2025-2030 ($ million)
Chart on Israel - Year-over-year growth 2025-2030 (%)
Data Table on Israel - Year-over-year growth 2025-2030 (%)

13.6.5 Egypt - Market size and forecast 2025-2030

Chart on Egypt - Market size and forecast 2025-2030 ($ million)
Data Table on Egypt - Market size and forecast 2025-2030 ($ million)
Chart on Egypt - Year-over-year growth 2025-2030 (%)
Data Table on Egypt - Year-over-year growth 2025-2030 (%)

13.7 South America - Market size and forecast 2025-2030

Chart on South America - Market size and forecast 2025-2030 ($ million)
Data Table on South America - Market size and forecast 2025-2030 ($ million)
Chart on South America - Year-over-year growth 2025-2030 (%)
Data Table on South America - Year-over-year growth 2025-2030 (%)
Chart on Regional Comparison - South America
Data Table on Regional Comparison - South America

13.7.1 Brazil - Market size and forecast 2025-2030

Chart on Brazil - Market size and forecast 2025-2030 ($ million)
Data Table on Brazil - Market size and forecast 2025-2030 ($ million)
Chart on Brazil - Year-over-year growth 2025-2030 (%)
Data Table on Brazil - Year-over-year growth 2025-2030 (%)

13.7.2 Chile - Market size and forecast 2025-2030

Chart on Chile - Market size and forecast 2025-2030 ($ million)
Data Table on Chile - Market size and forecast 2025-2030 ($ million)
Chart on Chile - Year-over-year growth 2025-2030 (%)
Data Table on Chile - Year-over-year growth 2025-2030 (%)

13.7.3 Argentina - Market size and forecast 2025-2030

Chart on Argentina - Market size and forecast 2025-2030 ($ million)
Data Table on Argentina - Market size and forecast 2025-2030 ($ million)
Chart on Argentina - Year-over-year growth 2025-2030 (%)
Data Table on Argentina - Year-over-year growth 2025-2030 (%)

13.8 Market opportunity by geography

Market opportunity by geography ($ million)
Data Tables on Market opportunity by geography ($ million)

14. Drivers, Challenges, and Opportunity

14.1 Market drivers

Integration of advanced digital technologies and blockchain systems
Expansion of emerging markets and new global trade corridors
Heightened focus on supply chain resilience and sustainable finance initiatives

14.2 Market challenges

Burden of regulatory compliance and de-risking phenomenon
Digital fragmentation and lack of interoperability
Persistent trade finance gap and inclusion hurdles for small and medium enterprises

14.3 Impact of drivers and challenges

Impact of drivers and challenges in 2025 and 2030

14.4 Market opportunities

Acceleration of digitalization and adoption of electronic transferable record
Proliferation of environmental, social, and governance linked trade finance
Emergence of trade finance as investable asset class for institutional investors

15. Competitive Landscape

15.1 Overview

15.2

Overview on criticality of inputs and factors of differentiation

15.3 Landscape disruption

Overview on factors of disruption

15.4 Industry risks

Impact of key risks on business

16. Competitive Analysis

16.1 Companies profiled

Companies covered

16.2 Company ranking index

16.3 Market positioning of companies

Matrix on companies position and classification

16.4 Banco Santander SA

Banco Santander SA - Overview
Banco Santander SA - Business segments
Banco Santander SA - Key offerings
Banco Santander SA - Segment focus
SWOT

16.5 Bank of America Corp.

Bank of America Corp. - Overview
Bank of America Corp. - Business segments
Bank of America Corp. - Key offerings
Bank of America Corp. - Segment focus
SWOT

16.6 Barclays PLC

Barclays PLC - Overview
Barclays PLC - Business segments
Barclays PLC - Key offerings
Barclays PLC - Segment focus
SWOT

16.7 BNP Paribas

BNP Paribas - Overview
BNP Paribas - Business segments
BNP Paribas - Key offerings
BNP Paribas - Segment focus
SWOT

16.8 Citigroup Inc.

Citigroup Inc. - Overview
Citigroup Inc. - Business segments
Citigroup Inc. - Key offerings
Citigroup Inc. - Segment focus
SWOT

16.9 DBS Group Holdings Ltd.

DBS Group Holdings Ltd. - Overview
DBS Group Holdings Ltd. - Business segments
DBS Group Holdings Ltd. - Key offerings
DBS Group Holdings Ltd. - Segment focus
SWOT

16.10 Deutsche Bank AG

Deutsche Bank AG - Overview
Deutsche Bank AG - Business segments
Deutsche Bank AG - Key offerings
Deutsche Bank AG - Segment focus
SWOT

16.11 Finastra

Finastra - Overview
Finastra - Product / Service
Finastra - Key offerings
SWOT

16.12 HSBC Holdings Plc

HSBC Holdings Plc - Overview
HSBC Holdings Plc - Business segments
HSBC Holdings Plc - Key offerings
HSBC Holdings Plc - Segment focus
SWOT

16.13 JPMorgan Chase and Co.

JPMorgan Chase and Co. - Overview
JPMorgan Chase and Co. - Business segments
JPMorgan Chase and Co. - Key offerings
JPMorgan Chase and Co. - Segment focus
SWOT

16.14 Mitsubishi UFJ Financial Group

Mitsubishi UFJ Financial Group - Overview
Mitsubishi UFJ Financial Group - Business segments
Mitsubishi UFJ Financial Group - Key offerings
Mitsubishi UFJ Financial Group - Segment focus
SWOT

16.15 Societe Generale SA

Societe Generale SA - Overview
Societe Generale SA - Business segments
Societe Generale SA - Key offerings
Societe Generale SA - Segment focus
SWOT

16.16 Standard Chartered PLC

Standard Chartered PLC - Overview
Standard Chartered PLC - Business segments
Standard Chartered PLC - Key offerings
Standard Chartered PLC - Segment focus
SWOT

16.17 UBS Group AG

UBS Group AG - Overview
UBS Group AG - Business segments
UBS Group AG - Key offerings
UBS Group AG - Segment focus
SWOT

16.18 Wells Fargo and Co.

Wells Fargo and Co. - Overview
Wells Fargo and Co. - Business segments
Wells Fargo and Co. - Key offerings
Wells Fargo and Co. - Segment focus
SWOT

17. Appendix

17.1 Scope of the report

Market definition
Objectives
Notes and caveats

17.2 Inclusions and exclusions checklist

Inclusions checklist
Exclusions checklist

17.3 Currency conversion rates for US$

17.4 Research methodology

17.5 Data procurement

Information sources

17.6 Data validation

17.7 Validation techniques employed for market sizing

17.8 Data synthesis

17.9 360 degree market analysis

17.10 List of abbreviations

Research Methodology

Technavio presents a detailed picture of the market by way of study, synthesis, and summation of data from multiple sources. The analysts have presented the various facets of the market with a particular focus on identifying the key industry influencers. The data thus presented is comprehensive, reliable, and the result of extensive research, both primary and secondary.

INFORMATION SOURCES

Primary sources

  • Manufacturers and suppliers
  • Channel partners
  • Industry experts
  • Strategic decision makers

Secondary sources

  • Industry journals and periodicals
  • Government data
  • Financial reports of key industry players
  • Historical data
  • Press releases

DATA ANALYSIS

Data Synthesis

  • Collation of data
  • Estimation of key figures
  • Analysis of derived insights

Data Validation

  • Triangulation with data models
  • Reference against proprietary databases
  • Corroboration with industry experts

REPORT WRITING

Qualitative

  • Market drivers
  • Market challenges
  • Market trends
  • Five forces analysis

Quantitative

  • Market size and forecast
  • Market segmentation
  • Geographical insights
  • Competitive landscape

Interested in this report?

Get your sample now to see our research methodology and insights!

Download Now

Frequently Asked Questions

Trade Finance market growth will increase by USD 19394.8 million during 2026-2030.

The Trade Finance market is expected to grow at a CAGR of 5.7% during 2026-2030.

Trade Finance market is segmented by Type (Traditional trade finance, Supply chain finance, Structured trade finance) End-user (Importers and exporters, Banks and financiers, Insurers and ECAs) Product type (Letters of credit, Supply chain finance, Trade credit insurance, Documentary collections, Others) Business segment (Domestic trade finance, International trade finance)

Banco Santander SA, Bank of America Corp., Barclays PLC, BNP Paribas, China Systems Corp, Citigroup Inc., DBS Group Holdings Ltd., Deutsche Bank AG, Drip Capital Inc., Finastra, HSBC Holdings Plc, JPMorgan Chase and Co., Mitsubishi UFJ Financial Group, PrimeRevenue Inc., Societe Generale SA, Standard Chartered PLC, Stenn International Ltd, Surecomp Inc., UBS Group AG, Wells Fargo and Co. are a few of the key vendors in the Trade Finance market.

APAC will register the highest growth rate of 36.6% among the other regions. Therefore, the Trade Finance market in APAC is expected to garner significant business opportunities for the vendors during the forecast period.

US, Canada, Mexico, UK, Germany, France, The Netherlands, Italy, Spain, China, Japan, India, Singapore, South Korea, Australia, UAE, Saudi Arabia, South Africa, Israel, Egypt, Brazil, Chile, Argentina

  • Integration of advanced digital technologies and blockchain systems is the driving factor this market.

The Trade Finance market vendors should focus on grabbing business opportunities from the Type segment as it accounted for the largest market share in the base year.
RIA - Research AI Assistant
Ask RIA
