
Transformer Core Market Analysis, Size, and Forecast 2026-2030: APAC (China, India, and Japan), Europe (Germany, Italy, and France), North America (US, Canada, and Mexico), Middle East and Africa (Saudi Arabia, UAE, and South Africa), South America (Brazil, Argentina, and Chile), and Rest of World (ROW)

Transformer Core Market Analysis, Size, and Forecast 2026-2030:
APAC (China, India, and Japan), Europe (Germany, Italy, and France), North America (US, Canada, and Mexico), Middle East and Africa (Saudi Arabia, UAE, and South Africa), South America (Brazil, Argentina, and Chile), and Rest of World (ROW)

Published: Oct 2026 310 Pages SKU: IRTNTR81610

Market Overview at a Glance

$3.54 B
Market Opportunity
5.9%
CAGR 2025 - 2030
52.9%
APAC Growth
$7.26 B
Cold rolled grain oriented steel segment 2024

Transformer Core Market Size 2026-2030

The transformer core market size is valued to increase by USD 3.54 billion, at a CAGR of 5.9% from 2025 to 2030. Accelerated global integration of renewable power generation sources will drive the transformer core market.

Major Market Trends & Insights

  • APAC dominated the market and accounted for a 52.9% growth during the forecast period.
  • By Material - Cold rolled grain oriented steel segment was valued at USD 7.26 billion in 2024
  • By Type - Distribution transformers segment accounted for the largest market revenue share in 2024

Market Size & Forecast

  • Market Opportunities: USD 5.86 billion
  • Market Future Opportunities: USD 3.54 billion
  • CAGR from 2025 to 2030 : 5.9%

Market Summary

  • The Transformer Core Market is experiencing a structural transformation driven by the modernization of aging utility grids and the integration of decentralized energy sources. The accelerated deployment of renewable energy requires highly adaptive electrical infrastructure, serving as a primary catalyst for demand.
  • For instance, utility providers engaged in long-distance offshore wind transmission are increasingly utilizing advanced amorphous metal alloys to reduce no-load energy dissipation. This material upgrade enables grid operators to realize a 25% improvement in base energy retention compared to legacy silicon materials. However, significant price volatility and procurement risks associated with high-grade electrical steel present a critical operational bottleneck.
  • Because metallurgical capacity remains highly concentrated, supply chain disruptions directly inflate capital expenditures for major infrastructure projects, thereby compressing manufacturer margins. Despite these structural challenges, the continuous deployment of smart grid monitoring technologies ensures that modern utility ecosystems can optimize load balancing and prevent catastrophic grid failures.
  • Advanced magnetic architectures remain fundamental to achieving decarbonization targets across heavy industrial and municipal power networks.

What will be the Size of the Transformer Core Market during the forecast period?
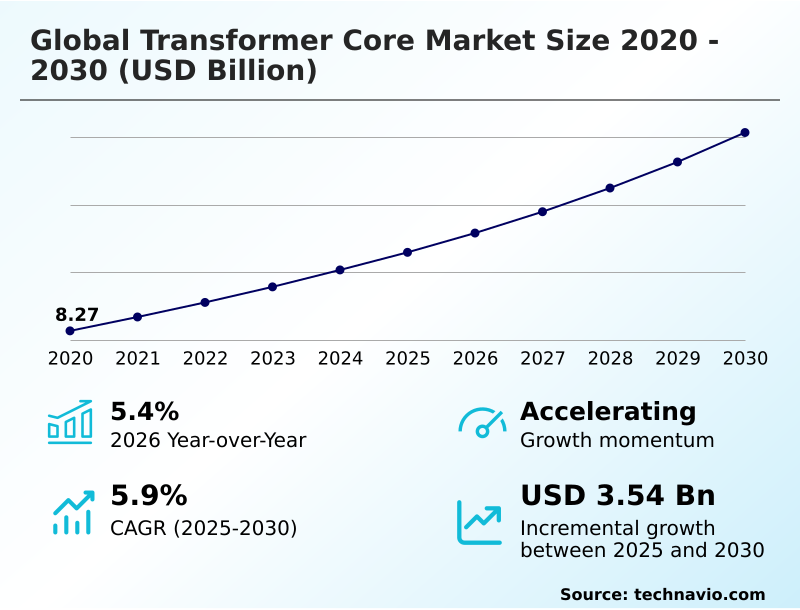
Get Key Insights on Market Forecast (PDF) Get Free Sample

How is the Transformer Core Market Segmented?

The transformer core industry research report provides comprehensive data (region-wise segment analysis), with forecasts and estimates in "USD million" for the period 2026-2030, as well as historical data from 2020-2024 for the following segments.

  • Material
    • Cold rolled grain oriented steel
    • Amorphous alloys
    • Cold rolled non-grain oriented steel
    • Others
  • Type
    • Distribution transformers
    • Power transformers
    • Dry-type transformers
    • Others
  • Application
    • Utility and grid
    • Industrial
    • Commercial and residential
    • Renewable energy integration
  • Geography
    • APAC
      • China
      • India
      • Japan
      • South Korea
      • Australia
      • Indonesia
    • Europe
      • Germany
      • Italy
      • France
      • UK
      • Spain
      • The Netherlands
    • North America
      • US
      • Canada
      • Mexico
    • Middle East and Africa
      • Saudi Arabia
      • UAE
      • South Africa
      • Egypt
      • Turkey
    • South America
      • Brazil
      • Argentina
      • Chile

By Material Insights

The cold rolled grain oriented steel segment is estimated to witness significant growth during the forecast period.

The cold-rolled silicon steel segment remains foundational to the market, driven by the critical need for power distribution efficiency across utility networks.

By utilizing step-lap core construction and highly controlled crystallographic textures, this material ensures exceptional magnetic permeability and precise magnetic flux density alignment. These properties directly facilitate hysteresis loss reduction, which improves continuous load performance and mitigates thermal dissipation.

As operators execute distribution substation upgrade projects, the integration of domain-refined steel has led to energy loss reductions exceeding 18% in high-capacity infrastructure. This material evolution directly supports grid decarbonization initiatives by minimizing energy waste during long-distance transmission.

Ultimately, the superior durability of grain-oriented electrical steel secures bidirectional power flow stability, satisfying stringent environmental regulations while delivering measurable operational cost savings for large-scale energy providers.
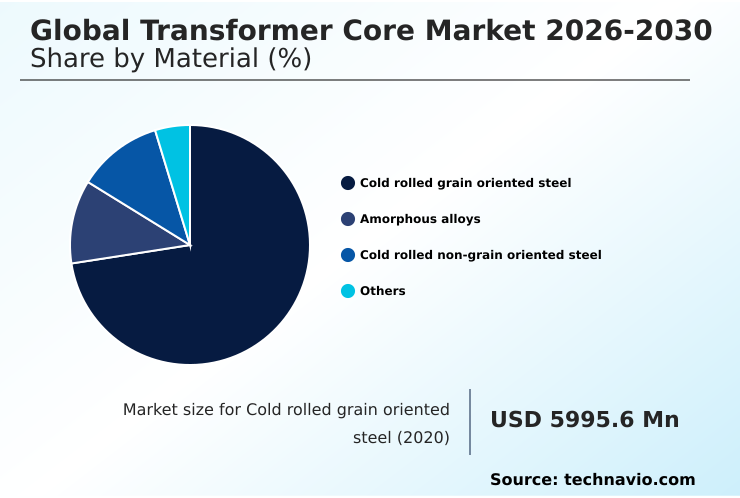
Get Free Sample

The Cold rolled grain oriented steel segment was valued at USD 7.26 billion in 2024 and showed a gradual increase during the forecast period.
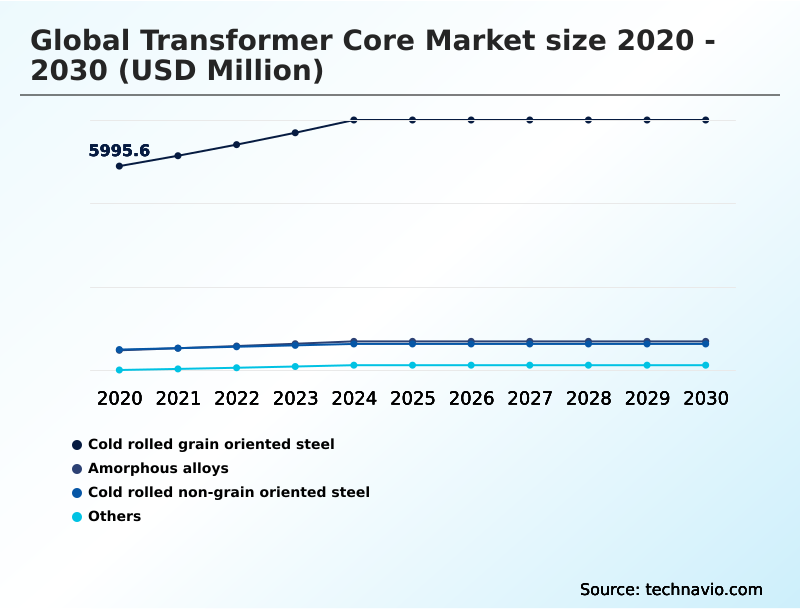
Get Free Sample

Regional Analysis

APAC is estimated to contribute 52.9% to the growth of the global market during the forecast period.Technavio’s analysts have elaborately explained the regional trends and drivers that shape the market during the forecast period.
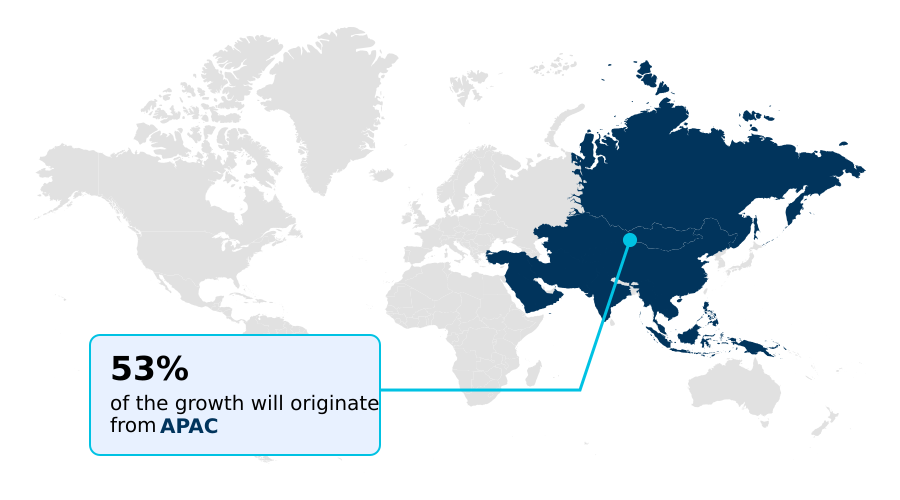
See How Transformer Core Market Demand is Rising in APAC Get Free Sample

The market dynamics across APAC and Europe reveal distinct strategic priorities fueled by differing regulatory and demographic pressures.

The rapid expansion of industrial automation power and rural electrification programs has established APAC as the dominant consumption center, where demand for transformer core lamination outpaces Western counterparts by nearly 40%.

Conversely, European utilities are aggressively enforcing circular economy recycling mandates, driving a 25% faster adoption rate of nanocrystalline core materials than in Asian markets.

This regional divergence highlights how APAC operators prioritize raw capacity expansion, whereas European stakeholders focus on carbon footprint minimization through advanced magnetostriction reduction technologies.

Consequently, APAC manufacturers are optimizing step-lap core construction to meet massive infrastructure volume requirements, while European entities invest heavily in predictive maintenance strategy integration to offset high localized labor costs and maintain long-term grid resilience hardening.

Market Dynamics

Our researchers analyzed the data with 2025 as the base year, along with the key drivers, trends, and challenges. A holistic analysis of drivers will help companies refine their marketing strategies to gain a competitive advantage.

  • The continuous evolution of the electrical distribution sector has placed significant emphasis on advanced material engineering to meet stringent regulatory standards. Utilities are actively exploring amorphous metal core loss reduction strategies to manage the continuous loads generated by renewable energy installations.
  • By transitioning away from conventional components, operators can effectively mitigate thermal waste, yielding efficiency improvements that surpass traditional benchmarks by nearly 30%. This shift profoundly impacts operational planning, as the optimized material performance inherently reduces the required physical footprint of municipal substations. Concurrently, engineers are closely evaluating grain-oriented steel permeability performance to ensure reliable high-voltage operations across long-distance transmission corridors.
  • The push for smarter networks has also accelerated the adoption of nanocrystalline alloy high frequency applications, enabling highly accurate monitoring systems that support dynamic load balancing. Maximizing transformer core magnetic flux density remains a pivotal concern for manufacturers seeking to minimize material usage while maintaining strict compliance with international energy directives.
  • Furthermore, optimizing grid modernization transmission infrastructure efficiency is critical to stabilizing the supply chain against fluctuating commodity prices. As energy demands grow, securing reliable access to these highly refined materials ensures that utility providers can continuously deliver robust, uninterrupted power while navigating an increasingly volatile global commodity landscape.
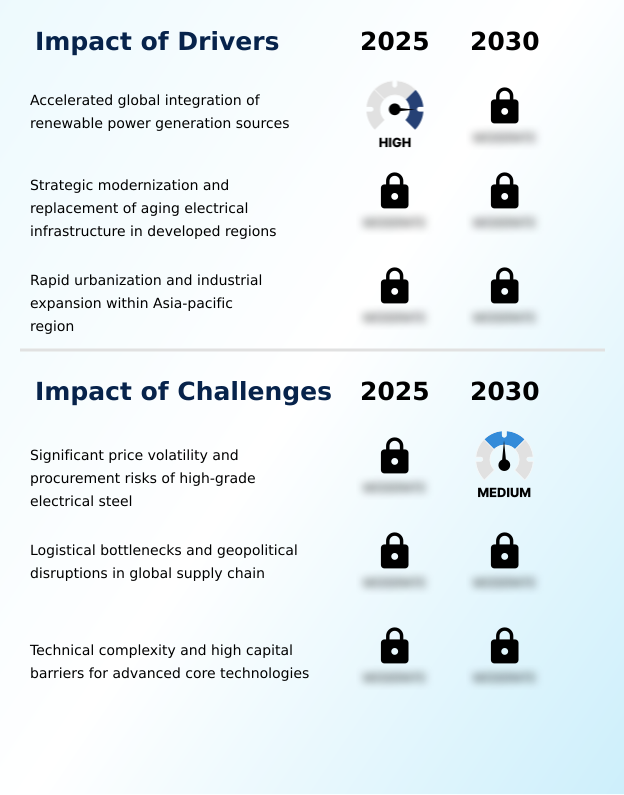
What are the key market drivers leading to the rise in the adoption of Transformer Core Industry?

  • The accelerated global integration of renewable power generation sources serves as a primary driver propelling continuous market expansion.

  • The rapid proliferation of specialized industrial sites and high-speed rail electrification acts as a formidable catalyst for structural market expansion. This momentum is driven by the physical necessity to transport vast quantities of power across remote and environmentally challenging terrains.
  • As a result, utility providers are aggressively deploying toroidal core geometry structures, which have improved mechanical resilience against heavy vibrations by nearly 18%. This robust engineering significantly decreases unplanned maintenance interventions, lowering lifetime operational costs by over 12%.
  • Furthermore, strict environmental mandates are driving the rapid adoption of no-load loss optimization protocols across municipal grids. By upgrading legacy systems, regional network operators effectively minimize ambient thermal emissions and ensure reliable power delivery for critical industrial applications.

What are the market trends shaping the Transformer Core Industry?

  • A rising preference for amorphous metal alloys is currently shaping high-efficiency distribution networks. This shift represents a defining market trend aimed at minimizing energy dissipation.

  • The market is experiencing a profound technological transition characterized by the integration of solid-state transformer tech to manage complex network grids. This trend is caused by the sudden influx of volatile renewable power, which compels utilities to deploy adaptive infrastructure capable of bidirectional load management.
  • Consequently, adopting these advanced architectures has improved grid response times by over 20% and reduced localized energy bottlenecks. Furthermore, the rising reliance on data center power infrastructure has catalyzed innovations in magnetic anisotropy control, allowing operators to lower facility cooling expenses by approximately 15%. This structural shift enables businesses to integrate microgrid power stability protocols without risking thermal overload.
  • As operators continue to implement rigorous energy transition policies, the deployment of highly efficient isotropic magnetic properties ensures that commercial networks can seamlessly sustain heavy digital workloads while achieving maximum asset utilization.

What challenges does the Transformer Core Industry face during its growth?

  • Significant price volatility and the procurement risks associated with high-grade electrical steel constitute major challenges hindering industry growth.

  • Material procurement volatility and complex metallurgical manufacturing barriers represent profound structural challenges for contemporary network developers. The fundamental cause of this constraint lies in the capital-intensive nature of producing premium metallic materials, which is currently dominated by a highly consolidated global supply chain.
  • Consequently, unexpected geopolitical trade frictions have extended equipment lead times by roughly 35%, forcing utility planners to delay critical infrastructure upgrades. Furthermore, engineering precise core clamping structures to endure extreme grid stress demands advanced, high-cost assembly techniques. This technical bottleneck has driven up initial capital expenditures for rural modernization programs by nearly 20%.
  • Navigating these severe material shortages requires operators to implement stringent utility procurement tenders, ultimately complicating long-term capacity planning and delaying broader sustainability initiatives.

Exclusive Technavio Analysis on Customer Landscape

The transformer core market forecasting report includes the adoption lifecycle of the market, covering from the innovator’s stage to the laggard’s stage. It focuses on adoption rates in different regions based on penetration. Furthermore, the transformer core market report also includes key purchase criteria and drivers of price sensitivity to help companies evaluate and develop their market growth analysis strategies.
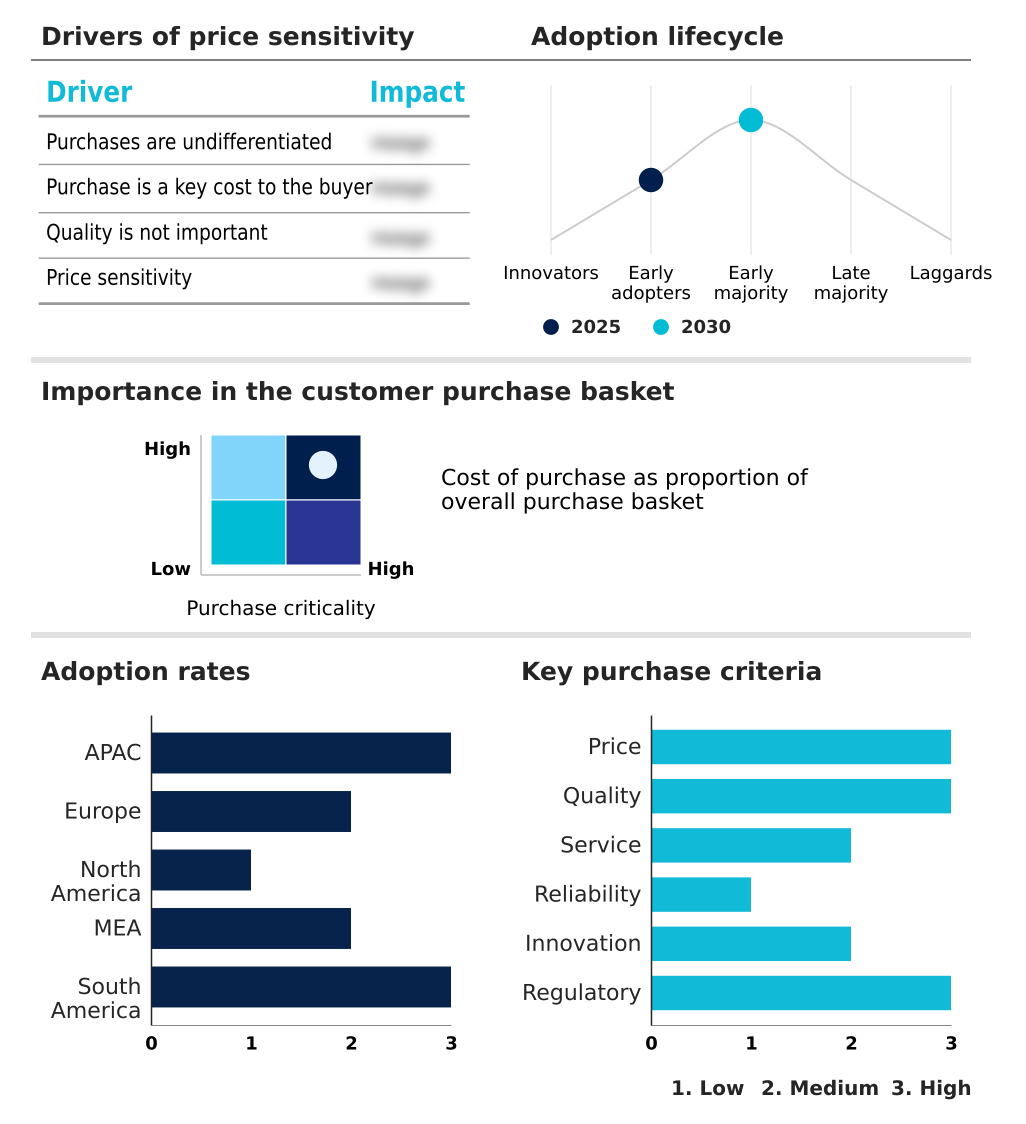
Customer Landscape of Transformer Core Industry

Competitive Landscape

Companies are implementing various strategies, such as strategic alliances, transformer core market forecast, partnerships, mergers and acquisitions, geographical expansion, and product/service launches, to enhance their presence in the industry.

Arnold Magnetic Tech. - The manufacturer provides custom-engineered magnetic assemblies and precision-cut laminated components designed to maximize energy throughput and minimize operational transmission losses for heavy industrial applications.

The industry research and growth report includes detailed analyses of the competitive landscape of the market and information about key companies, including:

  • Arnold Magnetic Tech.
  • Corefficient
  • CorePower Magnetics
  • Eilor Magnetic Cores
  • ENPAY Endustriyel Pazarlama
  • Fair Rite Products Corp.
  • Ferroxcube
  • JFE Shoji Power Canada Inc.
  • KRYFS Power Components Ltd.
  • Legnano Teknoelectrica Co
  • Magnetic Metals Corp
  • MK Magnetics Inc.
  • Nomax Electrical Steel Pvt. Ltd.
  • POWERCORE INDS INDIA PVT. LTD.
  • Proterial Ltd.
  • TDK Corp.
  • Tempel Steel Co LLC
  • Triad Magnetics
  • Vacuumschmelze GmbH and Co. KG
  • Vilas Transcore Ltd.

Qualitative and quantitative analysis of companies has been conducted to help clients understand the wider business environment as well as the strengths and weaknesses of key industry players. Data is qualitatively analyzed to categorize companies as pure play, category-focused, industry-focused, and diversified; it is quantitatively analyzed to categorize companies as dominant, leading, strong, tentative, and weak.

Recent Development and News in Transformer core market

  • In the Heavy Electrical Equipment industry, the rapid deployment of decentralized energy generation infrastructure has necessitated robust power distribution technology, directly impacting Transformer Core demand by requiring materials that can withstand volatile load fluctuations.
  • Stringent grid modernization mandates have forced the phase-out of legacy grid components, driving a structural shift toward advanced metal alloys that reduce no-load energy dissipation by up to thirty percent in regional distribution networks.
  • The acceleration of offshore wind power hubs has created severe operational requirements for sub-arctic climate durability and marine resistance, thereby increasing the procurement of highly specialized epoxy resin encapsulation for internal magnetic assemblies.
  • Geopolitical supply chain regionalization efforts have restructured the sourcing of critical metallurgical inputs, leading to localized investments in green steel production that subsequently alter the pricing models and availability of premium magnetic components.

Dive into Technavio’s robust research methodology, blending expert interviews, extensive data synthesis, and validated models for unparalleled Transformer Core Market insights. See full methodology.

Market Scope
Page number 310
Base year 2025
Historic period 2020-2024
Forecast period 2026-2030
Growth momentum & CAGR Accelerate at a CAGR of 5.9%
Market growth 2026-2030 USD 3537.1 million
Market structure Fragmented
YoY growth 2025-2026(%) 5.4%
Key countries China, India, Japan, South Korea, Australia, Indonesia, Germany, Italy, France, UK, Spain, The Netherlands, US, Canada, Mexico, Saudi Arabia, UAE, South Africa, Egypt, Turkey, Brazil, Argentina and Chile
Competitive landscape Leading Companies, Market Positioning of Companies, Competitive Strategies, and Industry Risks

Request Free Sample

Research Analyst Overview

  • The fundamental architecture of magnetic frameworks is rapidly evolving to address the extreme physical demands of contemporary power networks. Strategic decision-making in utility boardrooms is increasingly influenced by the need to minimize transmission waste, driving a massive transition toward advanced eddy current mitigation techniques.
  • This technological pivot enables facility operators to achieve a 20% reduction in long-term maintenance expenditures, directly impacting operational budgeting. Integrating core-sense diagnostics into heavy-duty infrastructure allows operators to monitor interlaminar insulation breakdown in real-time, averting catastrophic asset failures.
  • Furthermore, the adoption of fiber-optic thermal probes supports continuous asset visibility, ensuring that components remain within safe operating thresholds even under volatile load profiles. The demand for highly specialized high-frequency magnetic components is reshaping product strategy, as industrial consumers require robust solutions to power advanced manufacturing equipment.
  • By utilizing metallic glass ribbon in compact distribution units, operators can significantly optimize spatial planning in dense urban centers. Ultimately, these targeted material and diagnostic upgrades ensure that utility networks maintain uncompromised reliability and operational safety.

What are the Key Data Covered in this Transformer Core Market Research and Growth Report?

  • What is the expected growth of the Transformer Core Market between 2026 and 2030?

    • USD 3.54 billion, at a CAGR of 5.9%

  • What segmentation does the market report cover?

    • The report is segmented by Material (Cold rolled grain oriented steel, Amorphous alloys, Cold rolled non-grain oriented steel, and Others), Type (Distribution transformers, Power transformers, Dry-type transformers, and Others), Application (Utility and grid, Industrial, Commercial and residential, and Renewable energy integration) and Geography (APAC, Europe, North America, Middle East and Africa, South America)

  • Which regions are analyzed in the report?

    • APAC, Europe, North America, Middle East and Africa and South America

  • What are the key growth drivers and market challenges?

    • Accelerated global integration of renewable power generation sources, Significant price volatility and procurement risks of high-grade electrical steel

  • Who are the major players in the Transformer Core Market?

    • Arnold Magnetic Tech., Corefficient, CorePower Magnetics, Eilor Magnetic Cores, ENPAY Endustriyel Pazarlama, Fair Rite Products Corp., Ferroxcube, JFE Shoji Power Canada Inc., KRYFS Power Components Ltd., Legnano Teknoelectrica Co, Magnetic Metals Corp, MK Magnetics Inc., Nomax Electrical Steel Pvt. Ltd., POWERCORE INDS INDIA PVT. LTD., Proterial Ltd., TDK Corp., Tempel Steel Co LLC, Triad Magnetics, Vacuumschmelze GmbH and Co. KG and Vilas Transcore Ltd.

Market Research Insights

  • The transition toward ultra-high-voltage transmission is fundamentally restructuring the market as utilities optimize renewable energy grid integration. To support electric vehicle charging networks, operators are replacing aging units with ultra-low-loss core architectures, achieving a 30% reduction in thermal energy waste and generating measurable operational cost savings.
  • Furthermore, integrating smart grid deployment frameworks allows network managers to extend asset lifecycles by up to 15%, reducing unplanned outages and supporting broader strategic infrastructure initiatives. These technological advancements ensure that distribution networks maintain voltage stability under volatile loads, enabling municipalities to secure strict environmental compliance while navigating the complex physical requirements of modern utility environments.

We can help! Our analysts can customize this transformer core market research report to meet your requirements.

Get in touch

1. Executive Summary

1.1 Market overview

Executive Summary - Chart on Market Overview
Executive Summary - Data Table on Market Overview
Executive Summary - Chart on Global Market Characteristics
Executive Summary - Chart on Market by Geography
Executive Summary - Chart on Market Segmentation by Material
Executive Summary - Chart on Market Segmentation by Type
Executive Summary - Chart on Market Segmentation by Application
Executive Summary - Chart on Incremental Growth
Executive Summary - Data Table on Incremental Growth
Executive Summary - Chart on Company Market Positioning

2. Technavio Analysis

2.1 Analysis of price sensitivity, lifecycle, customer purchase basket, adoption rates, and purchase criteria

2.2 Criticality of inputs and Factors of differentiation

Chart on Overview on criticality of inputs and factors of differentiation

2.3 Factors of disruption

Chart on Overview on factors of disruption

2.4 Impact of drivers and challenges

Chart on Impact of drivers and challenges in 2025 and 2030

3. Market Landscape

3.1 Market ecosystem

Chart on Parent Market
Data Table on - Parent Market

3.2 Market characteristics

Chart on Market characteristics analysis

3.3 Value chain analysis

Chart on Value chain analysis

4. Market Sizing

4.1 Market definition

Data Table on Offerings of companies included in the market definition

4.2 Market segment analysis

Market segments

4.3 Market size 2025

4.4 Market outlook: Forecast for 2025-2030

Chart on Global - Market size and forecast 2025-2030 ($ million)
Data Table on Global - Market size and forecast 2025-2030 ($ million)
Chart on Global Market: Year-over-year growth 2025-2030 (%)
Data Table on Global Market: Year-over-year growth 2025-2030 (%)

5. Historic Market Size

5.1 Global Transformer Core Market 2020 - 2024

Historic Market Size - Data Table on Global Transformer Core Market 2020 - 2024 ($ million)

5.2 Material segment analysis 2020 - 2024

Historic Market Size - Material Segment 2020 - 2024 ($ million)

5.3 Type segment analysis 2020 - 2024

Historic Market Size - Type Segment 2020 - 2024 ($ million)

5.4 Application segment analysis 2020 - 2024

Historic Market Size - Application Segment 2020 - 2024 ($ million)

5.5 Geography segment analysis 2020 - 2024

Historic Market Size - Geography Segment 2020 - 2024 ($ million)

5.6 Country segment analysis 2020 - 2024

Historic Market Size - Country Segment 2020 - 2024 ($ million)

6. Qualitative Analysis

6.1 Impact of AI on Global Transformer Core Market

6.2 Impact of geopolitical conflicts on Global Transformer Core Market

7. Five Forces Analysis

7.1 Five forces summary

Five forces analysis - Comparison between 2025 and 2030

7.2 Bargaining power of buyers

Bargaining power of buyers - Impact of key factors 2025 and 2030

7.3 Bargaining power of suppliers

Bargaining power of suppliers - Impact of key factors in 2025 and 2030

7.4 Threat of new entrants

Threat of new entrants - Impact of key factors in 2025 and 2030

7.5 Threat of substitutes

Threat of substitutes - Impact of key factors in 2025 and 2030

7.6 Threat of rivalry

Threat of rivalry - Impact of key factors in 2025 and 2030

7.7 Market condition

Chart on Market condition - Five forces 2025 and 2030

8. Market Segmentation by Material

8.1 Market segments

Chart on Material - Market share 2025-2030 (%)
Data Table on Material - Market share 2025-2030 (%)

8.2 Comparison by Material

Chart on Comparison by Material
Data Table on Comparison by Material

8.3 Cold rolled grain oriented steel - Market size and forecast 2025-2030

Chart on Cold rolled grain oriented steel - Market size and forecast 2025-2030 ($ million)
Data Table on Cold rolled grain oriented steel - Market size and forecast 2025-2030 ($ million)
Chart on Cold rolled grain oriented steel - Year-over-year growth 2025-2030 (%)
Data Table on Cold rolled grain oriented steel - Year-over-year growth 2025-2030 (%)

8.4 Amorphous alloys - Market size and forecast 2025-2030

Chart on Amorphous alloys - Market size and forecast 2025-2030 ($ million)
Data Table on Amorphous alloys - Market size and forecast 2025-2030 ($ million)
Chart on Amorphous alloys - Year-over-year growth 2025-2030 (%)
Data Table on Amorphous alloys - Year-over-year growth 2025-2030 (%)

8.5 Cold rolled non-grain oriented steel - Market size and forecast 2025-2030

Chart on Cold rolled non-grain oriented steel - Market size and forecast 2025-2030 ($ million)
Data Table on Cold rolled non-grain oriented steel - Market size and forecast 2025-2030 ($ million)
Chart on Cold rolled non-grain oriented steel - Year-over-year growth 2025-2030 (%)
Data Table on Cold rolled non-grain oriented steel - Year-over-year growth 2025-2030 (%)

8.6 Others - Market size and forecast 2025-2030

Chart on Others - Market size and forecast 2025-2030 ($ million)
Data Table on Others - Market size and forecast 2025-2030 ($ million)
Chart on Others - Year-over-year growth 2025-2030 (%)
Data Table on Others - Year-over-year growth 2025-2030 (%)

8.7 Market opportunity by Material

Market opportunity by Material ($ million)
Data Table on Market opportunity by Material ($ million)

9. Market Segmentation by Type

9.1 Market segments

Chart on Type - Market share 2025-2030 (%)
Data Table on Type - Market share 2025-2030 (%)

9.2 Comparison by Type

Chart on Comparison by Type
Data Table on Comparison by Type

9.3 Distribution transformers - Market size and forecast 2025-2030

Chart on Distribution transformers - Market size and forecast 2025-2030 ($ million)
Data Table on Distribution transformers - Market size and forecast 2025-2030 ($ million)
Chart on Distribution transformers - Year-over-year growth 2025-2030 (%)
Data Table on Distribution transformers - Year-over-year growth 2025-2030 (%)

9.4 Power transformers - Market size and forecast 2025-2030

Chart on Power transformers - Market size and forecast 2025-2030 ($ million)
Data Table on Power transformers - Market size and forecast 2025-2030 ($ million)
Chart on Power transformers - Year-over-year growth 2025-2030 (%)
Data Table on Power transformers - Year-over-year growth 2025-2030 (%)

9.5 Dry-type transformers - Market size and forecast 2025-2030

Chart on Dry-type transformers - Market size and forecast 2025-2030 ($ million)
Data Table on Dry-type transformers - Market size and forecast 2025-2030 ($ million)
Chart on Dry-type transformers - Year-over-year growth 2025-2030 (%)
Data Table on Dry-type transformers - Year-over-year growth 2025-2030 (%)

9.6 Others - Market size and forecast 2025-2030

Chart on Others - Market size and forecast 2025-2030 ($ million)
Data Table on Others - Market size and forecast 2025-2030 ($ million)
Chart on Others - Year-over-year growth 2025-2030 (%)
Data Table on Others - Year-over-year growth 2025-2030 (%)

9.7 Market opportunity by Type

Market opportunity by Type ($ million)
Data Table on Market opportunity by Type ($ million)

10. Market Segmentation by Application

10.1 Market segments

Chart on Application - Market share 2025-2030 (%)
Data Table on Application - Market share 2025-2030 (%)

10.2 Comparison by Application

Chart on Comparison by Application
Data Table on Comparison by Application

10.3 Utility and grid - Market size and forecast 2025-2030

Chart on Utility and grid - Market size and forecast 2025-2030 ($ million)
Data Table on Utility and grid - Market size and forecast 2025-2030 ($ million)
Chart on Utility and grid - Year-over-year growth 2025-2030 (%)
Data Table on Utility and grid - Year-over-year growth 2025-2030 (%)

10.4 Industrial - Market size and forecast 2025-2030

Chart on Industrial - Market size and forecast 2025-2030 ($ million)
Data Table on Industrial - Market size and forecast 2025-2030 ($ million)
Chart on Industrial - Year-over-year growth 2025-2030 (%)
Data Table on Industrial - Year-over-year growth 2025-2030 (%)

10.5 Commercial and residential - Market size and forecast 2025-2030

Chart on Commercial and residential - Market size and forecast 2025-2030 ($ million)
Data Table on Commercial and residential - Market size and forecast 2025-2030 ($ million)
Chart on Commercial and residential - Year-over-year growth 2025-2030 (%)
Data Table on Commercial and residential - Year-over-year growth 2025-2030 (%)

10.6 Renewable energy integration - Market size and forecast 2025-2030

Chart on Renewable energy integration - Market size and forecast 2025-2030 ($ million)
Data Table on Renewable energy integration - Market size and forecast 2025-2030 ($ million)
Chart on Renewable energy integration - Year-over-year growth 2025-2030 (%)
Data Table on Renewable energy integration - Year-over-year growth 2025-2030 (%)

10.7 Market opportunity by Application

Market opportunity by Application ($ million)
Data Table on Market opportunity by Application ($ million)

11. Customer Landscape

11.1 Customer landscape overview

Analysis of price sensitivity, lifecycle, customer purchase basket, adoption rates, and purchase criteria

12. Geographic Landscape

12.1 Geographic segmentation

Chart on Market share by geography 2025-2030 (%)
Data Table on Market share by geography 2025-2030 (%)

12.2 Geographic comparison

Chart on Geographic comparison
Data Table on Geographic comparison

12.3 APAC - Market size and forecast 2025-2030

Chart on APAC - Market size and forecast 2025-2030 ($ million)
Data Table on APAC - Market size and forecast 2025-2030 ($ million)
Chart on APAC - Year-over-year growth 2025-2030 (%)
Data Table on APAC - Year-over-year growth 2025-2030 (%)
Chart on Regional Comparison - APAC
Data Table on Regional Comparison - APAC

12.3.1 China - Market size and forecast 2025-2030

Chart on China - Market size and forecast 2025-2030 ($ million)
Data Table on China - Market size and forecast 2025-2030 ($ million)
Chart on China - Year-over-year growth 2025-2030 (%)
Data Table on China - Year-over-year growth 2025-2030 (%)

12.3.2 India - Market size and forecast 2025-2030

Chart on India - Market size and forecast 2025-2030 ($ million)
Data Table on India - Market size and forecast 2025-2030 ($ million)
Chart on India - Year-over-year growth 2025-2030 (%)
Data Table on India - Year-over-year growth 2025-2030 (%)

12.3.3 Japan - Market size and forecast 2025-2030

Chart on Japan - Market size and forecast 2025-2030 ($ million)
Data Table on Japan - Market size and forecast 2025-2030 ($ million)
Chart on Japan - Year-over-year growth 2025-2030 (%)
Data Table on Japan - Year-over-year growth 2025-2030 (%)

12.3.4 South Korea - Market size and forecast 2025-2030

Chart on South Korea - Market size and forecast 2025-2030 ($ million)
Data Table on South Korea - Market size and forecast 2025-2030 ($ million)
Chart on South Korea - Year-over-year growth 2025-2030 (%)
Data Table on South Korea - Year-over-year growth 2025-2030 (%)

12.3.5 Australia - Market size and forecast 2025-2030

Chart on Australia - Market size and forecast 2025-2030 ($ million)
Data Table on Australia - Market size and forecast 2025-2030 ($ million)
Chart on Australia - Year-over-year growth 2025-2030 (%)
Data Table on Australia - Year-over-year growth 2025-2030 (%)

12.3.6 Indonesia - Market size and forecast 2025-2030

Chart on Indonesia - Market size and forecast 2025-2030 ($ million)
Data Table on Indonesia - Market size and forecast 2025-2030 ($ million)
Chart on Indonesia - Year-over-year growth 2025-2030 (%)
Data Table on Indonesia - Year-over-year growth 2025-2030 (%)

12.4 Europe - Market size and forecast 2025-2030

Chart on Europe - Market size and forecast 2025-2030 ($ million)
Data Table on Europe - Market size and forecast 2025-2030 ($ million)
Chart on Europe - Year-over-year growth 2025-2030 (%)
Data Table on Europe - Year-over-year growth 2025-2030 (%)
Chart on Regional Comparison - Europe
Data Table on Regional Comparison - Europe

12.4.1 Germany - Market size and forecast 2025-2030

Chart on Germany - Market size and forecast 2025-2030 ($ million)
Data Table on Germany - Market size and forecast 2025-2030 ($ million)
Chart on Germany - Year-over-year growth 2025-2030 (%)
Data Table on Germany - Year-over-year growth 2025-2030 (%)

12.4.2 Italy - Market size and forecast 2025-2030

Chart on Italy - Market size and forecast 2025-2030 ($ million)
Data Table on Italy - Market size and forecast 2025-2030 ($ million)
Chart on Italy - Year-over-year growth 2025-2030 (%)
Data Table on Italy - Year-over-year growth 2025-2030 (%)

12.4.3 France - Market size and forecast 2025-2030

Chart on France - Market size and forecast 2025-2030 ($ million)
Data Table on France - Market size and forecast 2025-2030 ($ million)
Chart on France - Year-over-year growth 2025-2030 (%)
Data Table on France - Year-over-year growth 2025-2030 (%)

12.4.4 UK - Market size and forecast 2025-2030

Chart on UK - Market size and forecast 2025-2030 ($ million)
Data Table on UK - Market size and forecast 2025-2030 ($ million)
Chart on UK - Year-over-year growth 2025-2030 (%)
Data Table on UK - Year-over-year growth 2025-2030 (%)

12.4.5 Spain - Market size and forecast 2025-2030

Chart on Spain - Market size and forecast 2025-2030 ($ million)
Data Table on Spain - Market size and forecast 2025-2030 ($ million)
Chart on Spain - Year-over-year growth 2025-2030 (%)
Data Table on Spain - Year-over-year growth 2025-2030 (%)

12.4.6 The Netherlands - Market size and forecast 2025-2030

Chart on The Netherlands - Market size and forecast 2025-2030 ($ million)
Data Table on The Netherlands - Market size and forecast 2025-2030 ($ million)
Chart on The Netherlands - Year-over-year growth 2025-2030 (%)
Data Table on The Netherlands - Year-over-year growth 2025-2030 (%)

12.5 North America - Market size and forecast 2025-2030

Chart on North America - Market size and forecast 2025-2030 ($ million)
Data Table on North America - Market size and forecast 2025-2030 ($ million)
Chart on North America - Year-over-year growth 2025-2030 (%)
Data Table on North America - Year-over-year growth 2025-2030 (%)
Chart on Regional Comparison - North America
Data Table on Regional Comparison - North America

12.5.1 US - Market size and forecast 2025-2030

Chart on US - Market size and forecast 2025-2030 ($ million)
Data Table on US - Market size and forecast 2025-2030 ($ million)
Chart on US - Year-over-year growth 2025-2030 (%)
Data Table on US - Year-over-year growth 2025-2030 (%)

12.5.2 Canada - Market size and forecast 2025-2030

Chart on Canada - Market size and forecast 2025-2030 ($ million)
Data Table on Canada - Market size and forecast 2025-2030 ($ million)
Chart on Canada - Year-over-year growth 2025-2030 (%)
Data Table on Canada - Year-over-year growth 2025-2030 (%)

12.5.3 Mexico - Market size and forecast 2025-2030

Chart on Mexico - Market size and forecast 2025-2030 ($ million)
Data Table on Mexico - Market size and forecast 2025-2030 ($ million)
Chart on Mexico - Year-over-year growth 2025-2030 (%)
Data Table on Mexico - Year-over-year growth 2025-2030 (%)

12.6 Middle East and Africa - Market size and forecast 2025-2030

Chart on Middle East and Africa - Market size and forecast 2025-2030 ($ million)
Data Table on Middle East and Africa - Market size and forecast 2025-2030 ($ million)
Chart on Middle East and Africa - Year-over-year growth 2025-2030 (%)
Data Table on Middle East and Africa - Year-over-year growth 2025-2030 (%)
Chart on Regional Comparison - Middle East and Africa
Data Table on Regional Comparison - Middle East and Africa

12.6.1 Saudi Arabia - Market size and forecast 2025-2030

Chart on Saudi Arabia - Market size and forecast 2025-2030 ($ million)
Data Table on Saudi Arabia - Market size and forecast 2025-2030 ($ million)
Chart on Saudi Arabia - Year-over-year growth 2025-2030 (%)
Data Table on Saudi Arabia - Year-over-year growth 2025-2030 (%)

12.6.2 UAE - Market size and forecast 2025-2030

Chart on UAE - Market size and forecast 2025-2030 ($ million)
Data Table on UAE - Market size and forecast 2025-2030 ($ million)
Chart on UAE - Year-over-year growth 2025-2030 (%)
Data Table on UAE - Year-over-year growth 2025-2030 (%)

12.6.3 South Africa - Market size and forecast 2025-2030

Chart on South Africa - Market size and forecast 2025-2030 ($ million)
Data Table on South Africa - Market size and forecast 2025-2030 ($ million)
Chart on South Africa - Year-over-year growth 2025-2030 (%)
Data Table on South Africa - Year-over-year growth 2025-2030 (%)

12.6.4 Egypt - Market size and forecast 2025-2030

Chart on Egypt - Market size and forecast 2025-2030 ($ million)
Data Table on Egypt - Market size and forecast 2025-2030 ($ million)
Chart on Egypt - Year-over-year growth 2025-2030 (%)
Data Table on Egypt - Year-over-year growth 2025-2030 (%)

12.6.5 Turkey - Market size and forecast 2025-2030

Chart on Turkey - Market size and forecast 2025-2030 ($ million)
Data Table on Turkey - Market size and forecast 2025-2030 ($ million)
Chart on Turkey - Year-over-year growth 2025-2030 (%)
Data Table on Turkey - Year-over-year growth 2025-2030 (%)

12.7 South America - Market size and forecast 2025-2030

Chart on South America - Market size and forecast 2025-2030 ($ million)
Data Table on South America - Market size and forecast 2025-2030 ($ million)
Chart on South America - Year-over-year growth 2025-2030 (%)
Data Table on South America - Year-over-year growth 2025-2030 (%)
Chart on Regional Comparison - South America
Data Table on Regional Comparison - South America

12.7.1 Brazil - Market size and forecast 2025-2030

Chart on Brazil - Market size and forecast 2025-2030 ($ million)
Data Table on Brazil - Market size and forecast 2025-2030 ($ million)
Chart on Brazil - Year-over-year growth 2025-2030 (%)
Data Table on Brazil - Year-over-year growth 2025-2030 (%)

12.7.2 Argentina - Market size and forecast 2025-2030

Chart on Argentina - Market size and forecast 2025-2030 ($ million)
Data Table on Argentina - Market size and forecast 2025-2030 ($ million)
Chart on Argentina - Year-over-year growth 2025-2030 (%)
Data Table on Argentina - Year-over-year growth 2025-2030 (%)

12.7.3 Chile - Market size and forecast 2025-2030

Chart on Chile - Market size and forecast 2025-2030 ($ million)
Data Table on Chile - Market size and forecast 2025-2030 ($ million)
Chart on Chile - Year-over-year growth 2025-2030 (%)
Data Table on Chile - Year-over-year growth 2025-2030 (%)

12.8 Market opportunity by geography

Market opportunity by geography ($ million)
Data Tables on Market opportunity by geography ($ million)

13. Drivers, Challenges, and Opportunity

13.1 Market drivers

Accelerated global integration of renewable power generation sources
Strategic modernization and replacement of aging electrical infrastructure in developed regions
Rapid urbanization and industrial expansion within Asia-pacific region

13.2 Market challenges

Significant price volatility and procurement risks of high-grade electrical steel
Logistical bottlenecks and geopolitical disruptions in global supply chain
Technical complexity and high capital barriers for advanced core technologies

13.3 Impact of drivers and challenges

Impact of drivers and challenges in 2025 and 2030

13.4 Market opportunities

Rising preference for amorphous metal alloys in high-efficiency distribution networks
Proliferation of digitalized core monitoring and diagnostic integration
Strategic focus on sustainable material sourcing and circular manufacturing processes

14. Competitive Landscape

14.1 Overview

14.2

Overview on criticality of inputs and factors of differentiation

14.3 Landscape disruption

Overview on factors of disruption

14.4 Industry risks

Impact of key risks on business

15. Competitive Analysis

15.1 Companies profiled

Companies covered

15.2 Company ranking index

15.3 Market positioning of companies

Matrix on companies position and classification

15.4 Arnold Magnetic Tech.

Arnold Magnetic Tech. - Overview
Arnold Magnetic Tech. - Product / Service
Arnold Magnetic Tech. - Key offerings
SWOT

15.5 CorePower Magnetics

CorePower Magnetics - Overview
CorePower Magnetics - Product / Service
CorePower Magnetics - Key offerings
SWOT

15.6 Eilor Magnetic Cores

Eilor Magnetic Cores - Overview
Eilor Magnetic Cores - Product / Service
Eilor Magnetic Cores - Key offerings
SWOT

15.7 Ferroxcube

Ferroxcube - Overview
Ferroxcube - Product / Service
Ferroxcube - Key offerings
SWOT

15.8 JFE Shoji Power Canada Inc.

JFE Shoji Power Canada Inc. - Overview
JFE Shoji Power Canada Inc. - Product / Service
JFE Shoji Power Canada Inc. - Key offerings
SWOT

15.9 KRYFS Power Components Ltd.

KRYFS Power Components Ltd. - Overview
KRYFS Power Components Ltd. - Product / Service
KRYFS Power Components Ltd. - Key offerings
SWOT

15.10 Magnetic Metals Corp

Magnetic Metals Corp - Overview
Magnetic Metals Corp - Product / Service
Magnetic Metals Corp - Key offerings
SWOT

15.11 MK Magnetics Inc.

MK Magnetics Inc. - Overview
MK Magnetics Inc. - Product / Service
MK Magnetics Inc. - Key offerings
SWOT

15.12 POWERCORE INDS INDIA PVT. LTD.

POWERCORE INDS INDIA PVT. LTD. - Overview
POWERCORE INDS INDIA PVT. LTD. - Product / Service
POWERCORE INDS INDIA PVT. LTD. - Key offerings
SWOT

15.13 Proterial Ltd.

Proterial Ltd. - Overview
Proterial Ltd. - Product / Service
Proterial Ltd. - Key offerings
SWOT

15.14 TDK Corp.

TDK Corp. - Overview
TDK Corp. - Business segments
TDK Corp. - Key offerings
TDK Corp. - Segment focus
SWOT

15.15 Tempel Steel Co LLC

Tempel Steel Co LLC - Overview
Tempel Steel Co LLC - Product / Service
Tempel Steel Co LLC - Key offerings
SWOT

15.16 Triad Magnetics

Triad Magnetics - Overview
Triad Magnetics - Product / Service
Triad Magnetics - Key offerings
SWOT

15.17 Vacuumschmelze GmbH and Co. KG

Vacuumschmelze GmbH and Co. KG - Overview
Vacuumschmelze GmbH and Co. KG - Product / Service
Vacuumschmelze GmbH and Co. KG - Key offerings
SWOT

15.18 Vilas Transcore Ltd.

Vilas Transcore Ltd. - Overview
Vilas Transcore Ltd. - Product / Service
Vilas Transcore Ltd. - Key offerings
SWOT

16. Appendix

16.1 Scope of the report

Market definition
Objectives
Notes and caveats

16.2 Inclusions and exclusions checklist

Inclusions checklist
Exclusions checklist

16.3 Currency conversion rates for US$

16.4 Research methodology

16.5 Data procurement

Information sources

16.6 Data validation

16.7 Validation techniques employed for market sizing

16.8 Data synthesis

16.9 360 degree market analysis

16.10 List of abbreviations

Research Methodology

Technavio presents a detailed picture of the market by way of study, synthesis, and summation of data from multiple sources. The analysts have presented the various facets of the market with a particular focus on identifying the key industry influencers. The data thus presented is comprehensive, reliable, and the result of extensive research, both primary and secondary.

INFORMATION SOURCES

Primary sources

  • Manufacturers and suppliers
  • Channel partners
  • Industry experts
  • Strategic decision makers

Secondary sources

  • Industry journals and periodicals
  • Government data
  • Financial reports of key industry players
  • Historical data
  • Press releases

DATA ANALYSIS

Data Synthesis

  • Collation of data
  • Estimation of key figures
  • Analysis of derived insights

Data Validation

  • Triangulation with data models
  • Reference against proprietary databases
  • Corroboration with industry experts

REPORT WRITING

Qualitative

  • Market drivers
  • Market challenges
  • Market trends
  • Five forces analysis

Quantitative

  • Market size and forecast
  • Market segmentation
  • Geographical insights
  • Competitive landscape

Interested in this report?

Get your sample now to see our research methodology and insights!

Download Now

Frequently Asked Questions

Transformer Core market growth will increase by USD 3537.1 million during 2026-2030.

The Transformer Core market is expected to grow at a CAGR of 5.9% during 2026-2030.

Transformer Core market is segmented by Material (Cold rolled grain oriented steel, Amorphous alloys, Cold rolled non-grain oriented steel, Others) Type (Distribution transformers, Power transformers, Dry-type transformers, Others) Application (Utility and grid, Industrial, Commercial and residential, Renewable energy integration)

Arnold Magnetic Tech., Corefficient, CorePower Magnetics, Eilor Magnetic Cores, ENPAY Endustriyel Pazarlama, Fair Rite Products Corp., Ferroxcube, JFE Shoji Power Canada Inc., KRYFS Power Components Ltd., Legnano Teknoelectrica Co, Magnetic Metals Corp, MK Magnetics Inc., Nomax Electrical Steel Pvt. Ltd., POWERCORE INDS INDIA PVT. LTD., Proterial Ltd., TDK Corp., Tempel Steel Co LLC, Triad Magnetics, Vacuumschmelze GmbH and Co. KG, Vilas Transcore Ltd. are a few of the key vendors in the Transformer Core market.

APAC will register the highest growth rate of 52.9% among the other regions. Therefore, the Transformer Core market in APAC is expected to garner significant business opportunities for the vendors during the forecast period.

China, India, Japan, South Korea, Australia, Indonesia, Germany, Italy, France, UK, Spain, The Netherlands, US, Canada, Mexico, Saudi Arabia, UAE, South Africa, Egypt, Turkey, Brazil, Argentina, Chile

  • Accelerated global integration of renewable power generation sources is the driving factor this market.

The Transformer Core market vendors should focus on grabbing business opportunities from the Material segment as it accounted for the largest market share in the base year.
RIA - Research AI Assistant
Ask RIA
