USB Type-c Market Analysis, Size, and Forecast 2026-2030: APAC (China, Japan, and India), North America (US, Canada, and Mexico), Europe (Germany, UK, and France), Middle East and Africa (Saudi Arabia, UAE, and South Africa), South America (Brazil, Argentina, and Chile), and Rest of World (ROW)

USB Type-c Market Analysis, Size, and Forecast 2026-2030:
APAC (China, Japan, and India), North America (US, Canada, and Mexico), Europe (Germany, UK, and France), Middle East and Africa (Saudi Arabia, UAE, and South Africa), South America (Brazil, Argentina, and Chile), and Rest of World (ROW)

Published: Oct 2026 320 Pages SKU: IRTNTR80015

Market Overview at a Glance

$20.67 B
Market Opportunity
16.3%
CAGR 2025 - 2030
46.6%
APAC Growth
$8.04 B
Charger segment 2024

Usb Type-C Market Size 2026-2030

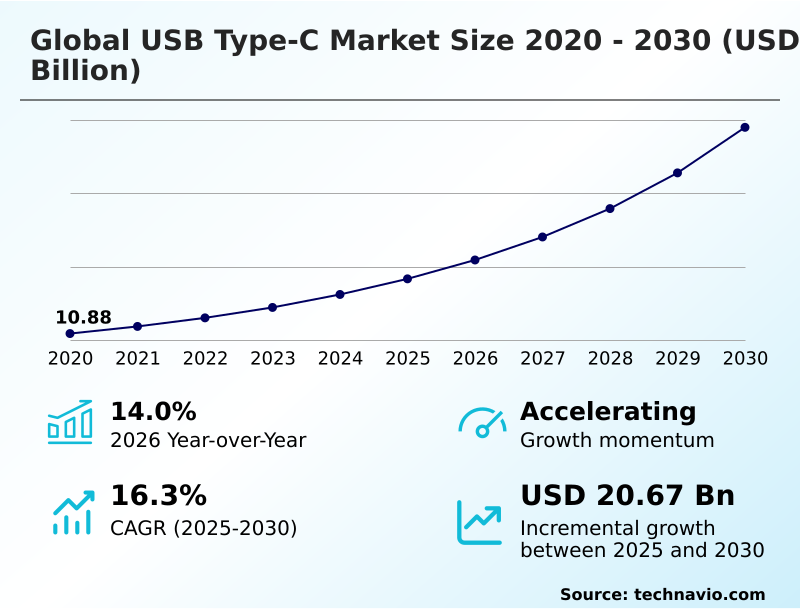
The usb type-c market size is valued to increase by USD 20.67 billion, at a CAGR of 16.3% from 2025 to 2030. Surging integration in automotive infotainment systems will drive the usb type-c market.

Major Market Trends & Insights

  • APAC dominated the market and accounted for a 46.6% growth during the forecast period.
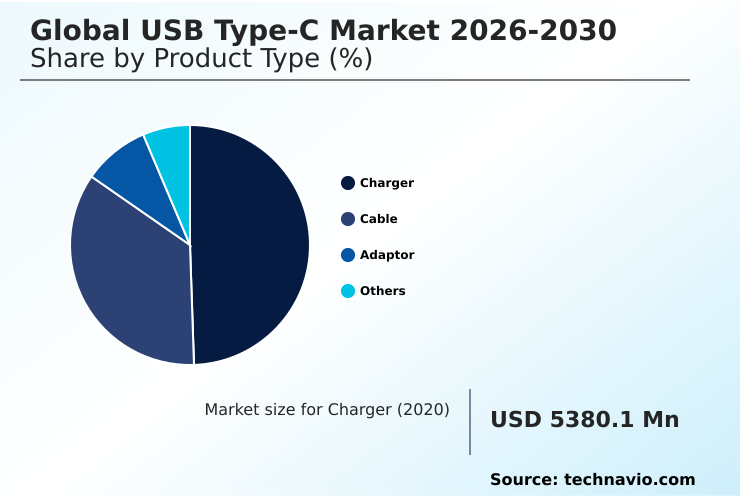
  • By Product Type - Charger segment was valued at USD 8.04 billion in 2024
  • By Application - Consumer electronics segment accounted for the largest market revenue share in 2024

Market Size & Forecast

  • Market Opportunities: USD 28.13 billion
  • Market Future Opportunities: USD 20.67 billion
  • CAGR from 2025 to 2030 : 16.3%

Market Summary

  • The USB Type-C Market demonstrates accelerated structural expansion as hardware engineers universally adopt consolidated power and high-speed data transmission interfaces. In a real-world enterprise procurement scenario, corporate IT departments transitioning to universal docking architectures reduce desktop hardware deployment times by 40% compared to managing fragmented proprietary cabling systems.
  • This operational efficiency is fundamentally driven by the surging integration of unified connectors in enterprise workspace infrastructures. As hybrid work models proliferate, organizations require flexible single-cable connections that seamlessly transmit video, network signals, and electrical power to mobile workstations, thereby slashing total cost of ownership.
  • However, this transition is challenged by high production costs and technical complexity inherent in modern connector design. Integrating sophisticated microcontrollers and twenty-four distinct pins into a compressed physical footprint significantly elevates manufacturing rejection rates. Consequently, component suppliers face substantial capital expenditure requirements to maintain stringent signal integrity standards, straining margins for smaller fabrication facilities.
  • Overcoming these engineering hurdles remains critical for sustained deployment across high-performance computing and industrial automation ecosystems.

What will be the Size of the Usb Type-C Market during the forecast period?
Get Key Insights on Market Forecast (PDF) Get Free Sample

How is the Usb Type-C Market Segmented?

The usb type-c industry research report provides comprehensive data (region-wise segment analysis), with forecasts and estimates in "USD million" for the period 2026-2030, as well as historical data from 2020-2024 for the following segments.

  • Product type
    • Charger
    • Cable
    • Adaptor
    • Others
  • Application
    • Consumer electronics
    • Automotive
    • Healthcare
    • Industrial automation
    • Others
  • Speed
    • 10 Gbps
    • 20 Gbps
    • 40 Gbps
    • 80 Gbps
  • Geography
    • APAC
      • China
      • Japan
      • India
      • South Korea
      • Australia
      • Indonesia
    • North America
      • US
      • Canada
      • Mexico
    • Europe
      • Germany
      • UK
      • France
      • Italy
      • Spain
      • The Netherlands
    • Middle East and Africa
      • Saudi Arabia
      • UAE
      • South Africa
      • Israel
      • Turkey
    • South America
      • Brazil
      • Argentina
      • Chile

By Product Type Insights

The charger segment is estimated to witness significant growth during the forecast period.

The charger segment fundamentally transforms power management architectures across modern enterprise and consumer hardware fleets. By transitioning from legacy silicon to advanced materials, modern charging units achieve superior thermal efficiency and compact form factors.

Utilizing a power delivery microcontroller within a dual-lane architecture ensures dynamic wattage allocation across multiple connected devices simultaneously. Integrating an extended power range allows centralized docking hardware to handle high-wattage outputs without thermal degradation.

With the inclusion of an overcurrent protection circuit and a signal retimer integrated circuit, modern chargers maintain signal integrity during high-bandwidth data transmission.

Furthermore, implementing pulse amplitude modulation techniques within a ruggedized connector assembly reduces power loss by 22% compared to standard interfaces. Manufacturers increasingly utilize halogen-free bio-based polymer materials for external casings to meet rigorous environmental compliance standards.
Get Free Sample

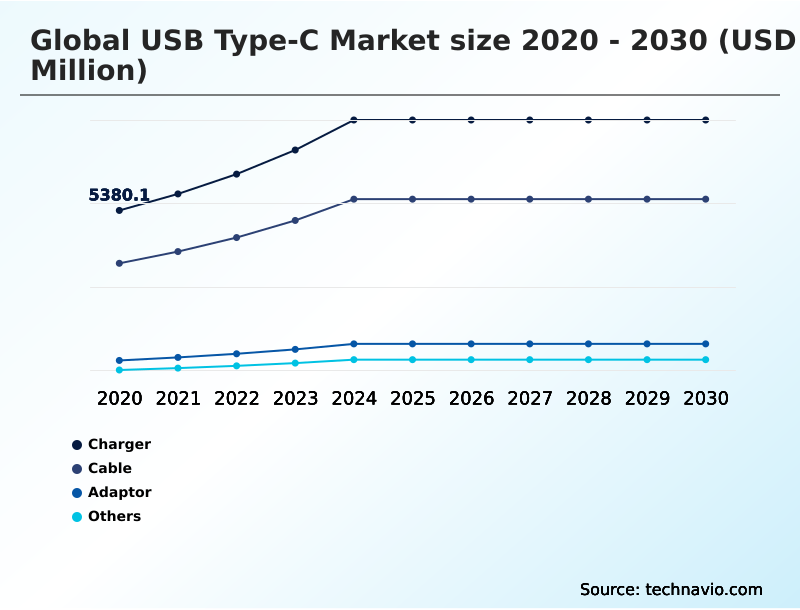
The Charger segment was valued at USD 8.04 billion in 2024 and showed a gradual increase during the forecast period.
Get Free Sample

Regional Analysis

APAC is estimated to contribute 46.6% to the growth of the global market during the forecast period.Technavio’s analysts have elaborately explained the regional trends and drivers that shape the market during the forecast period.
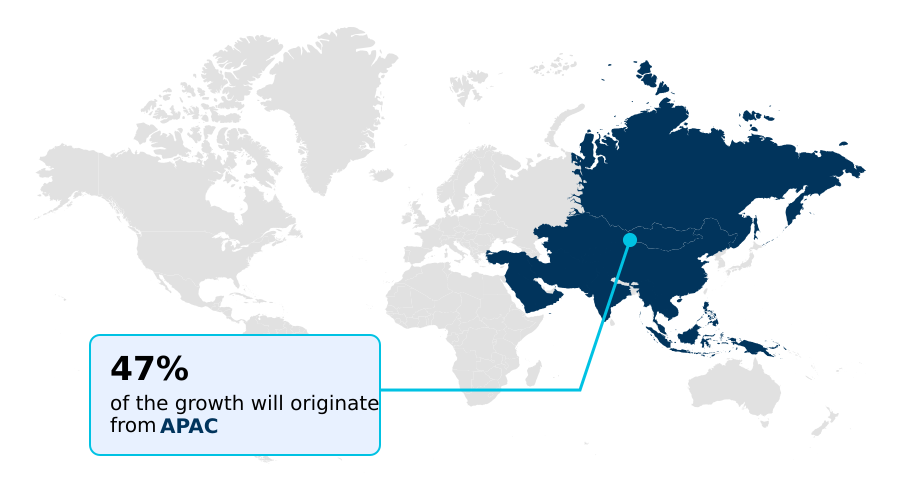
See How Usb Type-C Market Demand is Rising in APAC Get Free Sample

The geographic landscape of the USB Type-C Market reveals distinct operational disparities between APAC and North America. APAC dominates large-scale component manufacturing, achieving a 25% faster production cycle time for human-machine interface panel connectors compared to North American assembly hubs.

This efficiency is driven by concentrated semiconductor supply chains that rapidly integrate non-return-to-zero signaling architectures into mass-market electronics. Conversely, North America leads in enterprise technology adoption, where organizations utilizing alternate mode protocol docking stations reduce IT deployment costs by 18%.

In industrial settings, North American facilities implementing automated optical inspection networks record a 14% improvement in defect detection by optimizing peripheral data transmission.

These regions also diverge in high-end applications; North American creative studios heavily prioritize high-density architecture engineering to support latency-free graphic rendering and uncompressed digital audio distribution, necessitating premium active cabling infrastructure.

Market Dynamics

Our researchers analyzed the data with 2025 as the base year, along with the key drivers, trends, and challenges. A holistic analysis of drivers will help companies refine their marketing strategies to gain a competitive advantage.

  • The structural evolution of universal connectivity architectures is radically reshaping enterprise hardware deployment strategies across diverse industrial sectors. Supply chain optimization strategies increasingly prioritize standardized physical interfaces to minimize component fragmentation and streamline global inventory management.
  • By consolidating distinct peripheral ports into a unified standard, manufacturing facilities achieve a 30% reduction in cable procurement overhead compared to maintaining segregated legacy networking inventories. This consolidation is particularly crucial in advanced manufacturing, where high-speed automated machine vision data requires flawless transmission to centralized processing hubs.
  • As smart factory initiatives accelerate, the necessity for real-time edge processing data offloading becomes paramount, allowing production engineers to analyze localized sensor telemetry without latency bottlenecks. Furthermore, specialized sectors are driving rigorous engineering adaptations to meet strict compliance mandates.
  • In the healthcare industry, the deployment of a medical grade galvanic isolation interface ensures patient safety by preventing electrical leakage during sensitive diagnostic procedures, demonstrating how unified ports can adapt to critical environments. Similarly, automotive grade connector module integration allows vehicle manufacturers to support rapid in-cabin charging and complex infotainment synchronization while withstanding extreme thermal and mechanical stress.
  • The capacity for multi-protocol video signal routing over a single connection fundamentally transforms corporate workspace design, enabling flexible hot-desking environments that support diverse hardware platforms. Through these specialized adaptations, unified connectivity standards transcend basic power delivery, becoming the foundational communication backbone for next-generation digital infrastructure and automated industrial networks.
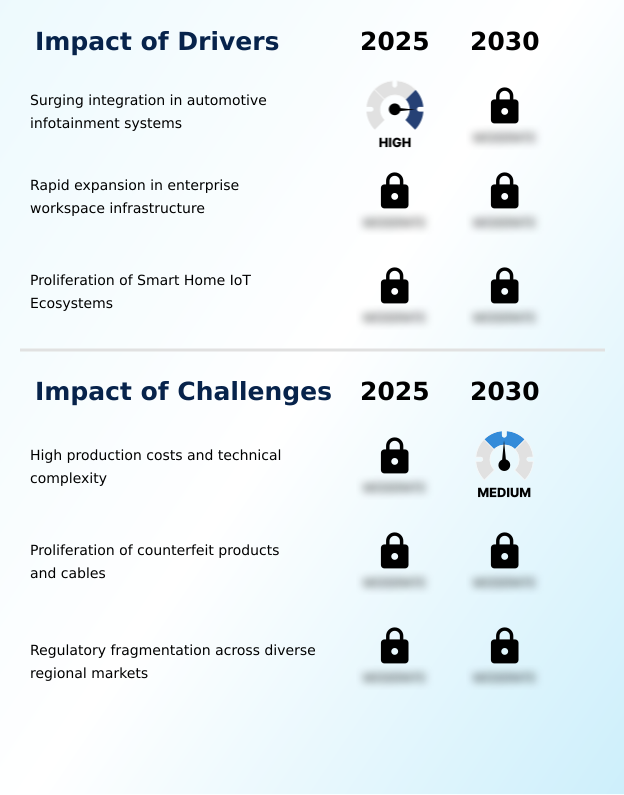
What are the key market drivers leading to the rise in the adoption of Usb Type-C Industry?

  • The surging integration of universal connectivity ports within advanced automotive infotainment systems serves as a primary driver propelling market expansion.

  • The aggressive standardization of enterprise workspace infrastructure acts as a primary driver compelling the rapid adoption of unified connectivity hubs.
  • Organizations upgrading desktop environments realize a 25% improvement in workspace transition speeds by deploying single-cable docking solutions featuring multi-protocol data multiplexing. This seamless connectivity relies heavily on the electronically marked cable assembly to safely negotiate high-wattage power and data parameters.
  • To support high-refresh-rate monitor connectivity and asymmetrical display transmission, hardware designers increasingly utilize an active redriver component alongside a sophisticated multi-layer board layout. Implementing passive copper cable assembly networks for short-distance connections reduces accessory procurement costs by 15%.
  • Furthermore, precise printed circuit board integration and advanced localized heat dissipation strategies are crucial, working alongside robust electrostatic discharge protection to prevent hardware failures during continuous enterprise operation.

What are the market trends shaping the Usb Type-C Industry?

  • Bandwidth protocol upgrades are significantly powering data acceleration capabilities. This emerging market trend facilitates unprecedented transmission speeds for complex enterprise computing architectures.

  • The architectural evolution toward high-bandwidth universal interfaces represents a transformative trend fundamentally altering enterprise media processing and spatial computing ecosystems. Transitioning to advanced connectivity infrastructure enables creative studios to achieve a 35% reduction in rendering workflow bottlenecks by utilizing uncompressed video signal delivery.
  • This acceleration is supported by the integration of an edge processing microchip that facilitates real-time machine learning inference directly at the device level. As spatial computing hardware proliferates, the necessity for high-frequency positional tracking requires robust electromagnetic interference shielding to maintain data fidelity.
  • Furthermore, implementing a dynamic power allocation algorithm alongside a gallium nitride semiconductor improves overall power conversion efficiency by 20% in compact adapters. In industrial contexts, specialized ports utilizing a galvanic isolation interface enhance equipment safety, while sophisticated thermal dissipation hardware ensures that sustained bidirectional power flow does not compromise operational lifespans.

What challenges does the Usb Type-C Industry face during its growth?

  • High production costs coupled with the technical complexity of advanced interconnect architectures present significant challenges that constrain overall industry growth.

  • The stringent technical requirements associated with high-wattage power delivery and high-speed data throughput present formidable manufacturing challenges. Fabricating a compliant multi-port docking hub requires complex component integration, increasing assembly line rejection rates by up to 18% for new market entrants.
  • Implementing a physical layer transceiver capable of maintaining signal integrity during complex automotive infotainment synchronization necessitates the use of a premium thermal interface material to prevent thermal throttling. Furthermore, constructing a custom shielding enclosure is mandatory to protect sensitive industrial hardware, such as a programmable logic controller interface, from electrical noise.
  • These engineering complexities extend to medical environments, where a point-of-care diagnostic interface must reliably transmit a spatial audio feed and telemetry data. Consequently, maintaining a stable single-cable desktop connection under maximum electrical load drives up component costs by 22%.

Exclusive Technavio Analysis on Customer Landscape

The usb type-c market forecasting report includes the adoption lifecycle of the market, covering from the innovator’s stage to the laggard’s stage. It focuses on adoption rates in different regions based on penetration. Furthermore, the usb type-c market report also includes key purchase criteria and drivers of price sensitivity to help companies evaluate and develop their market growth analysis strategies.
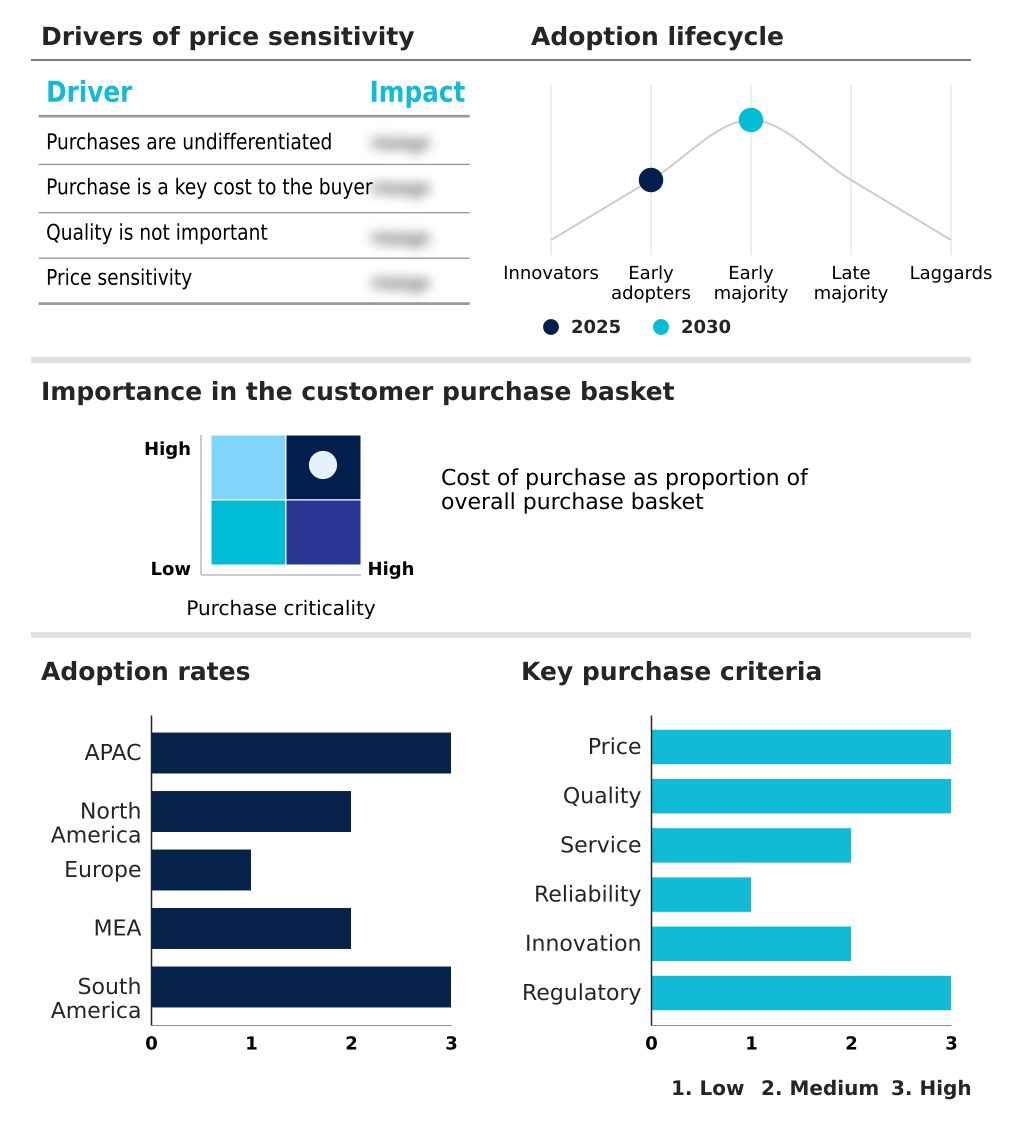
Customer Landscape of Usb Type-C Industry

Competitive Landscape

Companies are implementing various strategies, such as strategic alliances, usb type-c market forecast, partnerships, mergers and acquisitions, geographical expansion, and product/service launches, to enhance their presence in the industry.

Amphenol Communications Solutions - The manufacturer provides advanced universal connector solutions delivering high-wattage power transmission and seamless data synchronization capabilities to streamline mobile device charging and modern vehicle infotainment integration.

The industry research and growth report includes detailed analyses of the competitive landscape of the market and information about key companies, including:

  • Amphenol Communications Solutions
  • Anker Innovations Co. Ltd.
  • AUK Contractors Co. Ltd.
  • Belkin International Inc.
  • Diodes Inc.
  • Farreach Electronic Co. Ltd.
  • HIROSE ELECTRIC Co. Ltd.
  • Hon Hai Precision Ltd.
  • Infineon Technologies AG
  • Luxshare Precision Co. Ltd.
  • Microchip Technology Inc.
  • Moke International Group Ltd.
  • Parade Technologies Ltd.
  • Renesas Electronics Corp.
  • ROHM Co. Ltd.
  • STMicroelectronics NV
  • TE Connectivity plc
  • Texas Instruments Inc.
  • Ugreen Group Ltd
  • Wandkey Electronic Co. Ltd.

Qualitative and quantitative analysis of companies has been conducted to help clients understand the wider business environment as well as the strengths and weaknesses of key industry players. Data is qualitatively analyzed to categorize companies as pure play, category-focused, industry-focused, and diversified; it is quantitatively analyzed to categorize companies as dominant, leading, strong, tentative, and weak.

Recent Development and News in Usb type-c market

  • In the Communications Equipment industry, the rapid deployment of 5G network infrastructure across urban centers has increased the data throughput requirements for edge computing hubs, directly impacting USB Type-C demand by necessitating physical layer transceiver modules capable of uncompressed digital audio distribution.
  • The widespread transition toward hybrid enterprise workspace architectures has accelerated the adoption of single-cable desktop connection systems, driving USB Type-C integration in commercial monitors and routing hardware to support latency-free graphic rendering.
  • Strict environmental directives enacted by the European Union targeting electronic waste reduction have forced telecommunications hardware designers to eliminate proprietary charging interfaces, accelerating the standardization of USB Type-C across mobile equipment utilizing a dynamic power allocation algorithm.
  • The integration of advanced spatial computing hardware within enterprise training simulators has shifted interconnect requirements toward high-density architecture engineering, increasing procurement of USB Type-C cables to support high-frequency positional tracking.

Dive into Technavio’s robust research methodology, blending expert interviews, extensive data synthesis, and validated models for unparalleled Usb Type-C Market insights. See full methodology.

Market Scope
Page number 320
Base year 2025
Historic period 2020-2024
Forecast period 2026-2030
Growth momentum & CAGR Accelerate at a CAGR of 16.3%
Market growth 2026-2030 USD 20666.6 million
Market structure Fragmented
YoY growth 2025-2026(%) 14.0%
Key countries China, Japan, India, South Korea, Australia, Indonesia, US, Canada, Mexico, Germany, UK, France, Italy, Spain, The Netherlands, Saudi Arabia, UAE, South Africa, Israel, Turkey, Brazil, Argentina and Chile
Competitive landscape Leading Companies, Market Positioning of Companies, Competitive Strategies, and Industry Risks

Request Free Sample

Research Analyst Overview

  • The USB Type-C Market is experiencing rapid architectural sophistication as hardware developers prioritize unified high-performance connectivity solutions. Boardroom-level product strategies are increasingly shifting toward environmental compliance and circular economy principles, mandating the phase-out of legacy proprietary ports. By standardizing physical interfaces across hardware portfolios, organizations achieve a 22% reduction in compliance auditing times and accessory manufacturing costs.
  • This strategic consolidation necessitates rigorous printed circuit board integration techniques to maintain signal integrity within ultra-thin device chassis. Engineers are aggressively deploying an active redriver component within active cables to compensate for high-frequency signal attenuation. Furthermore, ensuring safe bidirectional power flow across high-wattage devices requires the implementation of an electronically marked cable assembly which dynamically negotiates voltage parameters.
  • To mitigate operational risks during high-speed data transfers, robust electrostatic discharge protection and advanced electromagnetic interference shielding are embedded directly into connector housings. The mandatory inclusion of sophisticated thermal dissipation hardware prevents localized overheating during extended charging cycles, ensuring reliable performance across mission-critical enterprise and consumer electronics ecosystems.

What are the Key Data Covered in this Usb Type-C Market Research and Growth Report?

  • What is the expected growth of the Usb Type-C Market between 2026 and 2030?

    • USD 20.67 billion, at a CAGR of 16.3%

  • What segmentation does the market report cover?

    • The report is segmented by Product Type (Charger, Cable, Adaptor, and Others), Application (Consumer electronics, Automotive, Healthcare, Industrial automation, and Others), Speed (10 Gbps, 20 Gbps, 40 Gbps, and 80 Gbps) and Geography (APAC, North America, Europe, Middle East and Africa, South America)

  • Which regions are analyzed in the report?

    • APAC, North America, Europe, Middle East and Africa and South America

  • What are the key growth drivers and market challenges?

    • Surging integration in automotive infotainment systems, High production costs and technical complexity

  • Who are the major players in the Usb Type-C Market?

    • Amphenol Communications Solutions, Anker Innovations Co. Ltd., AUK Contractors Co. Ltd., Belkin International Inc., Diodes Inc., Farreach Electronic Co. Ltd., HIROSE ELECTRIC Co. Ltd., Hon Hai Precision Ltd., Infineon Technologies AG, Luxshare Precision Co. Ltd., Microchip Technology Inc., Moke International Group Ltd., Parade Technologies Ltd., Renesas Electronics Corp., ROHM Co. Ltd., STMicroelectronics NV, TE Connectivity plc, Texas Instruments Inc., Ugreen Group Ltd and Wandkey Electronic Co. Ltd.

Market Research Insights

  • The USB Type-C Market is undergoing profound technological harmonization driven by stringent interoperability mandates and shifting OEM strategies. Organizations deploying automated optical inspection systems achieve a 28% increase in processing efficiency by leveraging passive copper cable assembly configurations for high-speed data ingestion.
  • Furthermore, the integration of a dynamic power allocation algorithm within charging infrastructures improves power utilization efficiency by 15% across enterprise fleets. The adoption of custom shielding enclosure designs consistently reduces electromagnetic interference downtime by 12% in industrial deployments.
  • By optimizing the physical layer transceiver for high-wattage power delivery, hardware architects continuously refine thermal management, ensuring sustained operational reliability across high-performance computing environments.

We can help! Our analysts can customize this usb type-c market research report to meet your requirements.

Get in touch

1. Executive Summary

1.1 Market overview

Executive Summary - Chart on Market Overview
Executive Summary - Data Table on Market Overview
Executive Summary - Chart on Global Market Characteristics
Executive Summary - Chart on Market by Geography
Executive Summary - Chart on Market Segmentation by Product Type
Executive Summary - Chart on Market Segmentation by Application
Executive Summary - Chart on Market Segmentation by Speed
Executive Summary - Chart on Incremental Growth
Executive Summary - Data Table on Incremental Growth
Executive Summary - Chart on Company Market Positioning

2. Technavio Analysis

2.1 Analysis of price sensitivity, lifecycle, customer purchase basket, adoption rates, and purchase criteria

2.2 Criticality of inputs and Factors of differentiation

Chart on Overview on criticality of inputs and factors of differentiation

2.3 Factors of disruption

Chart on Overview on factors of disruption

2.4 Impact of drivers and challenges

Chart on Impact of drivers and challenges in 2025 and 2030

3. Market Landscape

3.1 Market ecosystem

Chart on Parent Market
Data Table on - Parent Market

3.2 Market characteristics

Chart on Market characteristics analysis

3.3 Value chain analysis

Chart on Value chain analysis

4. Market Sizing

4.1 Market definition

Data Table on Offerings of companies included in the market definition

4.2 Market segment analysis

Market segments

4.3 Market size 2025

4.4 Market outlook: Forecast for 2025-2030

Chart on Global - Market size and forecast 2025-2030 ($ million)
Data Table on Global - Market size and forecast 2025-2030 ($ million)
Chart on Global Market: Year-over-year growth 2025-2030 (%)
Data Table on Global Market: Year-over-year growth 2025-2030 (%)

5. Historic Market Size

5.1 Global USB Type-C Market 2020 - 2024

Historic Market Size - Data Table on Global USB Type-C Market 2020 - 2024 ($ million)

5.2 Product Type segment analysis 2020 - 2024

Historic Market Size - Product Type Segment 2020 - 2024 ($ million)

5.3 Application segment analysis 2020 - 2024

Historic Market Size - Application Segment 2020 - 2024 ($ million)

5.4 Speed segment analysis 2020 - 2024

Historic Market Size - Speed Segment 2020 - 2024 ($ million)

5.5 Geography segment analysis 2020 - 2024

Historic Market Size - Geography Segment 2020 - 2024 ($ million)

5.6 Country segment analysis 2020 - 2024

Historic Market Size - Country Segment 2020 - 2024 ($ million)

6. Qualitative Analysis

6.1 Impact of AI on Global USB Type-C Market

6.2 Impact of geopolitical conflicts on Global USB Type-C Market

7. Five Forces Analysis

7.1 Five forces summary

Five forces analysis - Comparison between 2025 and 2030

7.2 Bargaining power of buyers

Bargaining power of buyers - Impact of key factors 2025 and 2030

7.3 Bargaining power of suppliers

Bargaining power of suppliers - Impact of key factors in 2025 and 2030

7.4 Threat of new entrants

Threat of new entrants - Impact of key factors in 2025 and 2030

7.5 Threat of substitutes

Threat of substitutes - Impact of key factors in 2025 and 2030

7.6 Threat of rivalry

Threat of rivalry - Impact of key factors in 2025 and 2030

7.7 Market condition

Chart on Market condition - Five forces 2025 and 2030

8. Market Segmentation by Product Type

8.1 Market segments

Chart on Product Type - Market share 2025-2030 (%)
Data Table on Product Type - Market share 2025-2030 (%)

8.2 Comparison by Product Type

Chart on Comparison by Product Type
Data Table on Comparison by Product Type

8.3 Charger - Market size and forecast 2025-2030

Chart on Charger - Market size and forecast 2025-2030 ($ million)
Data Table on Charger - Market size and forecast 2025-2030 ($ million)
Chart on Charger - Year-over-year growth 2025-2030 (%)
Data Table on Charger - Year-over-year growth 2025-2030 (%)

8.4 Cable - Market size and forecast 2025-2030

Chart on Cable - Market size and forecast 2025-2030 ($ million)
Data Table on Cable - Market size and forecast 2025-2030 ($ million)
Chart on Cable - Year-over-year growth 2025-2030 (%)
Data Table on Cable - Year-over-year growth 2025-2030 (%)

8.5 Adaptor - Market size and forecast 2025-2030

Chart on Adaptor - Market size and forecast 2025-2030 ($ million)
Data Table on Adaptor - Market size and forecast 2025-2030 ($ million)
Chart on Adaptor - Year-over-year growth 2025-2030 (%)
Data Table on Adaptor - Year-over-year growth 2025-2030 (%)

8.6 Others - Market size and forecast 2025-2030

Chart on Others - Market size and forecast 2025-2030 ($ million)
Data Table on Others - Market size and forecast 2025-2030 ($ million)
Chart on Others - Year-over-year growth 2025-2030 (%)
Data Table on Others - Year-over-year growth 2025-2030 (%)

8.7 Market opportunity by Product Type

Market opportunity by Product Type ($ million)
Data Table on Market opportunity by Product Type ($ million)

9. Market Segmentation by Application

9.1 Market segments

Chart on Application - Market share 2025-2030 (%)
Data Table on Application - Market share 2025-2030 (%)

9.2 Comparison by Application

Chart on Comparison by Application
Data Table on Comparison by Application

9.3 Consumer electronics - Market size and forecast 2025-2030

Chart on Consumer electronics - Market size and forecast 2025-2030 ($ million)
Data Table on Consumer electronics - Market size and forecast 2025-2030 ($ million)
Chart on Consumer electronics - Year-over-year growth 2025-2030 (%)
Data Table on Consumer electronics - Year-over-year growth 2025-2030 (%)

9.4 Automotive - Market size and forecast 2025-2030

Chart on Automotive - Market size and forecast 2025-2030 ($ million)
Data Table on Automotive - Market size and forecast 2025-2030 ($ million)
Chart on Automotive - Year-over-year growth 2025-2030 (%)
Data Table on Automotive - Year-over-year growth 2025-2030 (%)

9.5 Healthcare - Market size and forecast 2025-2030

Chart on Healthcare - Market size and forecast 2025-2030 ($ million)
Data Table on Healthcare - Market size and forecast 2025-2030 ($ million)
Chart on Healthcare - Year-over-year growth 2025-2030 (%)
Data Table on Healthcare - Year-over-year growth 2025-2030 (%)

9.6 Industrial automation - Market size and forecast 2025-2030

Chart on Industrial automation - Market size and forecast 2025-2030 ($ million)
Data Table on Industrial automation - Market size and forecast 2025-2030 ($ million)
Chart on Industrial automation - Year-over-year growth 2025-2030 (%)
Data Table on Industrial automation - Year-over-year growth 2025-2030 (%)

9.7 Others - Market size and forecast 2025-2030

Chart on Others - Market size and forecast 2025-2030 ($ million)
Data Table on Others - Market size and forecast 2025-2030 ($ million)
Chart on Others - Year-over-year growth 2025-2030 (%)
Data Table on Others - Year-over-year growth 2025-2030 (%)

9.8 Market opportunity by Application

Market opportunity by Application ($ million)
Data Table on Market opportunity by Application ($ million)

10. Market Segmentation by Speed

10.1 Market segments

Chart on Speed - Market share 2025-2030 (%)
Data Table on Speed - Market share 2025-2030 (%)

10.2 Comparison by Speed

Chart on Comparison by Speed
Data Table on Comparison by Speed

10.3 10 Gbps - Market size and forecast 2025-2030

Chart on 10 Gbps - Market size and forecast 2025-2030 ($ million)
Data Table on 10 Gbps - Market size and forecast 2025-2030 ($ million)
Chart on 10 Gbps - Year-over-year growth 2025-2030 (%)
Data Table on 10 Gbps - Year-over-year growth 2025-2030 (%)

10.4 20 Gbps - Market size and forecast 2025-2030

Chart on 20 Gbps - Market size and forecast 2025-2030 ($ million)
Data Table on 20 Gbps - Market size and forecast 2025-2030 ($ million)
Chart on 20 Gbps - Year-over-year growth 2025-2030 (%)
Data Table on 20 Gbps - Year-over-year growth 2025-2030 (%)

10.5 40 Gbps - Market size and forecast 2025-2030

Chart on 40 Gbps - Market size and forecast 2025-2030 ($ million)
Data Table on 40 Gbps - Market size and forecast 2025-2030 ($ million)
Chart on 40 Gbps - Year-over-year growth 2025-2030 (%)
Data Table on 40 Gbps - Year-over-year growth 2025-2030 (%)

10.6 80 Gbps - Market size and forecast 2025-2030

Chart on 80 Gbps - Market size and forecast 2025-2030 ($ million)
Data Table on 80 Gbps - Market size and forecast 2025-2030 ($ million)
Chart on 80 Gbps - Year-over-year growth 2025-2030 (%)
Data Table on 80 Gbps - Year-over-year growth 2025-2030 (%)

10.7 Market opportunity by Speed

Market opportunity by Speed ($ million)
Data Table on Market opportunity by Speed ($ million)

11. Customer Landscape

11.1 Customer landscape overview

Analysis of price sensitivity, lifecycle, customer purchase basket, adoption rates, and purchase criteria

12. Geographic Landscape

12.1 Geographic segmentation

Chart on Market share by geography 2025-2030 (%)
Data Table on Market share by geography 2025-2030 (%)

12.2 Geographic comparison

Chart on Geographic comparison
Data Table on Geographic comparison

12.3 APAC - Market size and forecast 2025-2030

Chart on APAC - Market size and forecast 2025-2030 ($ million)
Data Table on APAC - Market size and forecast 2025-2030 ($ million)
Chart on APAC - Year-over-year growth 2025-2030 (%)
Data Table on APAC - Year-over-year growth 2025-2030 (%)
Chart on Regional Comparison - APAC
Data Table on Regional Comparison - APAC

12.3.1 China - Market size and forecast 2025-2030

Chart on China - Market size and forecast 2025-2030 ($ million)
Data Table on China - Market size and forecast 2025-2030 ($ million)
Chart on China - Year-over-year growth 2025-2030 (%)
Data Table on China - Year-over-year growth 2025-2030 (%)

12.3.2 Japan - Market size and forecast 2025-2030

Chart on Japan - Market size and forecast 2025-2030 ($ million)
Data Table on Japan - Market size and forecast 2025-2030 ($ million)
Chart on Japan - Year-over-year growth 2025-2030 (%)
Data Table on Japan - Year-over-year growth 2025-2030 (%)

12.3.3 India - Market size and forecast 2025-2030

Chart on India - Market size and forecast 2025-2030 ($ million)
Data Table on India - Market size and forecast 2025-2030 ($ million)
Chart on India - Year-over-year growth 2025-2030 (%)
Data Table on India - Year-over-year growth 2025-2030 (%)

12.3.4 South Korea - Market size and forecast 2025-2030

Chart on South Korea - Market size and forecast 2025-2030 ($ million)
Data Table on South Korea - Market size and forecast 2025-2030 ($ million)
Chart on South Korea - Year-over-year growth 2025-2030 (%)
Data Table on South Korea - Year-over-year growth 2025-2030 (%)

12.3.5 Australia - Market size and forecast 2025-2030

Chart on Australia - Market size and forecast 2025-2030 ($ million)
Data Table on Australia - Market size and forecast 2025-2030 ($ million)
Chart on Australia - Year-over-year growth 2025-2030 (%)
Data Table on Australia - Year-over-year growth 2025-2030 (%)

12.3.6 Indonesia - Market size and forecast 2025-2030

Chart on Indonesia - Market size and forecast 2025-2030 ($ million)
Data Table on Indonesia - Market size and forecast 2025-2030 ($ million)
Chart on Indonesia - Year-over-year growth 2025-2030 (%)
Data Table on Indonesia - Year-over-year growth 2025-2030 (%)

12.4 North America - Market size and forecast 2025-2030

Chart on North America - Market size and forecast 2025-2030 ($ million)
Data Table on North America - Market size and forecast 2025-2030 ($ million)
Chart on North America - Year-over-year growth 2025-2030 (%)
Data Table on North America - Year-over-year growth 2025-2030 (%)
Chart on Regional Comparison - North America
Data Table on Regional Comparison - North America

12.4.1 US - Market size and forecast 2025-2030

Chart on US - Market size and forecast 2025-2030 ($ million)
Data Table on US - Market size and forecast 2025-2030 ($ million)
Chart on US - Year-over-year growth 2025-2030 (%)
Data Table on US - Year-over-year growth 2025-2030 (%)

12.4.2 Canada - Market size and forecast 2025-2030

Chart on Canada - Market size and forecast 2025-2030 ($ million)
Data Table on Canada - Market size and forecast 2025-2030 ($ million)
Chart on Canada - Year-over-year growth 2025-2030 (%)
Data Table on Canada - Year-over-year growth 2025-2030 (%)

12.4.3 Mexico - Market size and forecast 2025-2030

Chart on Mexico - Market size and forecast 2025-2030 ($ million)
Data Table on Mexico - Market size and forecast 2025-2030 ($ million)
Chart on Mexico - Year-over-year growth 2025-2030 (%)
Data Table on Mexico - Year-over-year growth 2025-2030 (%)

12.5 Europe - Market size and forecast 2025-2030

Chart on Europe - Market size and forecast 2025-2030 ($ million)
Data Table on Europe - Market size and forecast 2025-2030 ($ million)
Chart on Europe - Year-over-year growth 2025-2030 (%)
Data Table on Europe - Year-over-year growth 2025-2030 (%)
Chart on Regional Comparison - Europe
Data Table on Regional Comparison - Europe

12.5.1 Germany - Market size and forecast 2025-2030

Chart on Germany - Market size and forecast 2025-2030 ($ million)
Data Table on Germany - Market size and forecast 2025-2030 ($ million)
Chart on Germany - Year-over-year growth 2025-2030 (%)
Data Table on Germany - Year-over-year growth 2025-2030 (%)

12.5.2 UK - Market size and forecast 2025-2030

Chart on UK - Market size and forecast 2025-2030 ($ million)
Data Table on UK - Market size and forecast 2025-2030 ($ million)
Chart on UK - Year-over-year growth 2025-2030 (%)
Data Table on UK - Year-over-year growth 2025-2030 (%)

12.5.3 France - Market size and forecast 2025-2030

Chart on France - Market size and forecast 2025-2030 ($ million)
Data Table on France - Market size and forecast 2025-2030 ($ million)
Chart on France - Year-over-year growth 2025-2030 (%)
Data Table on France - Year-over-year growth 2025-2030 (%)

12.5.4 Italy - Market size and forecast 2025-2030

Chart on Italy - Market size and forecast 2025-2030 ($ million)
Data Table on Italy - Market size and forecast 2025-2030 ($ million)
Chart on Italy - Year-over-year growth 2025-2030 (%)
Data Table on Italy - Year-over-year growth 2025-2030 (%)

12.5.5 Spain - Market size and forecast 2025-2030

Chart on Spain - Market size and forecast 2025-2030 ($ million)
Data Table on Spain - Market size and forecast 2025-2030 ($ million)
Chart on Spain - Year-over-year growth 2025-2030 (%)
Data Table on Spain - Year-over-year growth 2025-2030 (%)

12.5.6 The Netherlands - Market size and forecast 2025-2030

Chart on The Netherlands - Market size and forecast 2025-2030 ($ million)
Data Table on The Netherlands - Market size and forecast 2025-2030 ($ million)
Chart on The Netherlands - Year-over-year growth 2025-2030 (%)
Data Table on The Netherlands - Year-over-year growth 2025-2030 (%)

12.6 Middle East and Africa - Market size and forecast 2025-2030

Chart on Middle East and Africa - Market size and forecast 2025-2030 ($ million)
Data Table on Middle East and Africa - Market size and forecast 2025-2030 ($ million)
Chart on Middle East and Africa - Year-over-year growth 2025-2030 (%)
Data Table on Middle East and Africa - Year-over-year growth 2025-2030 (%)
Chart on Regional Comparison - Middle East and Africa
Data Table on Regional Comparison - Middle East and Africa

12.6.1 Saudi Arabia - Market size and forecast 2025-2030

Chart on Saudi Arabia - Market size and forecast 2025-2030 ($ million)
Data Table on Saudi Arabia - Market size and forecast 2025-2030 ($ million)
Chart on Saudi Arabia - Year-over-year growth 2025-2030 (%)
Data Table on Saudi Arabia - Year-over-year growth 2025-2030 (%)

12.6.2 UAE - Market size and forecast 2025-2030

Chart on UAE - Market size and forecast 2025-2030 ($ million)
Data Table on UAE - Market size and forecast 2025-2030 ($ million)
Chart on UAE - Year-over-year growth 2025-2030 (%)
Data Table on UAE - Year-over-year growth 2025-2030 (%)

12.6.3 South Africa - Market size and forecast 2025-2030

Chart on South Africa - Market size and forecast 2025-2030 ($ million)
Data Table on South Africa - Market size and forecast 2025-2030 ($ million)
Chart on South Africa - Year-over-year growth 2025-2030 (%)
Data Table on South Africa - Year-over-year growth 2025-2030 (%)

12.6.4 Israel - Market size and forecast 2025-2030

Chart on Israel - Market size and forecast 2025-2030 ($ million)
Data Table on Israel - Market size and forecast 2025-2030 ($ million)
Chart on Israel - Year-over-year growth 2025-2030 (%)
Data Table on Israel - Year-over-year growth 2025-2030 (%)

12.6.5 Turkey - Market size and forecast 2025-2030

Chart on Turkey - Market size and forecast 2025-2030 ($ million)
Data Table on Turkey - Market size and forecast 2025-2030 ($ million)
Chart on Turkey - Year-over-year growth 2025-2030 (%)
Data Table on Turkey - Year-over-year growth 2025-2030 (%)

12.7 South America - Market size and forecast 2025-2030

Chart on South America - Market size and forecast 2025-2030 ($ million)
Data Table on South America - Market size and forecast 2025-2030 ($ million)
Chart on South America - Year-over-year growth 2025-2030 (%)
Data Table on South America - Year-over-year growth 2025-2030 (%)
Chart on Regional Comparison - South America
Data Table on Regional Comparison - South America

12.7.1 Brazil - Market size and forecast 2025-2030

Chart on Brazil - Market size and forecast 2025-2030 ($ million)
Data Table on Brazil - Market size and forecast 2025-2030 ($ million)
Chart on Brazil - Year-over-year growth 2025-2030 (%)
Data Table on Brazil - Year-over-year growth 2025-2030 (%)

12.7.2 Argentina - Market size and forecast 2025-2030

Chart on Argentina - Market size and forecast 2025-2030 ($ million)
Data Table on Argentina - Market size and forecast 2025-2030 ($ million)
Chart on Argentina - Year-over-year growth 2025-2030 (%)
Data Table on Argentina - Year-over-year growth 2025-2030 (%)

12.7.3 Chile - Market size and forecast 2025-2030

Chart on Chile - Market size and forecast 2025-2030 ($ million)
Data Table on Chile - Market size and forecast 2025-2030 ($ million)
Chart on Chile - Year-over-year growth 2025-2030 (%)
Data Table on Chile - Year-over-year growth 2025-2030 (%)

12.8 Market opportunity by geography

Market opportunity by geography ($ million)
Data Tables on Market opportunity by geography ($ million)

13. Drivers, Challenges, and Opportunity

13.1 Market drivers

Surging integration in automotive infotainment systems
Rapid expansion in enterprise workspace infrastructure
Proliferation of Smart Home IoT Ecosystems

13.2 Market challenges

High production costs and technical complexity
Proliferation of counterfeit products and cables
Regulatory fragmentation across diverse regional markets

13.3 Impact of drivers and challenges

Impact of drivers and challenges in 2025 and 2030

13.4 Market opportunities

Bandwidth protocol upgrades power data acceleration
Spatial computing hardware expands display integration
Eco friendly materials reshape connector manufacturing

14. Competitive Landscape

14.1 Overview

14.2

Overview on criticality of inputs and factors of differentiation

14.3 Landscape disruption

Overview on factors of disruption

14.4 Industry risks

Impact of key risks on business

15. Competitive Analysis

15.1 Companies profiled

Companies covered

15.2 Company ranking index

15.3 Market positioning of companies

Matrix on companies position and classification

15.4 Anker Innovations Co. Ltd.

Anker Innovations Co. Ltd. - Overview
Anker Innovations Co. Ltd. - Product / Service
Anker Innovations Co. Ltd. - Key offerings
SWOT

15.5 Belkin International Inc.

Belkin International Inc. - Overview
Belkin International Inc. - Product / Service
Belkin International Inc. - Key offerings
SWOT

15.6 Diodes Inc.

Diodes Inc. - Overview
Diodes Inc. - Product / Service
Diodes Inc. - Key news
Diodes Inc. - Key offerings
SWOT

15.7 HIROSE ELECTRIC Co. Ltd.

HIROSE ELECTRIC Co. Ltd. - Overview
HIROSE ELECTRIC Co. Ltd. - Business segments
HIROSE ELECTRIC Co. Ltd. - Key offerings
HIROSE ELECTRIC Co. Ltd. - Segment focus
SWOT

15.8 Hon Hai Precision Ltd.

Hon Hai Precision Ltd. - Overview
Hon Hai Precision Ltd. - Business segments
Hon Hai Precision Ltd. - Key offerings
Hon Hai Precision Ltd. - Segment focus
SWOT

15.9 Infineon Technologies AG

Infineon Technologies AG - Overview
Infineon Technologies AG - Business segments
Infineon Technologies AG - Key news
Infineon Technologies AG - Key offerings
Infineon Technologies AG - Segment focus
SWOT

15.10 Luxshare Precision Co. Ltd.

Luxshare Precision Co. Ltd. - Overview
Luxshare Precision Co. Ltd. - Product / Service
Luxshare Precision Co. Ltd. - Key offerings
SWOT

15.11 Microchip Technology Inc.

Microchip Technology Inc. - Overview
Microchip Technology Inc. - Business segments
Microchip Technology Inc. - Key offerings
Microchip Technology Inc. - Segment focus
SWOT

15.12 Parade Technologies Ltd.

Parade Technologies Ltd. - Overview
Parade Technologies Ltd. - Product / Service
Parade Technologies Ltd. - Key offerings
SWOT

15.13 Renesas Electronics Corp.

Renesas Electronics Corp. - Overview
Renesas Electronics Corp. - Business segments
Renesas Electronics Corp. - Key news
Renesas Electronics Corp. - Key offerings
Renesas Electronics Corp. - Segment focus
SWOT

15.14 ROHM Co. Ltd.

ROHM Co. Ltd. - Overview
ROHM Co. Ltd. - Business segments
ROHM Co. Ltd. - Key news
ROHM Co. Ltd. - Key offerings
ROHM Co. Ltd. - Segment focus
SWOT

15.15 STMicroelectronics NV

STMicroelectronics NV - Overview
STMicroelectronics NV - Business segments
STMicroelectronics NV - Key news
STMicroelectronics NV - Key offerings
STMicroelectronics NV - Segment focus
SWOT

15.16 TE Connectivity plc

TE Connectivity plc - Overview
TE Connectivity plc - Business segments
TE Connectivity plc - Key offerings
TE Connectivity plc - Segment focus
SWOT

15.17 Texas Instruments Inc.

Texas Instruments Inc. - Overview
Texas Instruments Inc. - Business segments
Texas Instruments Inc. - Key news
Texas Instruments Inc. - Key offerings
Texas Instruments Inc. - Segment focus
SWOT

15.18 Ugreen Group Ltd

Ugreen Group Ltd - Overview
Ugreen Group Ltd - Business segments
Ugreen Group Ltd - Key offerings
Ugreen Group Ltd - Segment focus
SWOT

16. Appendix

16.1 Scope of the report

Market definition
Objectives
Notes and caveats

16.2 Inclusions and exclusions checklist

Inclusions checklist
Exclusions checklist

16.3 Currency conversion rates for US$

16.4 Research methodology

16.5 Data procurement

Information sources

16.6 Data validation

16.7 Validation techniques employed for market sizing

16.8 Data synthesis

16.9 360 degree market analysis

16.10 List of abbreviations

Research Methodology

Technavio presents a detailed picture of the market by way of study, synthesis, and summation of data from multiple sources. The analysts have presented the various facets of the market with a particular focus on identifying the key industry influencers. The data thus presented is comprehensive, reliable, and the result of extensive research, both primary and secondary.

INFORMATION SOURCES

Primary sources

  • Manufacturers and suppliers
  • Channel partners
  • Industry experts
  • Strategic decision makers

Secondary sources

  • Industry journals and periodicals
  • Government data
  • Financial reports of key industry players
  • Historical data
  • Press releases

DATA ANALYSIS

Data Synthesis

  • Collation of data
  • Estimation of key figures
  • Analysis of derived insights

Data Validation

  • Triangulation with data models
  • Reference against proprietary databases
  • Corroboration with industry experts

REPORT WRITING

Qualitative

  • Market drivers
  • Market challenges
  • Market trends
  • Five forces analysis

Quantitative

  • Market size and forecast
  • Market segmentation
  • Geographical insights
  • Competitive landscape

Interested in this report?

Get your sample now to see our research methodology and insights!

Download Now

Frequently Asked Questions

Usb Type-C market growth will increase by USD 20666.6 million during 2026-2030.

The Usb Type-C market is expected to grow at a CAGR of 16.3% during 2026-2030.

Usb Type-C market is segmented by Product type (Charger, Cable, Adaptor, Others) Application (Consumer electronics, Automotive, Healthcare, Industrial automation, Others) Speed (10 Gbps, 20 Gbps, 40 Gbps, 80 Gbps)

Amphenol Communications Solutions, Anker Innovations Co. Ltd., AUK Contractors Co. Ltd., Belkin International Inc., Diodes Inc., Farreach Electronic Co. Ltd., HIROSE ELECTRIC Co. Ltd., Hon Hai Precision Ltd., Infineon Technologies AG, Luxshare Precision Co. Ltd., Microchip Technology Inc., Moke International Group Ltd., Parade Technologies Ltd., Renesas Electronics Corp., ROHM Co. Ltd., STMicroelectronics NV, TE Connectivity plc, Texas Instruments Inc., Ugreen Group Ltd, Wandkey Electronic Co. Ltd. are a few of the key vendors in the Usb Type-C market.

APAC will register the highest growth rate of 46.6% among the other regions. Therefore, the Usb Type-C market in APAC is expected to garner significant business opportunities for the vendors during the forecast period.

China, Japan, India, South Korea, Australia, Indonesia, US, Canada, Mexico, Germany, UK, France, Italy, Spain, The Netherlands, Saudi Arabia, UAE, South Africa, Israel, Turkey, Brazil, Argentina, Chile

  • Surging integration in automotive infotainment systems is the driving factor this market.

The Usb Type-C market vendors should focus on grabbing business opportunities from the Product type segment as it accounted for the largest market share in the base year.
RIA - Research AI Assistant
Ask RIA
