
Utility Poles Market Analysis, Size, and Forecast 2026-2030: APAC (China, India, and Australia), North America (US, Canada, and Mexico), Europe (France, Germany, and UK), South America (Brazil, Argentina, and Chile), Middle East and Africa (Saudi Arabia, UAE, and South Africa), and Rest of World (ROW)

Utility Poles Market Analysis, Size, and Forecast 2026-2030:
APAC (China, India, and Australia), North America (US, Canada, and Mexico), Europe (France, Germany, and UK), South America (Brazil, Argentina, and Chile), Middle East and Africa (Saudi Arabia, UAE, and South Africa), and Rest of World (ROW)

Published: Oct 2026 289 Pages SKU: IRTNTR73688

Market Overview at a Glance

$9.59 B
Market Opportunity
3.5%
CAGR 2025 - 2030
40.4%
North America Growth
$30.12 B
Distribution poles segment 2024

Utility Poles Market Size 2026-2030

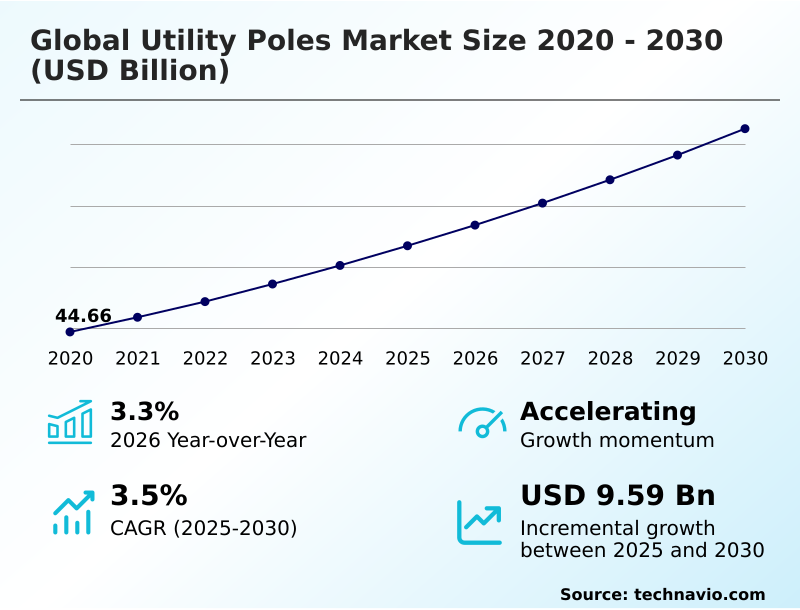
The utility poles market size is valued to increase by USD 9.59 billion, at a CAGR of 3.5% from 2025 to 2030. Increasing investments in grid modernization and resiliency will drive the utility poles market.

Major Market Trends & Insights

  • North America dominated the market and accounted for a 40.4% growth during the forecast period.
  • By Type - Distribution poles segment was valued at USD 30.12 billion in 2024
  • By Material - Steel segment accounted for the largest market revenue share in 2024

Market Size & Forecast

  • Market Opportunities: USD 16.64 billion
  • Market Future Opportunities: USD 9.59 billion
  • CAGR from 2025 to 2030 : 3.5%

Market Summary

  • The Utility Poles Market demonstrates consistent expansion driven by the critical need to fortify overhead power distribution networks against increasingly severe climatic disruptions. To optimize operational continuity, utility companies are actively replacing aging infrastructure with resilient materials, significantly enhancing overall network stability.
  • For instance, municipal operators transitioning from traditional wood to spun concrete and composite structures have observed a 25% reduction in weather-related failure rates, thereby drastically lowering emergency maintenance expenditures. A primary driver of this Utility Poles demand is the surge in grid modernization initiatives, which necessitates robust vertical supports capable of handling advanced metering hardware and decentralized renewable energy loads.
  • Conversely, the market faces a substantial challenge in the form of protracted right-of-way acquisitions and stringent environmental permitting. These bureaucratic hurdles frequently stall essential transmission line expansions, delaying project timelines and increasing administrative overhead. By prioritizing durable and modular structural solutions, stakeholders are effectively future-proofing critical energy corridors and ensuring highly reliable power delivery.

What will be the Size of the Utility Poles Market during the forecast period?
Get Key Insights on Market Forecast (PDF) Get Free Sample

How is the Utility Poles Market Segmented?

The utility poles industry research report provides comprehensive data (region-wise segment analysis), with forecasts and estimates in "USD million" for the period 2026-2030, as well as historical data from 2020-2024 for the following segments.

  • Type
    • Distribution poles
    • Transmission poles
  • Material
    • Steel
    • Concrete
    • Composite
    • Wood
  • Application
    • Transmission line
    • Distribution line
    • Telecommunication
    • Others
  • Geography
    • APAC
      • China
      • India
      • Australia
      • Indonesia
      • Japan
      • South Korea
    • North America
      • US
      • Canada
      • Mexico
    • Europe
      • France
      • Germany
      • UK
      • Italy
      • Spain
      • The Netherlands
    • South America
      • Brazil
      • Argentina
      • Chile
    • Middle East and Africa
      • Saudi Arabia
      • UAE
      • South Africa
      • Turkey
      • Israel

By Type Insights

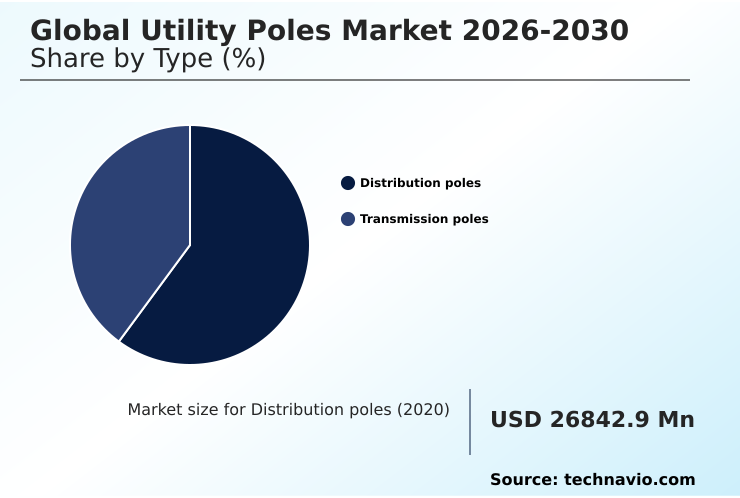
The distribution poles segment is estimated to witness significant growth during the forecast period.

The distribution poles segment acts as the fundamental framework for delivering electricity to expanding municipalities. Propelled by massive urban electrification initiatives, network operators are systematically replacing legacy electrical distribution networks to ensure proactive grid hardening against severe climatic events.

This modernization shift accelerates the widespread adoption of advanced composite materials and fiberglass reinforced polymer structures, which demonstrate superior environmental durability compared to traditional treated timber structures.

By installing engineered composites and prestressed spun cast concrete, utilities increase their structural load bearing capacity by over 15%, safely accommodating heavy specialized transformer supports.

Consequently, these infrastructure resiliency upgrades not only enhance public safety but drastically lower lifecycle maintenance costs, ensuring a highly reliable and continuous energy delivery system for growing residential and commercial sectors.
Get Free Sample

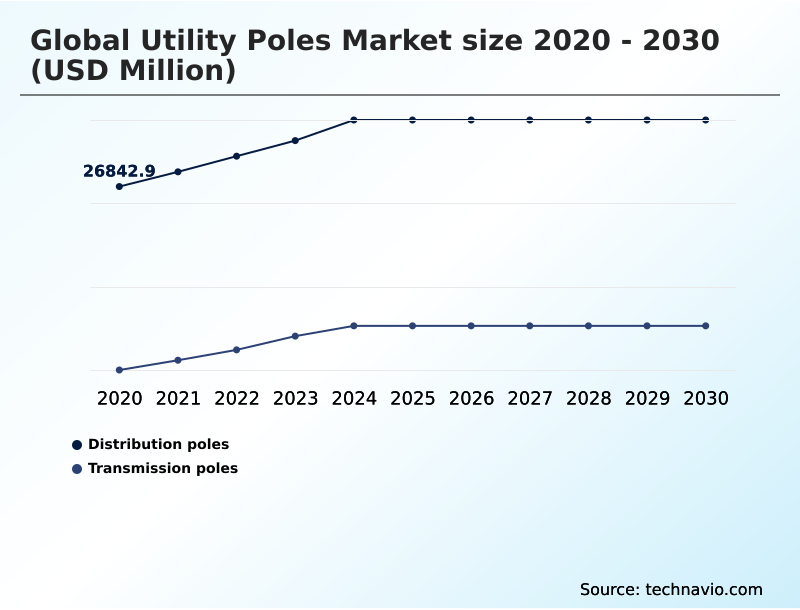
The Distribution poles segment was valued at USD 30.12 billion in 2024 and showed a gradual increase during the forecast period.
Get Free Sample

Regional Analysis

North America is estimated to contribute 40.4% to the growth of the global market during the forecast period.Technavio’s analysts have elaborately explained the regional trends and drivers that shape the market during the forecast period.
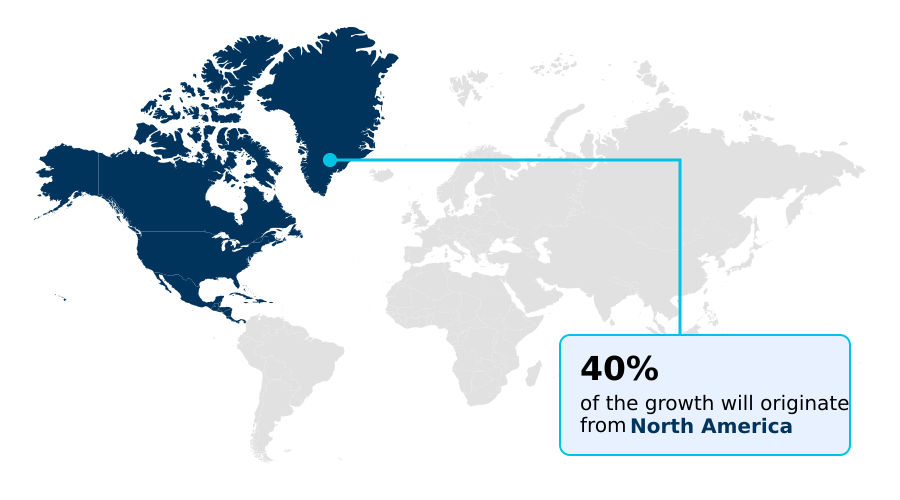
See How Utility Poles Market Demand is Rising in North America Get Free Sample

The geographic landscape reveals distinct regional contrasts in infrastructure deployment strategies between North America and APAC. North American operators prioritize highly resilient assets to protect overhead power lines, adopting ductile iron structures 30% faster than European counterparts.

By leveraging modular segmented structural designs, utilities achieve exceptional logistical deployment versatility, drastically accelerating rapid disaster recovery operations and restoring power 25% quicker following severe storms.

Conversely, the APAC region is rapidly expanding its high voltage electricity distribution networks to meet industrial demand.

To counter intense visual pollution opposition in dense Asian megacities, municipalities integrate communication hardware directly into tapered steel lighting supports, saving up to 18% in spatial footprint costs.

Furthermore, complex environmental mitigation strategies frequently dictate overhead line construction routing across both regions, forcing companies to adopt adaptive engineering techniques to secure necessary project approvals and maintain reliable grid expansion.

Market Dynamics

Our researchers analyzed the data with 2025 as the base year, along with the key drivers, trends, and challenges. A holistic analysis of drivers will help companies refine their marketing strategies to gain a competitive advantage.

  • The operational foundation of modern electricity networks relies on a strategic combination of robust materials and innovative engineering architectures. As utility providers seek to minimize service disruptions caused by extreme environmental conditions, the integration of advanced composite grid resilience structures has become increasingly critical.
  • These lightweight yet exceptionally strong assets offer superior longevity, frequently outlasting traditional materials by a margin of 20% to 30%, which significantly optimizes long-term lifecycle expenditures. In rural and suburban applications, operators continue to deploy the pressure treated timber distribution framework due to its cost-effectiveness and ease of field modification.
  • However, for critical transmission corridors carrying immense electrical loads, engineers overwhelmingly specify high voltage prestressed concrete supports to ensure maximum stability and minimal deflection under severe wind shear. When natural disasters inevitably compromise existing infrastructure, utility crews depend on modular segmented disaster recovery poles.
  • These interlocking systems can be transported via standard freight and assembled manually on-site, accelerating emergency grid restoration by eliminating the need for specialized heavy lifting equipment in rugged terrains. Concurrently, the rapid expansion of digital communication networks necessitates specialized vertical assets.
  • The deployment of smart grid telecommunications integration poles allows municipalities to co-locate cellular antennas and environmental sensors on shared physical assets, effectively streamlining urban infrastructure footprints while enhancing comprehensive grid monitoring capabilities.
What are the key market drivers leading to the rise in the adoption of Utility Poles Industry?

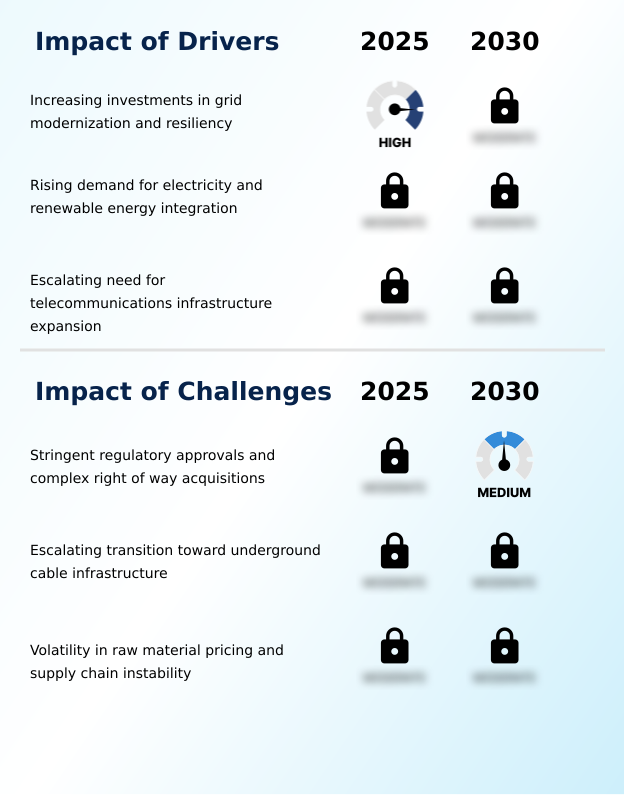
  • Increasing investments directed toward grid modernization and infrastructure resiliency serve as the primary driver propelling the expansion of the market.

  • Unprecedented capital investments directed toward comprehensive grid hardening strategies act as the primary catalyst propelling overhead infrastructure expansion.
  • The aggressive push for decentralized renewable energy integration requires utilities to rapidly construct robust high capacity transmission networks to connect remote generation sites with urban consumption centers.
  • By deploying long span infrastructure optimized for high voltage direct current, operators reduce bulk transmission power losses by nearly 18%. This expansion actively facilitates enhanced regional grid interconnectivity, supporting highly efficient and lucrative cross border energy trading.
  • Furthermore, the necessity for precise bidirectional power flow management demands sophisticated structural assets equipped with specialized protective coatings to ensure decades of reliable service.
  • Concurrently, installing communication nodes on these vertical assets guarantees reliable high speed data transmission across the network, optimizing overall operational visibility and drastically reducing unexpected grid downtime.

What are the market trends shaping the Utility Poles Industry?

  • The rising implementation of modular and segmented structural designs constitutes a pivotal trend shaping the market landscape.

  • The rapid integration of digital intelligence into physical utility infrastructure constitutes a transformative industry trend. Network operators are aggressively retrofitting traditional supports, such as pressure treated douglas fir treated with copper based wood preservatives, to accommodate modern advanced metering infrastructure.
  • By embedding automated environmental sensors and smart grid automated monitoring systems directly onto transmission framing components, utilities enhance real-time fault detection efficiency by up to 22%. Furthermore, the demand for extreme climatic event resistance drives the adoption of robust modular assets secured by high-strength friction slip joints, which improve dynamic load stability by 15% during severe winds.
  • To ensure maximum longevity, manufacturers are applying advanced galvanization protective coatings to steel structures, significantly mitigating corrosion risks. Continuous structural integrity testing validates these material enhancements, ultimately lowering long-term maintenance expenditures and establishing highly resilient, future-proof energy distribution networks.

What challenges does the Utility Poles Industry face during its growth?

  • Stringent regulatory approvals and complex right of way acquisitions present a substantial challenge impeding rapid infrastructure deployment and industry expansion.

  • Navigating complex regulatory frameworks and right-of-way acquisitions presents a severe challenge for expanding overhead distribution networks. The installation of new overhead physical infrastructure frequently faces intense public resistance and stringent zoning laws, which can delay critical grid expansion projects by up to 24 months.
  • Engineers must achieve exceptional load modeling precision to ensure high-capacity assets supporting massive bulk power movement comply with rigid safety clearances. Furthermore, the rapid advanced broadband cellular rollout places immense weight burdens on existing assets, forcing costly upgrades to deploy structurally reinforced integrated smart pole systems.
  • Operators also struggle to balance initial capital expenditures with the need for superior environmental degradation resistance in harsh climates. Additionally, complying with emerging environmental mandates requires the costly implementation of circular economy recycling protocols for end-of-life materials, directly straining utility maintenance budgets and complicating long-term operational planning.

Exclusive Technavio Analysis on Customer Landscape

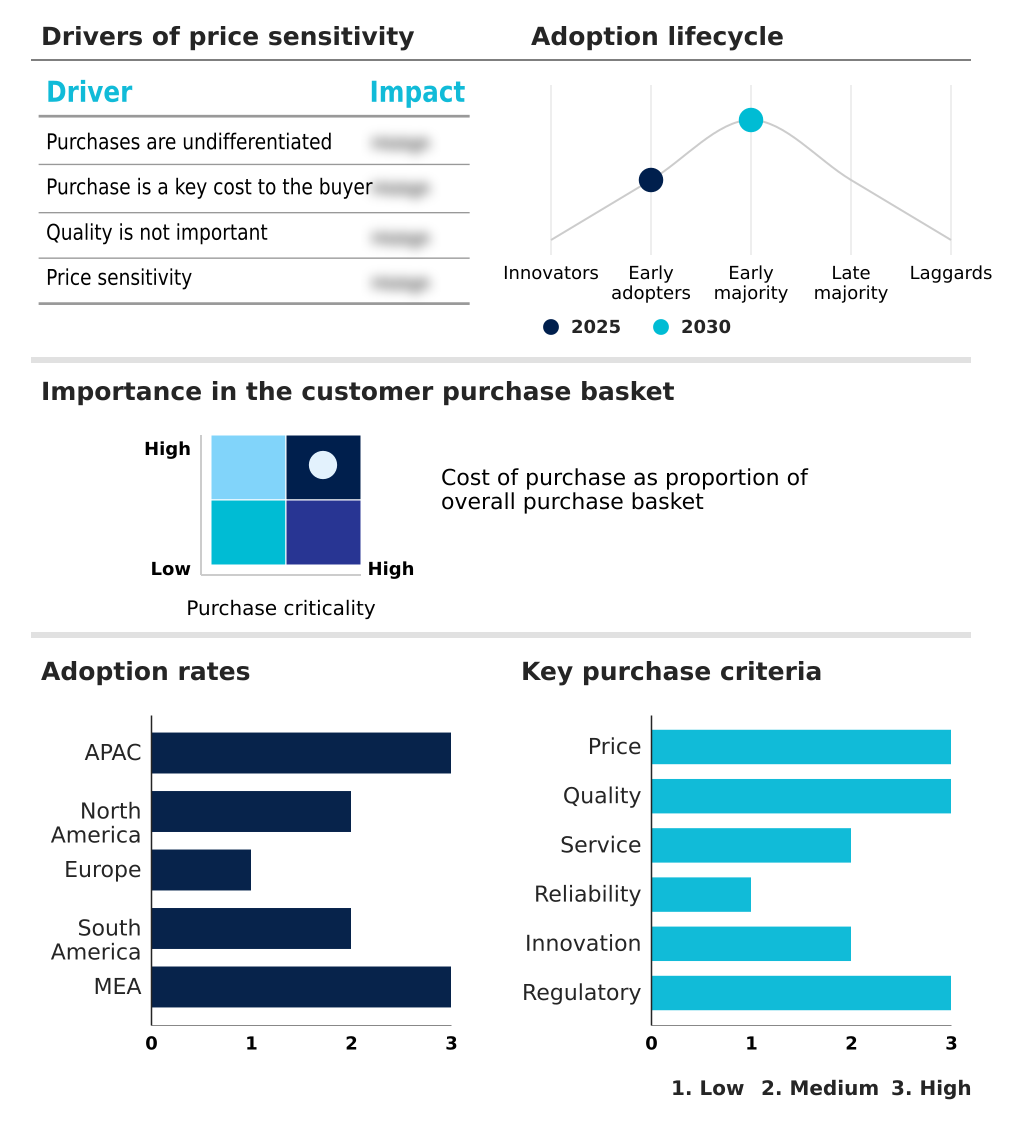
The utility poles market forecasting report includes the adoption lifecycle of the market, covering from the innovator’s stage to the laggard’s stage. It focuses on adoption rates in different regions based on penetration. Furthermore, the utility poles market report also includes key purchase criteria and drivers of price sensitivity to help companies evaluate and develop their market growth analysis strategies.
Customer Landscape of Utility Poles Industry

Competitive Landscape

Companies are implementing various strategies, such as strategic alliances, utility poles market forecast, partnerships, mergers and acquisitions, geographical expansion, and product/service launches, to enhance their presence in the industry.

Ameron Pole Products LLC - High-strength prestressed concrete and steel structures are offered for lighting, traffic control, and overhead distribution applications, ensuring durable infrastructure support across diverse municipal and commercial environments.

The industry research and growth report includes detailed analyses of the competitive landscape of the market and information about key companies, including:

  • Ameron Pole Products LLC
  • Bell Lumber and Pole Co.
  • Brooks Manufacturing Co.
  • CHM Industries Inc.
  • FUCHS Europoles GmbH
  • Hubbell Inc.
  • Kalpataru Projects International
  • KEC International Ltd.
  • Koppers Holdings Inc.
  • Laminated Wood Systems Inc.
  • McWane Poles
  • Pelco Products Inc.
  • Pultron Composites Ltd.
  • Sabre Industries Inc.
  • Skipper Ltd.
  • STELLA JONES INC.
  • Strongwell Corp.
  • TAPP Inc.
  • Valmont Industries Inc.

Qualitative and quantitative analysis of companies has been conducted to help clients understand the wider business environment as well as the strengths and weaknesses of key industry players. Data is qualitatively analyzed to categorize companies as pure play, category-focused, industry-focused, and diversified; it is quantitatively analyzed to categorize companies as dominant, leading, strong, tentative, and weak.

Recent Development and News in Utility poles market

  • In the Heavy Electrical Equipment industry, the aggressive deployment of smart grid automated monitoring systems and bidirectional metering hardware necessitated significantly higher load capacities, directly impacting Utility Poles demand by requiring structurally reinforced composite and steel supports.
  • The rapid transition toward decentralized renewable energy integration required extensive new high-voltage transmission corridors to connect remote wind farms to urban centers, fundamentally accelerating the procurement of heavy-duty Utility Poles.
  • Implementation of stricter environmental mitigation strategies limiting the use of copper based wood preservatives catalyzed a rapid supply chain shift, significantly increasing the adoption rates of fiberglass reinforced polymer Utility Poles by over 20% in coastal regions.
  • The integration of advanced broadband cellular rollout infrastructure onto existing electrical grids demanded complex structural modifications, prompting operators to upgrade aging Utility Poles with modular segmented structural designs capable of supporting multiple heavy antenna arrays simultaneously.

Dive into Technavio’s robust research methodology, blending expert interviews, extensive data synthesis, and validated models for unparalleled Utility Poles Market insights. See full methodology.

Market Scope
Page number 289
Base year 2025
Historic period 2020-2024
Forecast period 2026-2030
Growth momentum & CAGR Accelerate at a CAGR of 3.5%
Market growth 2026-2030 USD 9587.0 million
Market structure Fragmented
YoY growth 2025-2026(%) 3.3%
Key countries China, India, Australia, Indonesia, Japan, South Korea, US, Canada, Mexico, France, Germany, UK, Italy, Spain, The Netherlands, Brazil, Argentina, Chile, Saudi Arabia, UAE, South Africa, Turkey and Israel
Competitive landscape Leading Companies, Market Positioning of Companies, Competitive Strategies, and Industry Risks

Request Free Sample

Research Analyst Overview

  • The continuous evolution of vertical infrastructure is fundamentally altering operational methodologies within the utility sector. Network operators are aggressively prioritizing comprehensive grid hardening strategies to mitigate the devastating impacts of severe climatic events. Traditional materials, such as pressure treated douglas fir utilizing copper based wood preservatives, remain prevalent in rural distribution due to their initial cost advantages.
  • However, the expansion of high capacity transmission networks necessitates highly engineered solutions with superior longevity. By implementing advanced galvanization protective coatings on steel structures, utilities have successfully extended asset lifespans by over 35%, drastically reducing long-term replacement frequency. Furthermore, modern structures featuring friction slip joints offer unparalleled stability under extreme dynamic loads.
  • This structural reliability is paramount as grids transition toward decentralized energy, requiring sophisticated bidirectional power flow management to balance fluctuating supply. The integration of smart grid automated monitoring hardware directly onto these overhead supports ensures real-time performance tracking, empowering decision-makers to optimize maintenance budgets seamlessly.

What are the Key Data Covered in this Utility Poles Market Research and Growth Report?

  • What is the expected growth of the Utility Poles Market between 2026 and 2030?

    • USD 9.59 billion, at a CAGR of 3.5%

  • What segmentation does the market report cover?

    • The report is segmented by Type (Distribution poles, and Transmission poles), Material (Steel, Concrete, Composite, and Wood), Application (Transmission line, Distribution line, Telecommunication, and Others) and Geography (APAC, North America, Europe, South America, Middle East and Africa)

  • Which regions are analyzed in the report?

    • APAC, North America, Europe, South America and Middle East and Africa

  • What are the key growth drivers and market challenges?

    • Increasing investments in grid modernization and resiliency, Stringent regulatory approvals and complex right of way acquisitions

  • Who are the major players in the Utility Poles Market?

    • Ameron Pole Products LLC, Bell Lumber and Pole Co., Brooks Manufacturing Co., CHM Industries Inc., FUCHS Europoles GmbH, Hubbell Inc., Kalpataru Projects International, KEC International Ltd., Koppers Holdings Inc., Laminated Wood Systems Inc., McWane Poles, Pelco Products Inc., Pultron Composites Ltd., Sabre Industries Inc., Skipper Ltd., STELLA JONES INC., Strongwell Corp., TAPP Inc. and Valmont Industries Inc.

Market Research Insights

  • The market for utility structures is experiencing rapid transformation as network operators prioritize proactive grid hardening to safeguard critical energy distribution. By adopting resilient composite materials, utilities achieve exceptional extreme climatic event resistance, significantly reducing infrastructure vulnerability. This material transition accelerates rapid disaster recovery operations, allowing maintenance crews to restore power 30% faster following severe weather events.
  • Furthermore, integrating advanced metering infrastructure directly onto overhead supports improves proactive grid monitoring efficiency by 18%, substantially minimizing unexpected service outages. These strategic physical upgrades ultimately optimize long-term operational expenditures and ensure highly reliable electricity delivery across demanding geographic terrains, aligning seamlessly with modern compliance and sustainability mandates.

We can help! Our analysts can customize this utility poles market research report to meet your requirements.

Get in touch

1. Executive Summary

1.1 Market overview

Executive Summary - Chart on Market Overview
Executive Summary - Data Table on Market Overview
Executive Summary - Chart on Global Market Characteristics
Executive Summary - Chart on Market by Geography
Executive Summary - Chart on Market Segmentation by Type
Executive Summary - Chart on Market Segmentation by Material
Executive Summary - Chart on Market Segmentation by Application
Executive Summary - Chart on Incremental Growth
Executive Summary - Data Table on Incremental Growth
Executive Summary - Chart on Company Market Positioning

2. Technavio Analysis

2.1 Analysis of price sensitivity, lifecycle, customer purchase basket, adoption rates, and purchase criteria

2.2 Criticality of inputs and Factors of differentiation

Chart on Overview on criticality of inputs and factors of differentiation

2.3 Factors of disruption

Chart on Overview on factors of disruption

2.4 Impact of drivers and challenges

Chart on Impact of drivers and challenges in 2025 and 2030

3. Market Landscape

3.1 Market ecosystem

Chart on Parent Market
Data Table on - Parent Market

3.2 Market characteristics

Chart on Market characteristics analysis

3.3 Value chain analysis

Chart on Value chain analysis

4. Market Sizing

4.1 Market definition

Data Table on Offerings of companies included in the market definition

4.2 Market segment analysis

Market segments

4.3 Market size 2025

4.4 Market outlook: Forecast for 2025-2030

Chart on Global - Market size and forecast 2025-2030 ($ million)
Data Table on Global - Market size and forecast 2025-2030 ($ million)
Chart on Global Market: Year-over-year growth 2025-2030 (%)
Data Table on Global Market: Year-over-year growth 2025-2030 (%)

5. Historic Market Size

5.1 Global Utility Poles Market 2020 - 2024

Historic Market Size - Data Table on Global Utility Poles Market 2020 - 2024 ($ million)

5.2 Type segment analysis 2020 - 2024

Historic Market Size - Type Segment 2020 - 2024 ($ million)

5.3 Material segment analysis 2020 - 2024

Historic Market Size - Material Segment 2020 - 2024 ($ million)

5.4 Application segment analysis 2020 - 2024

Historic Market Size - Application Segment 2020 - 2024 ($ million)

5.5 Geography segment analysis 2020 - 2024

Historic Market Size - Geography Segment 2020 - 2024 ($ million)

5.6 Country segment analysis 2020 - 2024

Historic Market Size - Country Segment 2020 - 2024 ($ million)

6. Qualitative Analysis

6.1 Impact of AI on global utility poles market

6.2 Impact of geopolitical conflicts on global utility poles market

7. Five Forces Analysis

7.1 Five forces summary

Five forces analysis - Comparison between 2025 and 2030

7.2 Bargaining power of buyers

Bargaining power of buyers - Impact of key factors 2025 and 2030

7.3 Bargaining power of suppliers

Bargaining power of suppliers - Impact of key factors in 2025 and 2030

7.4 Threat of new entrants

Threat of new entrants - Impact of key factors in 2025 and 2030

7.5 Threat of substitutes

Threat of substitutes - Impact of key factors in 2025 and 2030

7.6 Threat of rivalry

Threat of rivalry - Impact of key factors in 2025 and 2030

7.7 Market condition

Chart on Market condition - Five forces 2025 and 2030

8. Market Segmentation by Type

8.1 Market segments

Chart on Type - Market share 2025-2030 (%)
Data Table on Type - Market share 2025-2030 (%)

8.2 Comparison by Type

Chart on Comparison by Type
Data Table on Comparison by Type

8.3 Distribution poles - Market size and forecast 2025-2030

Chart on Distribution poles - Market size and forecast 2025-2030 ($ million)
Data Table on Distribution poles - Market size and forecast 2025-2030 ($ million)
Chart on Distribution poles - Year-over-year growth 2025-2030 (%)
Data Table on Distribution poles - Year-over-year growth 2025-2030 (%)

8.4 Transmission poles - Market size and forecast 2025-2030

Chart on Transmission poles - Market size and forecast 2025-2030 ($ million)
Data Table on Transmission poles - Market size and forecast 2025-2030 ($ million)
Chart on Transmission poles - Year-over-year growth 2025-2030 (%)
Data Table on Transmission poles - Year-over-year growth 2025-2030 (%)

8.5 Market opportunity by Type

Market opportunity by Type ($ million)
Data Table on Market opportunity by Type ($ million)

9. Market Segmentation by Material

9.1 Market segments

Chart on Material - Market share 2025-2030 (%)
Data Table on Material - Market share 2025-2030 (%)

9.2 Comparison by Material

Chart on Comparison by Material
Data Table on Comparison by Material

9.3 Steel - Market size and forecast 2025-2030

Chart on Steel - Market size and forecast 2025-2030 ($ million)
Data Table on Steel - Market size and forecast 2025-2030 ($ million)
Chart on Steel - Year-over-year growth 2025-2030 (%)
Data Table on Steel - Year-over-year growth 2025-2030 (%)

9.4 Concrete - Market size and forecast 2025-2030

Chart on Concrete - Market size and forecast 2025-2030 ($ million)
Data Table on Concrete - Market size and forecast 2025-2030 ($ million)
Chart on Concrete - Year-over-year growth 2025-2030 (%)
Data Table on Concrete - Year-over-year growth 2025-2030 (%)

9.5 Composite - Market size and forecast 2025-2030

Chart on Composite - Market size and forecast 2025-2030 ($ million)
Data Table on Composite - Market size and forecast 2025-2030 ($ million)
Chart on Composite - Year-over-year growth 2025-2030 (%)
Data Table on Composite - Year-over-year growth 2025-2030 (%)

9.6 Wood - Market size and forecast 2025-2030

Chart on Wood - Market size and forecast 2025-2030 ($ million)
Data Table on Wood - Market size and forecast 2025-2030 ($ million)
Chart on Wood - Year-over-year growth 2025-2030 (%)
Data Table on Wood - Year-over-year growth 2025-2030 (%)

9.7 Market opportunity by Material

Market opportunity by Material ($ million)
Data Table on Market opportunity by Material ($ million)

10. Market Segmentation by Application

10.1 Market segments

Chart on Application - Market share 2025-2030 (%)
Data Table on Application - Market share 2025-2030 (%)

10.2 Comparison by Application

Chart on Comparison by Application
Data Table on Comparison by Application

10.3 Transmission line - Market size and forecast 2025-2030

Chart on Transmission line - Market size and forecast 2025-2030 ($ million)
Data Table on Transmission line - Market size and forecast 2025-2030 ($ million)
Chart on Transmission line - Year-over-year growth 2025-2030 (%)
Data Table on Transmission line - Year-over-year growth 2025-2030 (%)

10.4 Distribution line - Market size and forecast 2025-2030

Chart on Distribution line - Market size and forecast 2025-2030 ($ million)
Data Table on Distribution line - Market size and forecast 2025-2030 ($ million)
Chart on Distribution line - Year-over-year growth 2025-2030 (%)
Data Table on Distribution line - Year-over-year growth 2025-2030 (%)

10.5 Telecommunication - Market size and forecast 2025-2030

Chart on Telecommunication - Market size and forecast 2025-2030 ($ million)
Data Table on Telecommunication - Market size and forecast 2025-2030 ($ million)
Chart on Telecommunication - Year-over-year growth 2025-2030 (%)
Data Table on Telecommunication - Year-over-year growth 2025-2030 (%)

10.6 Others - Market size and forecast 2025-2030

Chart on Others - Market size and forecast 2025-2030 ($ million)
Data Table on Others - Market size and forecast 2025-2030 ($ million)
Chart on Others - Year-over-year growth 2025-2030 (%)
Data Table on Others - Year-over-year growth 2025-2030 (%)

10.7 Market opportunity by Application

Market opportunity by Application ($ million)
Data Table on Market opportunity by Application ($ million)

11. Customer Landscape

11.1 Customer landscape overview

Analysis of price sensitivity, lifecycle, customer purchase basket, adoption rates, and purchase criteria

12. Geographic Landscape

12.1 Geographic segmentation

Chart on Market share by geography 2025-2030 (%)
Data Table on Market share by geography 2025-2030 (%)

12.2 Geographic comparison

Chart on Geographic comparison
Data Table on Geographic comparison

12.3 APAC - Market size and forecast 2025-2030

Chart on APAC - Market size and forecast 2025-2030 ($ million)
Data Table on APAC - Market size and forecast 2025-2030 ($ million)
Chart on APAC - Year-over-year growth 2025-2030 (%)
Data Table on APAC - Year-over-year growth 2025-2030 (%)
Chart on Regional Comparison - APAC
Data Table on Regional Comparison - APAC

12.3.1 China - Market size and forecast 2025-2030

Chart on China - Market size and forecast 2025-2030 ($ million)
Data Table on China - Market size and forecast 2025-2030 ($ million)
Chart on China - Year-over-year growth 2025-2030 (%)
Data Table on China - Year-over-year growth 2025-2030 (%)

12.3.2 India - Market size and forecast 2025-2030

Chart on India - Market size and forecast 2025-2030 ($ million)
Data Table on India - Market size and forecast 2025-2030 ($ million)
Chart on India - Year-over-year growth 2025-2030 (%)
Data Table on India - Year-over-year growth 2025-2030 (%)

12.3.3 Australia - Market size and forecast 2025-2030

Chart on Australia - Market size and forecast 2025-2030 ($ million)
Data Table on Australia - Market size and forecast 2025-2030 ($ million)
Chart on Australia - Year-over-year growth 2025-2030 (%)
Data Table on Australia - Year-over-year growth 2025-2030 (%)

12.3.4 Indonesia - Market size and forecast 2025-2030

Chart on Indonesia - Market size and forecast 2025-2030 ($ million)
Data Table on Indonesia - Market size and forecast 2025-2030 ($ million)
Chart on Indonesia - Year-over-year growth 2025-2030 (%)
Data Table on Indonesia - Year-over-year growth 2025-2030 (%)

12.3.5 Japan - Market size and forecast 2025-2030

Chart on Japan - Market size and forecast 2025-2030 ($ million)
Data Table on Japan - Market size and forecast 2025-2030 ($ million)
Chart on Japan - Year-over-year growth 2025-2030 (%)
Data Table on Japan - Year-over-year growth 2025-2030 (%)

12.3.6 South Korea - Market size and forecast 2025-2030

Chart on South Korea - Market size and forecast 2025-2030 ($ million)
Data Table on South Korea - Market size and forecast 2025-2030 ($ million)
Chart on South Korea - Year-over-year growth 2025-2030 (%)
Data Table on South Korea - Year-over-year growth 2025-2030 (%)

12.4 North America - Market size and forecast 2025-2030

Chart on North America - Market size and forecast 2025-2030 ($ million)
Data Table on North America - Market size and forecast 2025-2030 ($ million)
Chart on North America - Year-over-year growth 2025-2030 (%)
Data Table on North America - Year-over-year growth 2025-2030 (%)
Chart on Regional Comparison - North America
Data Table on Regional Comparison - North America

12.4.1 US - Market size and forecast 2025-2030

Chart on US - Market size and forecast 2025-2030 ($ million)
Data Table on US - Market size and forecast 2025-2030 ($ million)
Chart on US - Year-over-year growth 2025-2030 (%)
Data Table on US - Year-over-year growth 2025-2030 (%)

12.4.2 Canada - Market size and forecast 2025-2030

Chart on Canada - Market size and forecast 2025-2030 ($ million)
Data Table on Canada - Market size and forecast 2025-2030 ($ million)
Chart on Canada - Year-over-year growth 2025-2030 (%)
Data Table on Canada - Year-over-year growth 2025-2030 (%)

12.4.3 Mexico - Market size and forecast 2025-2030

Chart on Mexico - Market size and forecast 2025-2030 ($ million)
Data Table on Mexico - Market size and forecast 2025-2030 ($ million)
Chart on Mexico - Year-over-year growth 2025-2030 (%)
Data Table on Mexico - Year-over-year growth 2025-2030 (%)

12.5 Europe - Market size and forecast 2025-2030

Chart on Europe - Market size and forecast 2025-2030 ($ million)
Data Table on Europe - Market size and forecast 2025-2030 ($ million)
Chart on Europe - Year-over-year growth 2025-2030 (%)
Data Table on Europe - Year-over-year growth 2025-2030 (%)
Chart on Regional Comparison - Europe
Data Table on Regional Comparison - Europe

12.5.1 France - Market size and forecast 2025-2030

Chart on France - Market size and forecast 2025-2030 ($ million)
Data Table on France - Market size and forecast 2025-2030 ($ million)
Chart on France - Year-over-year growth 2025-2030 (%)
Data Table on France - Year-over-year growth 2025-2030 (%)

12.5.2 Germany - Market size and forecast 2025-2030

Chart on Germany - Market size and forecast 2025-2030 ($ million)
Data Table on Germany - Market size and forecast 2025-2030 ($ million)
Chart on Germany - Year-over-year growth 2025-2030 (%)
Data Table on Germany - Year-over-year growth 2025-2030 (%)

12.5.3 UK - Market size and forecast 2025-2030

Chart on UK - Market size and forecast 2025-2030 ($ million)
Data Table on UK - Market size and forecast 2025-2030 ($ million)
Chart on UK - Year-over-year growth 2025-2030 (%)
Data Table on UK - Year-over-year growth 2025-2030 (%)

12.5.4 Italy - Market size and forecast 2025-2030

Chart on Italy - Market size and forecast 2025-2030 ($ million)
Data Table on Italy - Market size and forecast 2025-2030 ($ million)
Chart on Italy - Year-over-year growth 2025-2030 (%)
Data Table on Italy - Year-over-year growth 2025-2030 (%)

12.5.5 Spain - Market size and forecast 2025-2030

Chart on Spain - Market size and forecast 2025-2030 ($ million)
Data Table on Spain - Market size and forecast 2025-2030 ($ million)
Chart on Spain - Year-over-year growth 2025-2030 (%)
Data Table on Spain - Year-over-year growth 2025-2030 (%)

12.5.6 The Netherlands - Market size and forecast 2025-2030

Chart on The Netherlands - Market size and forecast 2025-2030 ($ million)
Data Table on The Netherlands - Market size and forecast 2025-2030 ($ million)
Chart on The Netherlands - Year-over-year growth 2025-2030 (%)
Data Table on The Netherlands - Year-over-year growth 2025-2030 (%)

12.6 South America - Market size and forecast 2025-2030

Chart on South America - Market size and forecast 2025-2030 ($ million)
Data Table on South America - Market size and forecast 2025-2030 ($ million)
Chart on South America - Year-over-year growth 2025-2030 (%)
Data Table on South America - Year-over-year growth 2025-2030 (%)
Chart on Regional Comparison - South America
Data Table on Regional Comparison - South America

12.6.1 Brazil - Market size and forecast 2025-2030

Chart on Brazil - Market size and forecast 2025-2030 ($ million)
Data Table on Brazil - Market size and forecast 2025-2030 ($ million)
Chart on Brazil - Year-over-year growth 2025-2030 (%)
Data Table on Brazil - Year-over-year growth 2025-2030 (%)

12.6.2 Argentina - Market size and forecast 2025-2030

Chart on Argentina - Market size and forecast 2025-2030 ($ million)
Data Table on Argentina - Market size and forecast 2025-2030 ($ million)
Chart on Argentina - Year-over-year growth 2025-2030 (%)
Data Table on Argentina - Year-over-year growth 2025-2030 (%)

12.6.3 Chile - Market size and forecast 2025-2030

Chart on Chile - Market size and forecast 2025-2030 ($ million)
Data Table on Chile - Market size and forecast 2025-2030 ($ million)
Chart on Chile - Year-over-year growth 2025-2030 (%)
Data Table on Chile - Year-over-year growth 2025-2030 (%)

12.7 Middle East and Africa - Market size and forecast 2025-2030

Chart on Middle East and Africa - Market size and forecast 2025-2030 ($ million)
Data Table on Middle East and Africa - Market size and forecast 2025-2030 ($ million)
Chart on Middle East and Africa - Year-over-year growth 2025-2030 (%)
Data Table on Middle East and Africa - Year-over-year growth 2025-2030 (%)
Chart on Regional Comparison - Middle East and Africa
Data Table on Regional Comparison - Middle East and Africa

12.7.1 Saudi Arabia - Market size and forecast 2025-2030

Chart on Saudi Arabia - Market size and forecast 2025-2030 ($ million)
Data Table on Saudi Arabia - Market size and forecast 2025-2030 ($ million)
Chart on Saudi Arabia - Year-over-year growth 2025-2030 (%)
Data Table on Saudi Arabia - Year-over-year growth 2025-2030 (%)

12.7.2 UAE - Market size and forecast 2025-2030

Chart on UAE - Market size and forecast 2025-2030 ($ million)
Data Table on UAE - Market size and forecast 2025-2030 ($ million)
Chart on UAE - Year-over-year growth 2025-2030 (%)
Data Table on UAE - Year-over-year growth 2025-2030 (%)

12.7.3 South Africa - Market size and forecast 2025-2030

Chart on South Africa - Market size and forecast 2025-2030 ($ million)
Data Table on South Africa - Market size and forecast 2025-2030 ($ million)
Chart on South Africa - Year-over-year growth 2025-2030 (%)
Data Table on South Africa - Year-over-year growth 2025-2030 (%)

12.7.4 Turkey - Market size and forecast 2025-2030

Chart on Turkey - Market size and forecast 2025-2030 ($ million)
Data Table on Turkey - Market size and forecast 2025-2030 ($ million)
Chart on Turkey - Year-over-year growth 2025-2030 (%)
Data Table on Turkey - Year-over-year growth 2025-2030 (%)

12.7.5 Israel - Market size and forecast 2025-2030

Chart on Israel - Market size and forecast 2025-2030 ($ million)
Data Table on Israel - Market size and forecast 2025-2030 ($ million)
Chart on Israel - Year-over-year growth 2025-2030 (%)
Data Table on Israel - Year-over-year growth 2025-2030 (%)

12.8 Market opportunity by geography

Market opportunity by geography ($ million)
Data Tables on Market opportunity by geography ($ million)

13. Drivers, Challenges, and Opportunity

13.1 Market drivers

Increasing investments in grid modernization and resiliency
Rising demand for electricity and renewable energy integration
Escalating need for telecommunications infrastructure expansion

13.2 Market challenges

Stringent regulatory approvals and complex right of way acquisitions
Escalating transition toward underground cable infrastructure
Volatility in raw material pricing and supply chain instability

13.3 Impact of drivers and challenges

Impact of drivers and challenges in 2025 and 2030

13.4 Market opportunities

Rising implementation of modular and segmented structural designs
Shift toward environmentally sustainable wood preservation technologies
Accelerated adoption of advanced composite materials

14. Competitive Landscape

14.1 Overview

14.2

Overview on criticality of inputs and factors of differentiation

14.3 Landscape disruption

Overview on factors of disruption

14.4 Industry risks

Impact of key risks on business

15. Competitive Analysis

15.1 Companies profiled

Companies covered

15.2 Company ranking index

15.3 Market positioning of companies

Matrix on companies position and classification

15.4 Ameron Pole Products LLC

Ameron Pole Products LLC - Overview
Ameron Pole Products LLC - Product / Service
Ameron Pole Products LLC - Key offerings
SWOT

15.5 Bell Lumber and Pole Co.

Bell Lumber and Pole Co. - Overview
Bell Lumber and Pole Co. - Product / Service
Bell Lumber and Pole Co. - Key offerings
SWOT

15.6 Brooks Manufacturing Co.

Brooks Manufacturing Co. - Overview
Brooks Manufacturing Co. - Product / Service
Brooks Manufacturing Co. - Key offerings
SWOT

15.7 CHM Industries Inc.

CHM Industries Inc. - Overview
CHM Industries Inc. - Product / Service
CHM Industries Inc. - Key offerings
SWOT

15.8 FUCHS Europoles GmbH

FUCHS Europoles GmbH - Overview
FUCHS Europoles GmbH - Product / Service
FUCHS Europoles GmbH - Key offerings
SWOT

15.9 Hubbell Inc.

Hubbell Inc. - Overview
Hubbell Inc. - Business segments
Hubbell Inc. - Key offerings
Hubbell Inc. - Segment focus
SWOT

15.10 Kalpataru Projects International

Kalpataru Projects International - Overview
Kalpataru Projects International - Business segments
Kalpataru Projects International - Key offerings
Kalpataru Projects International - Segment focus
SWOT

15.11 KEC International Ltd.

KEC International Ltd. - Overview
KEC International Ltd. - Product / Service
KEC International Ltd. - Key offerings
SWOT

15.12 Koppers Holdings Inc.

Koppers Holdings Inc. - Overview
Koppers Holdings Inc. - Business segments
Koppers Holdings Inc. - Key offerings
Koppers Holdings Inc. - Segment focus
SWOT

15.13 McWane Poles

McWane Poles - Overview
McWane Poles - Product / Service
McWane Poles - Key offerings
SWOT

15.14 Pelco Products Inc.

Pelco Products Inc. - Overview
Pelco Products Inc. - Product / Service
Pelco Products Inc. - Key offerings
SWOT

15.15 Pultron Composites Ltd.

Pultron Composites Ltd. - Overview
Pultron Composites Ltd. - Product / Service
Pultron Composites Ltd. - Key offerings
SWOT

15.16 Skipper Ltd.

Skipper Ltd. - Overview
Skipper Ltd. - Business segments
Skipper Ltd. - Key offerings
Skipper Ltd. - Segment focus
SWOT

15.17 Strongwell Corp.

Strongwell Corp. - Overview
Strongwell Corp. - Product / Service
Strongwell Corp. - Key offerings
SWOT

15.18 Valmont Industries Inc.

Valmont Industries Inc. - Overview
Valmont Industries Inc. - Business segments
Valmont Industries Inc. - Key offerings
Valmont Industries Inc. - Segment focus
SWOT

16. Appendix

16.1 Scope of the report

Market definition
Objectives
Notes and caveats

16.2 Inclusions and exclusions checklist

Inclusions checklist
Exclusions checklist

16.3 Currency conversion rates for US$

16.4 Research methodology

16.5 Data procurement

Information sources

16.6 Data validation

16.7 Validation techniques employed for market sizing

16.8 Data synthesis

16.9 360 degree market analysis

16.10 List of abbreviations

Research Methodology

Technavio presents a detailed picture of the market by way of study, synthesis, and summation of data from multiple sources. The analysts have presented the various facets of the market with a particular focus on identifying the key industry influencers. The data thus presented is comprehensive, reliable, and the result of extensive research, both primary and secondary.

INFORMATION SOURCES

Primary sources

  • Manufacturers and suppliers
  • Channel partners
  • Industry experts
  • Strategic decision makers

Secondary sources

  • Industry journals and periodicals
  • Government data
  • Financial reports of key industry players
  • Historical data
  • Press releases

DATA ANALYSIS

Data Synthesis

  • Collation of data
  • Estimation of key figures
  • Analysis of derived insights

Data Validation

  • Triangulation with data models
  • Reference against proprietary databases
  • Corroboration with industry experts

REPORT WRITING

Qualitative

  • Market drivers
  • Market challenges
  • Market trends
  • Five forces analysis

Quantitative

  • Market size and forecast
  • Market segmentation
  • Geographical insights
  • Competitive landscape

Interested in this report?

Get your sample now to see our research methodology and insights!

Download Now

Frequently Asked Questions

Utility Poles market growth will increase by USD 9587.0 million during 2026-2030.

The Utility Poles market is expected to grow at a CAGR of 3.5% during 2026-2030.

Utility Poles market is segmented by Type (Distribution poles, Transmission poles) Material (Steel, Concrete, Composite, Wood) Application (Transmission line, Distribution line, Telecommunication, Others)

Ameron Pole Products LLC, Bell Lumber and Pole Co., Brooks Manufacturing Co., CHM Industries Inc., FUCHS Europoles GmbH, Hubbell Inc., Kalpataru Projects International, KEC International Ltd., Koppers Holdings Inc., Laminated Wood Systems Inc., McWane Poles, Pelco Products Inc., Pultron Composites Ltd., Sabre Industries Inc., Skipper Ltd., STELLA JONES INC., Strongwell Corp., TAPP Inc., Valmont Industries Inc. are a few of the key vendors in the Utility Poles market.

North America will register the highest growth rate of 40.4% among the other regions. Therefore, the Utility Poles market in North America is expected to garner significant business opportunities for the vendors during the forecast period.

China, India, Australia, Indonesia, Japan, South Korea, US, Canada, Mexico, France, Germany, UK, Italy, Spain, The Netherlands, Brazil, Argentina, Chile, Saudi Arabia, UAE, South Africa, Turkey, Israel

  • Increasing investments in grid modernization and resiliency is the driving factor this market.

The Utility Poles market vendors should focus on grabbing business opportunities from the Type segment as it accounted for the largest market share in the base year.
RIA - Research AI Assistant
Ask RIA
