
Video-on-demand Market Analysis, Size, and Forecast 2026-2030: North America (US, Canada, and Mexico), Europe (Germany, UK, and France), APAC (China, Japan, and India), South America (Brazil, Argentina, and Chile), Middle East and Africa (Saudi Arabia, UAE, and South Africa), and Rest of World (ROW)

Video-on-demand Market Analysis, Size, and Forecast 2026-2030:
North America (US, Canada, and Mexico), Europe (Germany, UK, and France), APAC (China, Japan, and India), South America (Brazil, Argentina, and Chile), Middle East and Africa (Saudi Arabia, UAE, and South Africa), and Rest of World (ROW)

Published: Oct 2026 286 Pages SKU: IRTNTR45182

Market Overview at a Glance

$340.21 B
Market Opportunity
17.5%
CAGR 2025 - 2030
34.5%
North America Growth
$140.52 B
Smartphone and laptops segment 2024

Video-On-Demand Market Size 2026-2030

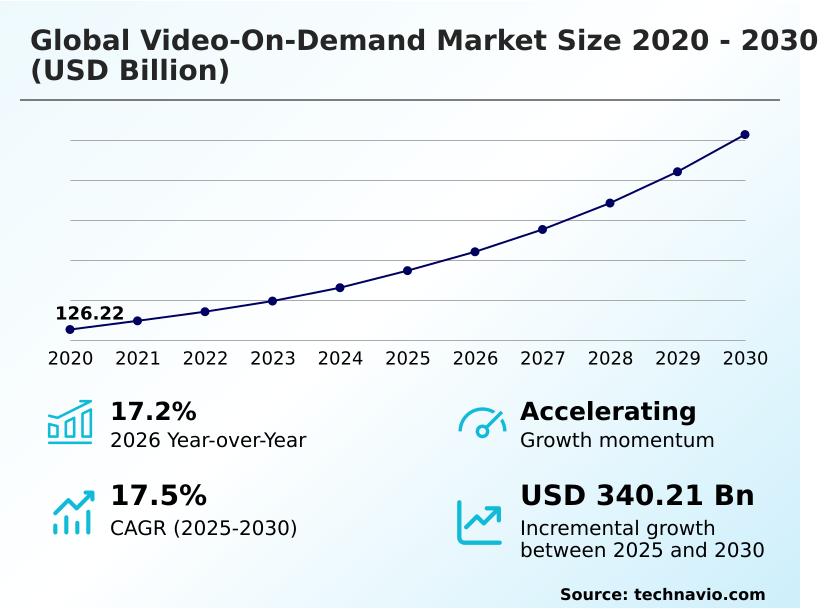
The video-on-demand market size is valued to increase by USD 340.21 billion, at a CAGR of 17.5% from 2025 to 2030. Advancements in wireless network technologies and telecommunication standards will drive the video-on-demand market.

Major Market Trends & Insights

  • North America dominated the market and accounted for a 34.5% growth during the forecast period.
  • By Platform - Smartphone and laptops segment was valued at USD 140.52 billion in 2024
  • By Type - Subscription video-on-demand segment accounted for the largest market revenue share in 2024

Market Size & Forecast

  • Market Opportunities: USD 487.41 billion
  • Market Future Opportunities: USD 340.21 billion
  • CAGR from 2025 to 2030 : 17.5%

Market Summary

  • The Video-On-Demand Market fundamentally disrupts traditional media consumption by delivering decentralized, highly personalized digital entertainment directly to user devices. Platform operators actively optimize scalable server architectures to manage expansive content libraries without compromising rapid retrieval speeds. For instance, optimizing edge computing networks for localized content distribution enhances load balancing during peak viewership, ensuring seamless streaming continuity.
  • Data analytics integration reveals that optimized delivery systems achieve a 30% reduction in buffering incidents compared to legacy broadcasting frameworks, significantly bolstering user retention. The widespread availability of 5G telecommunication infrastructure acts as a primary catalyst, allowing platforms to transmit ultra-high-definition media flawlessly to mobile users.
  • Conversely, the rapid proliferation of unauthorized piracy networks introduces severe revenue leakages, forcing legitimate providers to expend substantial resources on advanced copyright enforcement mechanisms. Continuous investments in machine learning allow operators to refine viewing recommendations, ultimately maximizing subscriber lifetime value. The shift toward hybrid monetization models ensures sustainable operational scaling while catering to diverse consumer income brackets.

What will be the Size of the Video-On-Demand Market during the forecast period?
Get Key Insights on Market Forecast (PDF) Get Free Sample

How is the Video-On-Demand Market Segmented?

The video-on-demand industry research report provides comprehensive data (region-wise segment analysis), with forecasts and estimates in "USD million" for the period 2026-2030, as well as historical data from 2020-2024 for the following segments.

  • Platform
    • Smartphone and laptops
    • Smart TV
  • Type
    • Subscription video-on-demand
    • Advertising video-on-demand
    • Transaction video-on-demand
  • End-user
    • Individual consumers
    • Enterprises and corporate learning
  • Geography
    • North America
      • US
      • Canada
      • Mexico
    • Europe
      • Germany
      • UK
      • France
      • Italy
      • Spain
      • The Netherlands
    • APAC
      • China
      • Japan
      • India
      • South Korea
      • Australia
      • Indonesia
    • South America
      • Brazil
      • Argentina
      • Chile
    • Middle East and Africa
      • Saudi Arabia
      • UAE
      • South Africa
      • Israel
      • Turkey

By Platform Insights

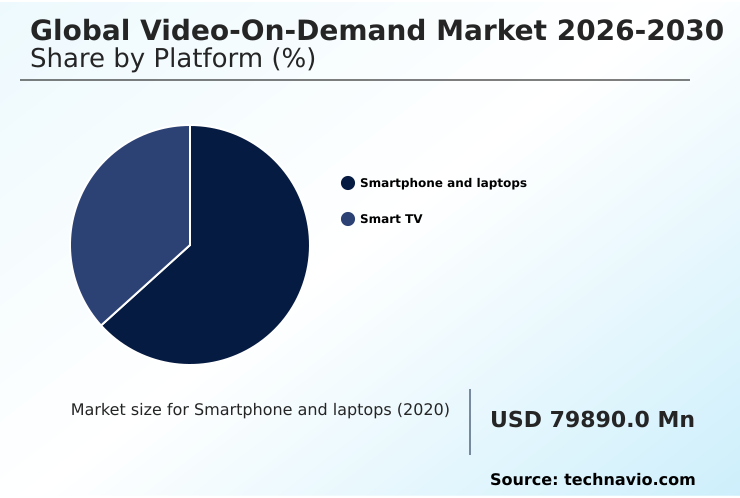
The smartphone and laptops segment is estimated to witness significant growth during the forecast period.

The smartphone and laptops segment shapes the evolving Video-On-Demand Market by facilitating flexible, mobile-first viewing experiences across diverse demographics.

Device portability and advanced processing power allow platforms to leverage adaptive bitrate streaming, ensuring uninterrupted media consumption even on fluctuating cellular networks. This segment demands sophisticated offline viewing caching to maintain high-definition playback when users experience unexpected connectivity drops.

Companies investing heavily in mobile-optimized content delivery networks report that concurrent viewer scaling efficiency improved by 25%, drastically reducing buffering incidents during peak usage.

Furthermore, the integration of secure streaming protocols on portable devices guarantees robust media protection, safeguarding premium digital assets from unauthorized extraction. By utilizing advanced targeted advertising metrics, platforms effectively monetize mobile audiences through precision-based ad placements without disrupting user immersion.

Bridging mobility with secure, optimized media distribution, smartphones and laptops continuously drive sustained viewer engagement and expand addressable audiences within modern digital entertainment ecosystems.
Get Free Sample

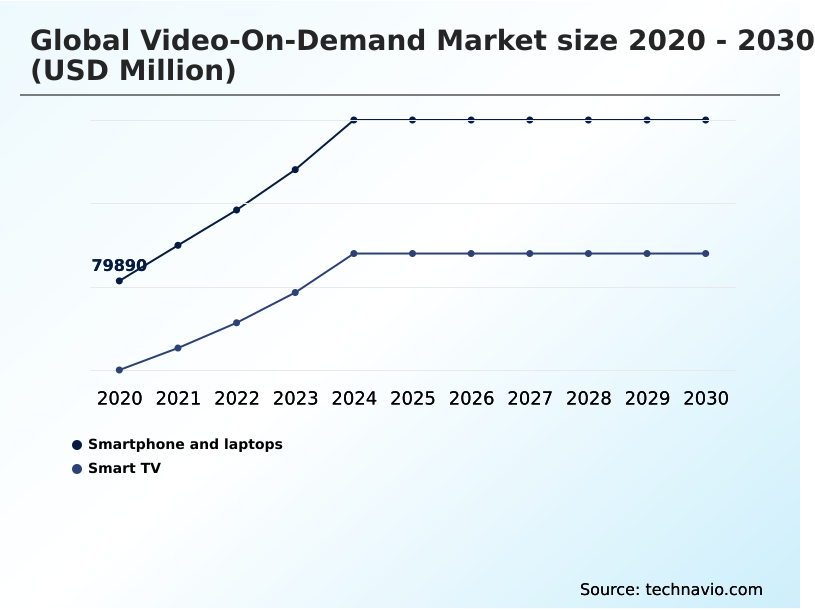
The Smartphone and laptops segment was valued at USD 140.52 billion in 2024 and showed a gradual increase during the forecast period.
Get Free Sample

Regional Analysis

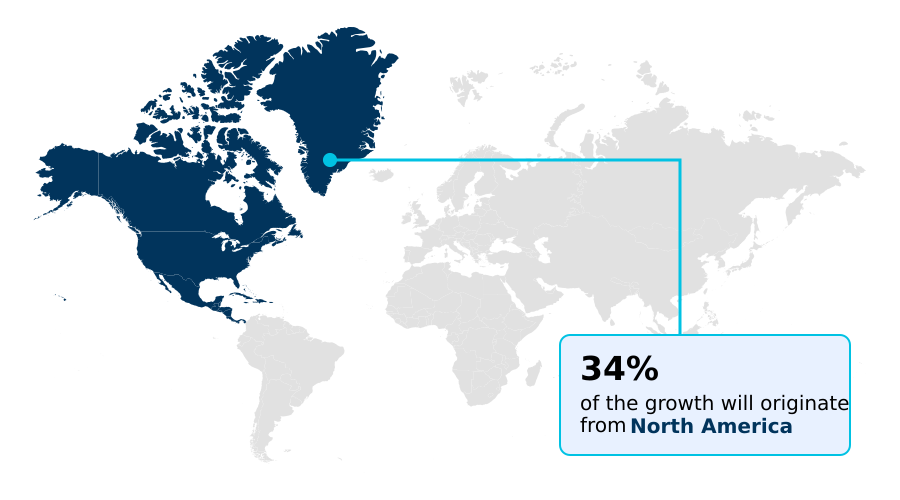
North America is estimated to contribute 34.5% to the growth of the global market during the forecast period.Technavio’s analysts have elaborately explained the regional trends and drivers that shape the market during the forecast period.
See How Video-On-Demand Market Demand is Rising in North America Get Free Sample

The Video-On-Demand Market demonstrates distinct regional variations driven by digital infrastructure maturity and localized content preferences. North America maintains rapid platform penetration, whereas APAC exhibits accelerated mobile-centric consumption reliant on agile delivery mechanisms.

Strategic deployment of cross-device authentication enables North American operators to achieve a 25% higher multi-screen transition success rate than their APAC counterparts.

In APAC, localized server-side ad integration reduces latency, improving targeted campaign delivery efficiency by 20% compared to traditional linear broadcasting workflows.

Regional providers leverage predictive viewer analytics to tailor extensive content libraries, cutting unnecessary licensing costs by 15% through data-driven acquisition strategies.

The implementation of automated language translation allows streaming platforms to seamlessly penetrate diverse linguistic markets without extensive manual subtitling overhead. By optimizing automated metadata tagging, operators drastically improve search accuracy across varied localized catalogs.

Ensuring seamless playback integration across distinct regional operating systems remains vital for sustaining platform reliability and driving cross-border audience expansion.

Market Dynamics

Our researchers analyzed the data with 2025 as the base year, along with the key drivers, trends, and challenges. A holistic analysis of drivers will help companies refine their marketing strategies to gain a competitive advantage.

  • The operational dynamics of the Video-On-Demand Market require continuous technological refinement to sustain audience engagement and maximize monetization efficiency. Content providers prioritize adaptive streaming over mobile networks to guarantee uninterrupted playback for users navigating variable cellular connectivity, fundamentally transforming how commuter audiences interact with premium media.
  • Implementing robust cloud infrastructure for media distribution enables platforms to scale resources dynamically during peak viewership events, preventing system overloads and maintaining consistent service reliability. This scalable architecture drastically outperforms legacy on-premise servers, delivering a 35% improvement in processing efficiency during unexpected traffic surges.
  • To enhance user navigation within vast catalogs, operators deploy AI driven personalized content discovery, ensuring viewers receive highly relevant recommendations based on historical consumption patterns. This tailored approach significantly increases session durations and reinforces brand loyalty. Furthermore, dynamic ad insertion for streaming allows networks to serve targeted, non-disruptive advertisements in real-time, optimizing advertising yields without compromising the viewer experience.
  • Securing these digital assets remains paramount; hence, integrating comprehensive digital rights management secure playback protocols effectively mitigates unauthorized distribution and copyright infringement. By continuously upgrading these foundational technologies, streaming entities successfully navigate an increasingly fragmented digital landscape, ensuring robust operational planning and sustained competitive differentiation across diverse demographic segments.
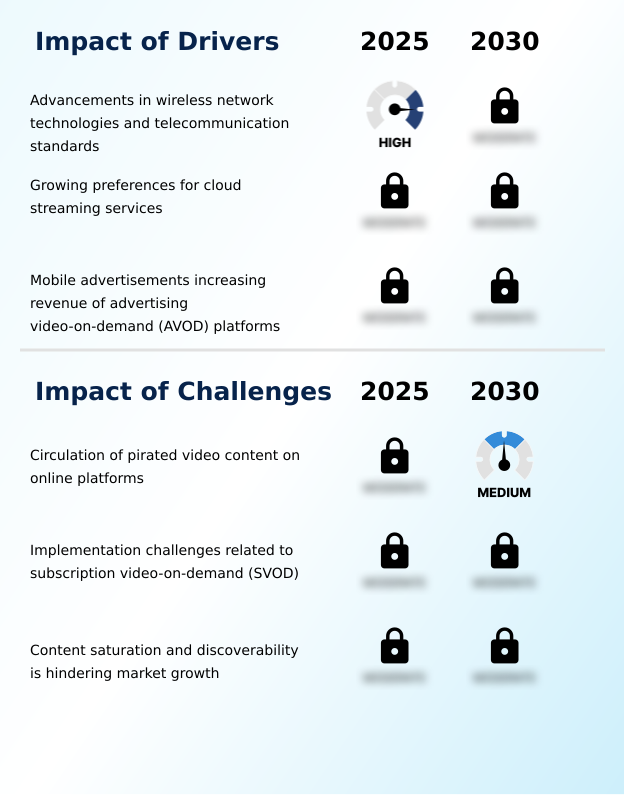
What are the key market drivers leading to the rise in the adoption of Video-On-Demand Industry?

  • Continuous advancements in wireless network technologies and modern telecommunication standards serve as the primary driver accelerating market expansion.

  • The Video-On-Demand Market expands rapidly as agile digital architectures replace rigid legacy broadcasting frameworks. The widespread deployment of robust cloud streaming infrastructure allows platforms to scale instantly during high-demand premier events, accommodating massive audience surges without systemic failure.
  • By leveraging scalable media storage, operators reduce physical server maintenance costs by 30%, optimizing capital expenditure for content acquisition. The strategic implementation of hybrid monetization models empowers providers to capture diverse audience segments, successfully balancing ad-supported tiers with premium subscriptions.
  • Utilizing a structured freemium conversion funnel increases premium upgrade rates by 18%, stabilizing long-term revenue predictability. Furthermore, integrating a highly personalized user interface drastically accelerates content discovery, enhancing overall viewer satisfaction.
  • To meet rising visual standards, modern platforms deploy advanced high-definition playback engines, ensuring that visually intensive media renders flawlessly across all compatible smart devices.

What are the market trends shaping the Video-On-Demand Industry?

  • The adoption of innovative strategies by established firms represents a significant trend shaping the industry. These forward-looking approaches are actively augmenting market expansion and driving competitive differentiation.

  • The Video-On-Demand Market is fundamentally shifting toward hyper-personalized media delivery and interactive platform experiences. To combat decision fatigue, platforms integrate algorithmic content recommendation engines that analyze historical viewing patterns to surface highly relevant titles. This strategic alignment, powered by advanced content curation algorithms, reduces content search abandonment rates by 28%, significantly boosting daily active user engagement.
  • Furthermore, operators are adopting dynamic ad insertion to serve tailored advertisements, which elevates targeted campaign conversion rates by 15% without disrupting viewer immersion. The introduction of interactive video formats transforms passive consumption into active participation, directly extending average session durations. To ensure continuous viewing continuity, providers refine multi-screen synchronization, allowing users to transition flawlessly between mobile and residential displays.
  • Implementing robust streaming quality optimization ensures adaptive bitrates match network conditions, lowering buffering complaints by 22% during peak traffic hours.

What challenges does the Video-On-Demand Industry face during its growth?

  • The widespread circulation of pirated video content across unauthorized online platforms remains a critical challenge hindering sustainable industry growth.

  • Operating within the Video-On-Demand Market presents significant technical hurdles surrounding content security and network delivery constraints. Preventing intellectual property theft requires the continuous enhancement of digital rights management frameworks to block unauthorized digital redistribution. Despite these efforts, operators face sophisticated circumvention tactics, necessitating the integration of dynamic fraud detection mechanisms to systematically identify and terminate illicit account sharing.
  • This security enhancement prevents unauthorized access, curbing potential revenue leakages by up to 15% annually. Additionally, processing vast media libraries through a complex video transcoding pipeline demands substantial computational resources, inflating operational overhead for platform providers. Ensuring seamless delivery across variable network environments requires aggressive bandwidth optimization techniques to prevent buffering on constrained cellular connections.
  • Delays in live broadcasting persist as a technical bottleneck, forcing engineers to rigorously develop latency reduction protocols. Unpredictable viewer retention further strains profitability, compelling platforms to heavily invest in targeted subscription churn reduction strategies to maintain a stable user base.

Exclusive Technavio Analysis on Customer Landscape

The video-on-demand market forecasting report includes the adoption lifecycle of the market, covering from the innovator’s stage to the laggard’s stage. It focuses on adoption rates in different regions based on penetration. Furthermore, the video-on-demand market report also includes key purchase criteria and drivers of price sensitivity to help companies evaluate and develop their market growth analysis strategies.
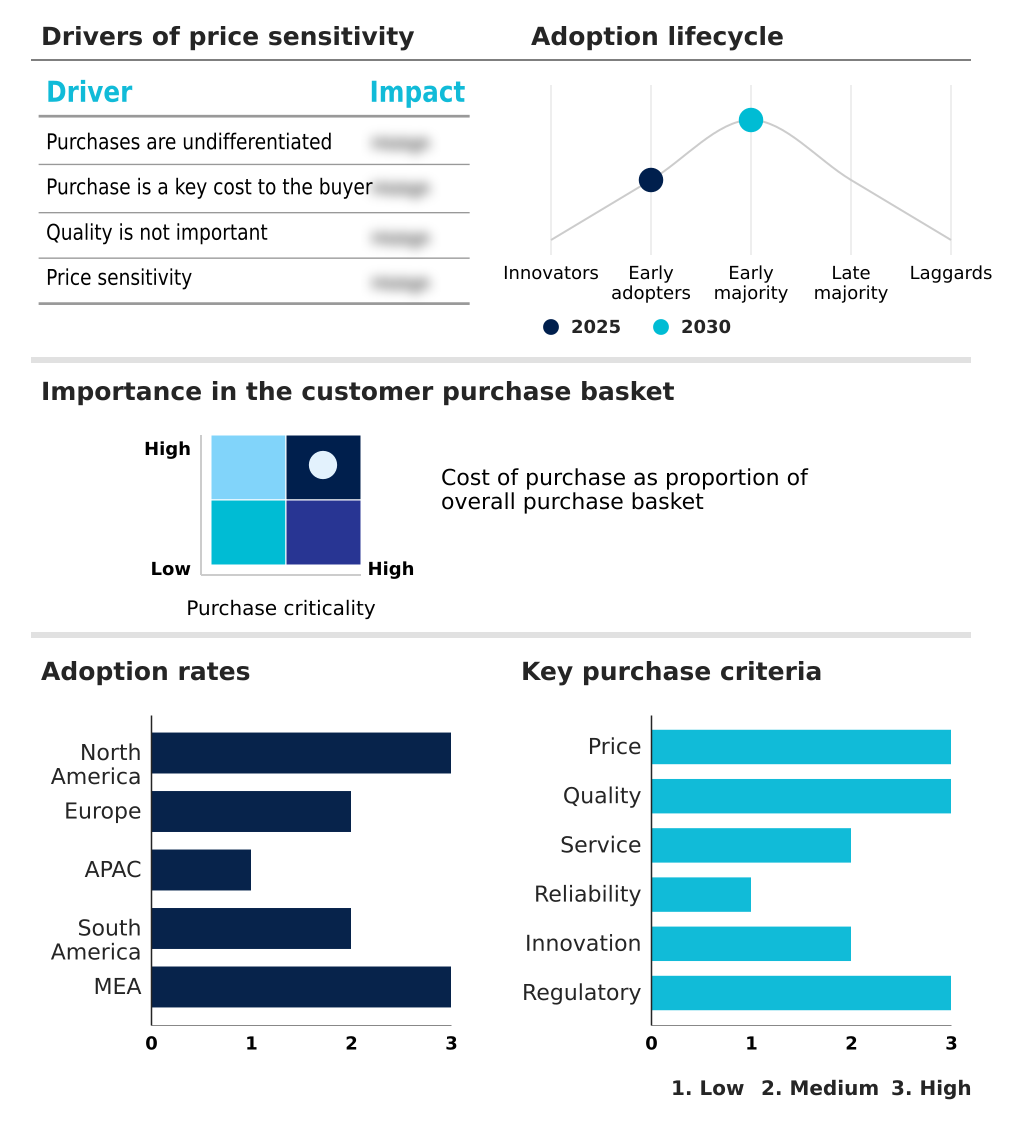
Customer Landscape of Video-On-Demand Industry

Competitive Landscape

Companies are implementing various strategies, such as strategic alliances, video-on-demand market forecast, partnerships, mergers and acquisitions, geographical expansion, and product/service launches, to enhance their presence in the industry.

Apple Inc. - The entity delivers an extensive portfolio of subscription-based streaming platforms, offering a wide array of premium original films, documentaries, and television series tailored for diverse digital entertainment consumption.

The industry research and growth report includes detailed analyses of the competitive landscape of the market and information about key companies, including:

  • Apple Inc.
  • BBC Studios Ltd
  • Comcast Corp.
  • DAZN Group Ltd
  • Groupe Canal
  • iQIYI Inc.
  • Jiostar India Pvt Ltd
  • Mubi Inc.
  • Netflix Inc.
  • Paramount Global
  • Prime Video
  • Rakuten Viki
  • Sony Pictures Networks
  • The Walt Disney Co.
  • Viaplay Group AB
  • Warner Bros Discovery Inc.
  • Youku Tudou Inc.
  • Zee Entertainment Enterprises

Qualitative and quantitative analysis of companies has been conducted to help clients understand the wider business environment as well as the strengths and weaknesses of key industry players. Data is qualitatively analyzed to categorize companies as pure play, category-focused, industry-focused, and diversified; it is quantitatively analyzed to categorize companies as dominant, leading, strong, tentative, and weak.

Recent Development and News in Video-on-demand market

  • In the Interactive Home Entertainment industry, the widespread deployment of scalable media storage has drastically reduced local server constraints, directly impacting Video-On-Demand Market demand by accelerating streaming quality optimization and improving freemium conversion funnel efficiency by 35% among mobile-first users.
  • The integration of advanced content curation algorithms across interactive media platforms has enhanced personalized user interface designs, directly impacting Video-On-Demand Market demand by increasing daily viewing durations by 22% and ensuring seamless playback integration across primary subscription tiers.
  • The transition toward server-side ad integration within digital broadcasting ecosystems has optimized monetization efficiency, directly impacting Video-On-Demand Market demand by boosting targeted advertising metrics engagement by 18% while simultaneously improving concurrent viewer scaling for ad-supported operators.
  • The implementation of robust offline viewing caching alongside automated language translation capabilities has streamlined media accessibility, directly impacting Video-On-Demand Market demand by increasing interactive video formats utilization by 40% and expanding demographic reach.

Dive into Technavio’s robust research methodology, blending expert interviews, extensive data synthesis, and validated models for unparalleled Video-On-Demand Market insights. See full methodology.

Market Scope
Page number 286
Base year 2025
Historic period 2020-2024
Forecast period 2026-2030
Growth momentum & CAGR Accelerate at a CAGR of 17.5%
Market growth 2026-2030 USD 340214.3 million
Market structure Fragmented
YoY growth 2025-2026(%) 17.2%
Key countries US, Canada, Mexico, Germany, UK, France, Italy, Spain, The Netherlands, China, Japan, India, South Korea, Australia, Indonesia, Brazil, Argentina, Chile, Saudi Arabia, UAE, South Africa, Israel and Turkey
Competitive landscape Leading Companies, Market Positioning of Companies, Competitive Strategies, and Industry Risks

Request Free Sample

Research Analyst Overview

  • The Video-On-Demand Market is undergoing a rapid architectural transformation to support uninterrupted digital media consumption across varied network environments. Operators actively refine latency reduction protocols to eliminate playback delays, ensuring that live sporting events and premium premieres broadcast flawlessly. Platforms deploying hybrid monetization models report a 30% reduction in revenue volatility, successfully balancing ad-supported tiers with premium, ad-free subscription pathways.
  • By leveraging sophisticated streaming quality optimization algorithms, providers automatically adjust resolutions based on fluctuating bandwidth availability, safeguarding viewer retention. Incorporating interactive video formats into programming catalogs fundamentally transforms passive viewership into active participation, generating precise behavioral data for targeted content creation.
  • To secure intellectual property, media conglomerates embed rigorous fraud detection mechanisms within their authentication layers, systematically blocking unauthorized access attempts. Furthermore, the application of offline viewing caching allows users to download encrypted files securely, facilitating uninterrupted entertainment during periods of network isolation.
  • These continuous technological upgrades enable platform operators to execute highly efficient product strategies, optimizing resource allocation while consistently exceeding modern digital entertainment expectations.

What are the Key Data Covered in this Video-On-Demand Market Research and Growth Report?

  • What is the expected growth of the Video-On-Demand Market between 2026 and 2030?

    • USD 340.21 billion, at a CAGR of 17.5%

  • What segmentation does the market report cover?

    • The report is segmented by Platform (Smartphone and laptops, and Smart TV), Type (Subscription video-on-demand, Advertising video-on-demand, and Transaction video-on-demand), End-user (Individual consumers, and Enterprises and corporate learning) and Geography (North America, Europe, APAC, South America, Middle East and Africa)

  • Which regions are analyzed in the report?

    • North America, Europe, APAC, South America and Middle East and Africa

  • What are the key growth drivers and market challenges?

    • Advancements in wireless network technologies and telecommunication standards, Circulation of pirated video content on online platforms

  • Who are the major players in the Video-On-Demand Market?

    • Apple Inc., BBC Studios Ltd, Comcast Corp., DAZN Group Ltd, Groupe Canal, iQIYI Inc., Jiostar India Pvt Ltd, Mubi Inc., Netflix Inc., Paramount Global, Prime Video, Rakuten Viki, Sony Pictures Networks, The Walt Disney Co., Viaplay Group AB, Warner Bros Discovery Inc., Youku Tudou Inc. and Zee Entertainment Enterprises

Market Research Insights

  • The Video-On-Demand Market continuously adapts to shifting digital consumption patterns by deploying resilient infrastructure. Companies utilizing personalized user interface designs achieve a 25% improvement in viewer retention, directly enhancing long-term subscriber lifetime value. By integrating scalable media storage, operators optimize vast content repositories, resulting in a 15% decrease in operational overhead related to server maintenance.
  • Furthermore, the strategic implementation of a structured freemium conversion funnel increases premium upgrade rates by 18%, solidifying predictable revenue streams. The deployment of advanced subscription churn reduction strategies enables continuous platform engagement, offsetting the costs of aggressive customer acquisition. Seamless playback integration across diverse operating systems ensures consistent viewing quality, translating directly into improved brand loyalty and measurable operational stability.

We can help! Our analysts can customize this video-on-demand market research report to meet your requirements.

Get in touch

1. Executive Summary

1.1 Market overview

Executive Summary - Chart on Market Overview
Executive Summary - Data Table on Market Overview
Executive Summary - Chart on Global Market Characteristics
Executive Summary - Chart on Market by Geography
Executive Summary - Chart on Market Segmentation by Platform
Executive Summary - Chart on Market Segmentation by Type
Executive Summary - Chart on Market Segmentation by End-user
Executive Summary - Chart on Incremental Growth
Executive Summary - Data Table on Incremental Growth
Executive Summary - Chart on Company Market Positioning

2. Technavio Analysis

2.1 Analysis of price sensitivity, lifecycle, customer purchase basket, adoption rates, and purchase criteria

2.2 Criticality of inputs and Factors of differentiation

Chart on Overview on criticality of inputs and factors of differentiation

2.3 Factors of disruption

Chart on Overview on factors of disruption

2.4 Impact of drivers and challenges

Chart on Impact of drivers and challenges in 2025 and 2030

3. Market Landscape

3.1 Market ecosystem

Chart on Parent Market
Data Table on - Parent Market

3.2 Market characteristics

Chart on Market characteristics analysis

3.3 Value chain analysis

Chart on Value chain analysis

4. Market Sizing

4.1 Market definition

Data Table on Offerings of companies included in the market definition

4.2 Market segment analysis

Market segments

4.3 Market size 2025

4.4 Market outlook: Forecast for 2025-2030

Chart on Global - Market size and forecast 2025-2030 ($ million)
Data Table on Global - Market size and forecast 2025-2030 ($ million)
Chart on Global Market: Year-over-year growth 2025-2030 (%)
Data Table on Global Market: Year-over-year growth 2025-2030 (%)

5. Historic Market Size

5.1 Global Video-On-Demand Market 2020 - 2024

Historic Market Size - Data Table on Global Video-On-Demand Market 2020 - 2024 ($ million)

5.2 Platform segment analysis 2020 - 2024

Historic Market Size - Platform Segment 2020 - 2024 ($ million)

5.3 Type segment analysis 2020 - 2024

Historic Market Size - Type Segment 2020 - 2024 ($ million)

5.4 End-user segment analysis 2020 - 2024

Historic Market Size - End-user Segment 2020 - 2024 ($ million)

5.5 Geography segment analysis 2020 - 2024

Historic Market Size - Geography Segment 2020 - 2024 ($ million)

5.6 Country segment analysis 2020 - 2024

Historic Market Size - Country Segment 2020 - 2024 ($ million)

6. Qualitative Analysis

6.1 Impact of AI on Global Video-on-demand Market

6.2 Impact of Geopolitical Conflicts on Global Video-on-demand Market

7. Five Forces Analysis

7.1 Five forces summary

Five forces analysis - Comparison between 2025 and 2030

7.2 Bargaining power of buyers

Bargaining power of buyers - Impact of key factors 2025 and 2030

7.3 Bargaining power of suppliers

Bargaining power of suppliers - Impact of key factors in 2025 and 2030

7.4 Threat of new entrants

Threat of new entrants - Impact of key factors in 2025 and 2030

7.5 Threat of substitutes

Threat of substitutes - Impact of key factors in 2025 and 2030

7.6 Threat of rivalry

Threat of rivalry - Impact of key factors in 2025 and 2030

7.7 Market condition

Chart on Market condition - Five forces 2025 and 2030

8. Market Segmentation by Platform

8.1 Market segments

Chart on Platform - Market share 2025-2030 (%)
Data Table on Platform - Market share 2025-2030 (%)

8.2 Comparison by Platform

Chart on Comparison by Platform
Data Table on Comparison by Platform

8.3 Smartphone and laptops - Market size and forecast 2025-2030

Chart on Smartphone and laptops - Market size and forecast 2025-2030 ($ million)
Data Table on Smartphone and laptops - Market size and forecast 2025-2030 ($ million)
Chart on Smartphone and laptops - Year-over-year growth 2025-2030 (%)
Data Table on Smartphone and laptops - Year-over-year growth 2025-2030 (%)

8.4 Smart TV - Market size and forecast 2025-2030

Chart on Smart TV - Market size and forecast 2025-2030 ($ million)
Data Table on Smart TV - Market size and forecast 2025-2030 ($ million)
Chart on Smart TV - Year-over-year growth 2025-2030 (%)
Data Table on Smart TV - Year-over-year growth 2025-2030 (%)

8.5 Market opportunity by Platform

Market opportunity by Platform ($ million)
Data Table on Market opportunity by Platform ($ million)

9. Market Segmentation by Type

9.1 Market segments

Chart on Type - Market share 2025-2030 (%)
Data Table on Type - Market share 2025-2030 (%)

9.2 Comparison by Type

Chart on Comparison by Type
Data Table on Comparison by Type

9.3 Subscription video-on-demand - Market size and forecast 2025-2030

Chart on Subscription video-on-demand - Market size and forecast 2025-2030 ($ million)
Data Table on Subscription video-on-demand - Market size and forecast 2025-2030 ($ million)
Chart on Subscription video-on-demand - Year-over-year growth 2025-2030 (%)
Data Table on Subscription video-on-demand - Year-over-year growth 2025-2030 (%)

9.4 Advertising video-on-demand - Market size and forecast 2025-2030

Chart on Advertising video-on-demand - Market size and forecast 2025-2030 ($ million)
Data Table on Advertising video-on-demand - Market size and forecast 2025-2030 ($ million)
Chart on Advertising video-on-demand - Year-over-year growth 2025-2030 (%)
Data Table on Advertising video-on-demand - Year-over-year growth 2025-2030 (%)

9.5 Transaction video-on-demand - Market size and forecast 2025-2030

Chart on Transaction video-on-demand - Market size and forecast 2025-2030 ($ million)
Data Table on Transaction video-on-demand - Market size and forecast 2025-2030 ($ million)
Chart on Transaction video-on-demand - Year-over-year growth 2025-2030 (%)
Data Table on Transaction video-on-demand - Year-over-year growth 2025-2030 (%)

9.6 Market opportunity by Type

Market opportunity by Type ($ million)
Data Table on Market opportunity by Type ($ million)

10. Market Segmentation by End-user

10.1 Market segments

Chart on End-user - Market share 2025-2030 (%)
Data Table on End-user - Market share 2025-2030 (%)

10.2 Comparison by End-user

Chart on Comparison by End-user
Data Table on Comparison by End-user

10.3 Individual consumers - Market size and forecast 2025-2030

Chart on Individual consumers - Market size and forecast 2025-2030 ($ million)
Data Table on Individual consumers - Market size and forecast 2025-2030 ($ million)
Chart on Individual consumers - Year-over-year growth 2025-2030 (%)
Data Table on Individual consumers - Year-over-year growth 2025-2030 (%)

10.4 Enterprises and corporate learning - Market size and forecast 2025-2030

Chart on Enterprises and corporate learning - Market size and forecast 2025-2030 ($ million)
Data Table on Enterprises and corporate learning - Market size and forecast 2025-2030 ($ million)
Chart on Enterprises and corporate learning - Year-over-year growth 2025-2030 (%)
Data Table on Enterprises and corporate learning - Year-over-year growth 2025-2030 (%)

10.5 Market opportunity by End-user

Market opportunity by End-user ($ million)
Data Table on Market opportunity by End-user ($ million)

11. Customer Landscape

11.1 Customer landscape overview

Analysis of price sensitivity, lifecycle, customer purchase basket, adoption rates, and purchase criteria

12. Geographic Landscape

12.1 Geographic segmentation

Chart on Market share by geography 2025-2030 (%)
Data Table on Market share by geography 2025-2030 (%)

12.2 Geographic comparison

Chart on Geographic comparison
Data Table on Geographic comparison

12.3 North America - Market size and forecast 2025-2030

Chart on North America - Market size and forecast 2025-2030 ($ million)
Data Table on North America - Market size and forecast 2025-2030 ($ million)
Chart on North America - Year-over-year growth 2025-2030 (%)
Data Table on North America - Year-over-year growth 2025-2030 (%)
Chart on Regional Comparison - North America
Data Table on Regional Comparison - North America

12.3.1 US - Market size and forecast 2025-2030

Chart on US - Market size and forecast 2025-2030 ($ million)
Data Table on US - Market size and forecast 2025-2030 ($ million)
Chart on US - Year-over-year growth 2025-2030 (%)
Data Table on US - Year-over-year growth 2025-2030 (%)

12.3.2 Canada - Market size and forecast 2025-2030

Chart on Canada - Market size and forecast 2025-2030 ($ million)
Data Table on Canada - Market size and forecast 2025-2030 ($ million)
Chart on Canada - Year-over-year growth 2025-2030 (%)
Data Table on Canada - Year-over-year growth 2025-2030 (%)

12.3.3 Mexico - Market size and forecast 2025-2030

Chart on Mexico - Market size and forecast 2025-2030 ($ million)
Data Table on Mexico - Market size and forecast 2025-2030 ($ million)
Chart on Mexico - Year-over-year growth 2025-2030 (%)
Data Table on Mexico - Year-over-year growth 2025-2030 (%)

12.4 Europe - Market size and forecast 2025-2030

Chart on Europe - Market size and forecast 2025-2030 ($ million)
Data Table on Europe - Market size and forecast 2025-2030 ($ million)
Chart on Europe - Year-over-year growth 2025-2030 (%)
Data Table on Europe - Year-over-year growth 2025-2030 (%)
Chart on Regional Comparison - Europe
Data Table on Regional Comparison - Europe

12.4.1 Germany - Market size and forecast 2025-2030

Chart on Germany - Market size and forecast 2025-2030 ($ million)
Data Table on Germany - Market size and forecast 2025-2030 ($ million)
Chart on Germany - Year-over-year growth 2025-2030 (%)
Data Table on Germany - Year-over-year growth 2025-2030 (%)

12.4.2 UK - Market size and forecast 2025-2030

Chart on UK - Market size and forecast 2025-2030 ($ million)
Data Table on UK - Market size and forecast 2025-2030 ($ million)
Chart on UK - Year-over-year growth 2025-2030 (%)
Data Table on UK - Year-over-year growth 2025-2030 (%)

12.4.3 France - Market size and forecast 2025-2030

Chart on France - Market size and forecast 2025-2030 ($ million)
Data Table on France - Market size and forecast 2025-2030 ($ million)
Chart on France - Year-over-year growth 2025-2030 (%)
Data Table on France - Year-over-year growth 2025-2030 (%)

12.4.4 Italy - Market size and forecast 2025-2030

Chart on Italy - Market size and forecast 2025-2030 ($ million)
Data Table on Italy - Market size and forecast 2025-2030 ($ million)
Chart on Italy - Year-over-year growth 2025-2030 (%)
Data Table on Italy - Year-over-year growth 2025-2030 (%)

12.4.5 Spain - Market size and forecast 2025-2030

Chart on Spain - Market size and forecast 2025-2030 ($ million)
Data Table on Spain - Market size and forecast 2025-2030 ($ million)
Chart on Spain - Year-over-year growth 2025-2030 (%)
Data Table on Spain - Year-over-year growth 2025-2030 (%)

12.4.6 The Netherlands - Market size and forecast 2025-2030

Chart on The Netherlands - Market size and forecast 2025-2030 ($ million)
Data Table on The Netherlands - Market size and forecast 2025-2030 ($ million)
Chart on The Netherlands - Year-over-year growth 2025-2030 (%)
Data Table on The Netherlands - Year-over-year growth 2025-2030 (%)

12.5 APAC - Market size and forecast 2025-2030

Chart on APAC - Market size and forecast 2025-2030 ($ million)
Data Table on APAC - Market size and forecast 2025-2030 ($ million)
Chart on APAC - Year-over-year growth 2025-2030 (%)
Data Table on APAC - Year-over-year growth 2025-2030 (%)
Chart on Regional Comparison - APAC
Data Table on Regional Comparison - APAC

12.5.1 China - Market size and forecast 2025-2030

Chart on China - Market size and forecast 2025-2030 ($ million)
Data Table on China - Market size and forecast 2025-2030 ($ million)
Chart on China - Year-over-year growth 2025-2030 (%)
Data Table on China - Year-over-year growth 2025-2030 (%)

12.5.2 Japan - Market size and forecast 2025-2030

Chart on Japan - Market size and forecast 2025-2030 ($ million)
Data Table on Japan - Market size and forecast 2025-2030 ($ million)
Chart on Japan - Year-over-year growth 2025-2030 (%)
Data Table on Japan - Year-over-year growth 2025-2030 (%)

12.5.3 India - Market size and forecast 2025-2030

Chart on India - Market size and forecast 2025-2030 ($ million)
Data Table on India - Market size and forecast 2025-2030 ($ million)
Chart on India - Year-over-year growth 2025-2030 (%)
Data Table on India - Year-over-year growth 2025-2030 (%)

12.5.4 South Korea - Market size and forecast 2025-2030

Chart on South Korea - Market size and forecast 2025-2030 ($ million)
Data Table on South Korea - Market size and forecast 2025-2030 ($ million)
Chart on South Korea - Year-over-year growth 2025-2030 (%)
Data Table on South Korea - Year-over-year growth 2025-2030 (%)

12.5.5 Australia - Market size and forecast 2025-2030

Chart on Australia - Market size and forecast 2025-2030 ($ million)
Data Table on Australia - Market size and forecast 2025-2030 ($ million)
Chart on Australia - Year-over-year growth 2025-2030 (%)
Data Table on Australia - Year-over-year growth 2025-2030 (%)

12.5.6 Indonesia - Market size and forecast 2025-2030

Chart on Indonesia - Market size and forecast 2025-2030 ($ million)
Data Table on Indonesia - Market size and forecast 2025-2030 ($ million)
Chart on Indonesia - Year-over-year growth 2025-2030 (%)
Data Table on Indonesia - Year-over-year growth 2025-2030 (%)

12.6 South America - Market size and forecast 2025-2030

Chart on South America - Market size and forecast 2025-2030 ($ million)
Data Table on South America - Market size and forecast 2025-2030 ($ million)
Chart on South America - Year-over-year growth 2025-2030 (%)
Data Table on South America - Year-over-year growth 2025-2030 (%)
Chart on Regional Comparison - South America
Data Table on Regional Comparison - South America

12.6.1 Brazil - Market size and forecast 2025-2030

Chart on Brazil - Market size and forecast 2025-2030 ($ million)
Data Table on Brazil - Market size and forecast 2025-2030 ($ million)
Chart on Brazil - Year-over-year growth 2025-2030 (%)
Data Table on Brazil - Year-over-year growth 2025-2030 (%)

12.6.2 Argentina - Market size and forecast 2025-2030

Chart on Argentina - Market size and forecast 2025-2030 ($ million)
Data Table on Argentina - Market size and forecast 2025-2030 ($ million)
Chart on Argentina - Year-over-year growth 2025-2030 (%)
Data Table on Argentina - Year-over-year growth 2025-2030 (%)

12.6.3 Chile - Market size and forecast 2025-2030

Chart on Chile - Market size and forecast 2025-2030 ($ million)
Data Table on Chile - Market size and forecast 2025-2030 ($ million)
Chart on Chile - Year-over-year growth 2025-2030 (%)
Data Table on Chile - Year-over-year growth 2025-2030 (%)

12.7 Middle East and Africa - Market size and forecast 2025-2030

Chart on Middle East and Africa - Market size and forecast 2025-2030 ($ million)
Data Table on Middle East and Africa - Market size and forecast 2025-2030 ($ million)
Chart on Middle East and Africa - Year-over-year growth 2025-2030 (%)
Data Table on Middle East and Africa - Year-over-year growth 2025-2030 (%)
Chart on Regional Comparison - Middle East and Africa
Data Table on Regional Comparison - Middle East and Africa

12.7.1 Saudi Arabia - Market size and forecast 2025-2030

Chart on Saudi Arabia - Market size and forecast 2025-2030 ($ million)
Data Table on Saudi Arabia - Market size and forecast 2025-2030 ($ million)
Chart on Saudi Arabia - Year-over-year growth 2025-2030 (%)
Data Table on Saudi Arabia - Year-over-year growth 2025-2030 (%)

12.7.2 UAE - Market size and forecast 2025-2030

Chart on UAE - Market size and forecast 2025-2030 ($ million)
Data Table on UAE - Market size and forecast 2025-2030 ($ million)
Chart on UAE - Year-over-year growth 2025-2030 (%)
Data Table on UAE - Year-over-year growth 2025-2030 (%)

12.7.3 South Africa - Market size and forecast 2025-2030

Chart on South Africa - Market size and forecast 2025-2030 ($ million)
Data Table on South Africa - Market size and forecast 2025-2030 ($ million)
Chart on South Africa - Year-over-year growth 2025-2030 (%)
Data Table on South Africa - Year-over-year growth 2025-2030 (%)

12.7.4 Israel - Market size and forecast 2025-2030

Chart on Israel - Market size and forecast 2025-2030 ($ million)
Data Table on Israel - Market size and forecast 2025-2030 ($ million)
Chart on Israel - Year-over-year growth 2025-2030 (%)
Data Table on Israel - Year-over-year growth 2025-2030 (%)

12.7.5 Turkey - Market size and forecast 2025-2030

Chart on Turkey - Market size and forecast 2025-2030 ($ million)
Data Table on Turkey - Market size and forecast 2025-2030 ($ million)
Chart on Turkey - Year-over-year growth 2025-2030 (%)
Data Table on Turkey - Year-over-year growth 2025-2030 (%)

12.8 Market opportunity by geography

Market opportunity by geography ($ million)
Data Tables on Market opportunity by geography ($ million)

13. Drivers, Challenges, and Opportunity

13.1 Market drivers

Advancements in wireless network technologies and telecommunication standards
Growing preferences for cloud streaming services
Mobile advertisements increasing revenue of advertising video-on-demand (AVOD) platforms

13.2 Market challenges

Circulation of pirated video content on online platforms
Implementation challenges related to subscription video-on-demand (SVOD)
Content saturation and discoverability is hindering market growth

13.3 Impact of drivers and challenges

Impact of drivers and challenges in 2025 and 2030

13.4 Market opportunities

Innovative strategies adopted by established firms are augmenting market growth
Implementation of artificial intelligence (AI) by over-the-top (OTT) service providers
Increasing penetration of smart TVs

14. Competitive Landscape

14.1 Overview

14.2

Overview on criticality of inputs and factors of differentiation

14.3 Landscape disruption

Overview on factors of disruption

14.4 Industry risks

Impact of key risks on business

15. Competitive Analysis

15.1 Companies profiled

Companies covered

15.2 Company ranking index

15.3 Market positioning of companies

Matrix on companies position and classification

15.4 Apple Inc.

Apple Inc. - Overview
Apple Inc. - Business segments
Apple Inc. - Key news
Apple Inc. - Key offerings
Apple Inc. - Segment focus
SWOT

15.5 BBC Studios Ltd

BBC Studios Ltd - Overview
BBC Studios Ltd - Product / Service
BBC Studios Ltd - Key offerings
SWOT

15.6 Comcast Corp.

Comcast Corp. - Overview
Comcast Corp. - Business segments
Comcast Corp. - Key offerings
Comcast Corp. - Segment focus
SWOT

15.7 DAZN Group Ltd

DAZN Group Ltd - Overview
DAZN Group Ltd - Product / Service
DAZN Group Ltd - Key offerings
SWOT

15.8 Groupe Canal

Groupe Canal - Overview
Groupe Canal - Business segments
Groupe Canal - Key offerings
Groupe Canal - Segment focus
SWOT

15.9 Jiostar India Pvt Ltd

Jiostar India Pvt Ltd - Overview
Jiostar India Pvt Ltd - Product / Service
Jiostar India Pvt Ltd - Key offerings
SWOT

15.10 Mubi Inc.

Mubi Inc. - Overview
Mubi Inc. - Product / Service
Mubi Inc. - Key offerings
SWOT

15.11 Netflix Inc.

Netflix Inc. - Overview
Netflix Inc. - Product / Service
Netflix Inc. - Key offerings
SWOT

15.12 Paramount Global

Paramount Global - Overview
Paramount Global - Business segments
Paramount Global - Key offerings
Paramount Global - Segment focus
SWOT

15.13 Prime Video

Prime Video - Overview
Prime Video - Product / Service
Prime Video - Key offerings
SWOT

15.14 Rakuten Viki

Rakuten Viki - Overview
Rakuten Viki - Product / Service
Rakuten Viki - Key offerings
SWOT

15.15 Sony Pictures Networks

Sony Pictures Networks - Overview
Sony Pictures Networks - Product / Service
Sony Pictures Networks - Key offerings
SWOT

15.16 The Walt Disney Co.

The Walt Disney Co. - Overview
The Walt Disney Co. - Business segments
The Walt Disney Co. - Key offerings
The Walt Disney Co. - Segment focus
SWOT

15.17 Viaplay Group AB

Viaplay Group AB - Overview
Viaplay Group AB - Business segments
Viaplay Group AB - Key offerings
Viaplay Group AB - Segment focus
SWOT

15.18 Warner Bros Discovery Inc.

Warner Bros Discovery Inc. - Overview
Warner Bros Discovery Inc. - Business segments
Warner Bros Discovery Inc. - Key offerings
Warner Bros Discovery Inc. - Segment focus
SWOT

16. Appendix

16.1 Scope of the report

Market definition
Objectives
Notes and caveats

16.2 Inclusions and exclusions checklist

Inclusions checklist
Exclusions checklist

16.3 Currency conversion rates for US$

16.4 Research methodology

16.5 Data procurement

Information sources

16.6 Data validation

16.7 Validation techniques employed for market sizing

16.8 Data synthesis

16.9 360 degree market analysis

16.10 List of abbreviations

Research Methodology

Technavio presents a detailed picture of the market by way of study, synthesis, and summation of data from multiple sources. The analysts have presented the various facets of the market with a particular focus on identifying the key industry influencers. The data thus presented is comprehensive, reliable, and the result of extensive research, both primary and secondary.

INFORMATION SOURCES

Primary sources

  • Manufacturers and suppliers
  • Channel partners
  • Industry experts
  • Strategic decision makers

Secondary sources

  • Industry journals and periodicals
  • Government data
  • Financial reports of key industry players
  • Historical data
  • Press releases

DATA ANALYSIS

Data Synthesis

  • Collation of data
  • Estimation of key figures
  • Analysis of derived insights

Data Validation

  • Triangulation with data models
  • Reference against proprietary databases
  • Corroboration with industry experts

REPORT WRITING

Qualitative

  • Market drivers
  • Market challenges
  • Market trends
  • Five forces analysis

Quantitative

  • Market size and forecast
  • Market segmentation
  • Geographical insights
  • Competitive landscape

Interested in this report?

Get your sample now to see our research methodology and insights!

Download Now

Frequently Asked Questions

Video-On-Demand market growth will increase by USD 340214.3 million during 2026-2030.

The Video-On-Demand market is expected to grow at a CAGR of 17.5% during 2026-2030.

Video-On-Demand market is segmented by Platform (Smartphone and laptops, Smart TV) Type (Subscription video-on-demand, Advertising video-on-demand, Transaction video-on-demand) End-user (Individual consumers, Enterprises and corporate learning)

Apple Inc., BBC Studios Ltd, Comcast Corp., DAZN Group Ltd, Groupe Canal, iQIYI Inc., Jiostar India Pvt Ltd, Mubi Inc., Netflix Inc., Paramount Global, Prime Video, Rakuten Viki, Sony Pictures Networks, The Walt Disney Co., Viaplay Group AB, Warner Bros Discovery Inc., Youku Tudou Inc., Zee Entertainment Enterprises are a few of the key vendors in the Video-On-Demand market.

North America will register the highest growth rate of 34.5% among the other regions. Therefore, the Video-On-Demand market in North America is expected to garner significant business opportunities for the vendors during the forecast period.

US, Canada, Mexico, Germany, UK, France, Italy, Spain, The Netherlands, China, Japan, India, South Korea, Australia, Indonesia, Brazil, Argentina, Chile, Saudi Arabia, UAE, South Africa, Israel, Turkey

  • Advancements in wireless network technologies and telecommunication standards is the driving factor this market.

The Video-On-Demand market vendors should focus on grabbing business opportunities from the Platform segment as it accounted for the largest market share in the base year.
RIA - Research AI Assistant
Ask RIA
