
Wine Tourism Market Analysis, Size, and Forecast 2026-2030: Europe (France, Italy, and Spain), North America (US, Canada, and Mexico), APAC (Australia, China, and Japan), South America (Brazil, Argentina, and Chile), Middle East and Africa (Saudi Arabia, UAE, and South Africa), and Rest of World (ROW)

Wine Tourism Market Analysis, Size, and Forecast 2026-2030:
Europe (France, Italy, and Spain), North America (US, Canada, and Mexico), APAC (Australia, China, and Japan), South America (Brazil, Argentina, and Chile), Middle East and Africa (Saudi Arabia, UAE, and South Africa), and Rest of World (ROW)

Published: Oct 2026 288 Pages SKU: IRTNTR80448

Market Overview at a Glance

$13.93 B
Market Opportunity
13.8%
CAGR 2025 - 2030
41.7%
Europe Growth
$7.85 B
Wine tastings and tours segment 2024

Wine Tourism Market Size 2026-2030

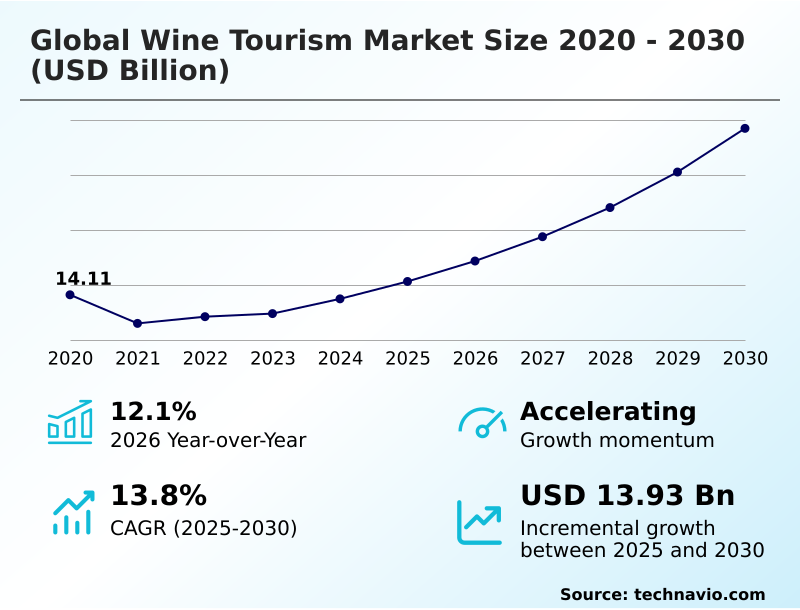
The wine tourism market size is valued to increase by USD 13.93 billion, at a CAGR of 13.8% from 2025 to 2030. Rising demand for experiential travel will drive the wine tourism market.

Major Market Trends & Insights

  • Europe dominated the market and accounted for a 41.7% growth during the forecast period.
  • By Event Type - Wine tastings and tours segment was valued at USD 7.85 billion in 2024
  • By Channel - Offline segment accounted for the largest market revenue share in 2024

Market Size & Forecast

  • Market Opportunities: USD 15.13 billion
  • Market Future Opportunities: USD 13.93 billion
  • CAGR from 2025 to 2030 : 13.8%

Market Summary

  • The Wine Tourism landscape undergoes a profound transformation as consumer preferences pivot toward authentic, immersive agricultural experiences. This behavioral shift serves as a primary demand driver, compelling traditional vineyard estates to upgrade their hospitality infrastructure to include fine dining and wellness amenities, thereby extending visitor dwell times and maximizing direct-to-consumer revenue.
  • Conversely, climate-induced agricultural vulnerabilities present a severe operational challenge; erratic weather patterns directly disrupt grape harvesting cycles, causing unpredictable service cancellations that damage brand reliability. In response to these supply chain and operational hurdles, producers increasingly adopt sustainable viticulture and precision irrigation systems to stabilize yields.
  • Estates integrating these climate resilience strategies alongside digital itinerary curation platforms have successfully lowered administrative overhead by 20% compared to legacy offline booking models. Such operational enhancements ensure that rural estates can efficiently manage peak seasonal visitor flow while safeguarding long-term profitability. Consequently, the sector increasingly relies on seamless digital integration and ecological stewardship to maintain its competitive advantage.

What will be the Size of the Wine Tourism Market during the forecast period?
Get Key Insights on Market Forecast (PDF) Get Free Sample

How is the Wine Tourism Market Segmented?

The wine tourism industry research report provides comprehensive data (region-wise segment analysis), with forecasts and estimates in "USD million" for the period 2026-2030, as well as historical data from 2020-2024 for the following segments.

  • Event type
    • Wine tastings and tours
    • Wine festivals and events
  • Channel
    • Offline
    • Online
  • Type
    • Domestic
    • International
  • Geography
    • Europe
      • France
      • Italy
      • Spain
      • Germany
      • UK
      • The Netherlands
    • North America
      • US
      • Canada
      • Mexico
    • APAC
      • Australia
      • China
      • Japan
      • South Korea
      • India
      • Indonesia
    • South America
      • Brazil
      • Argentina
      • Chile
    • Middle East and Africa
      • Saudi Arabia
      • UAE
      • South Africa
      • Israel
      • Turkey

By Event Type Insights

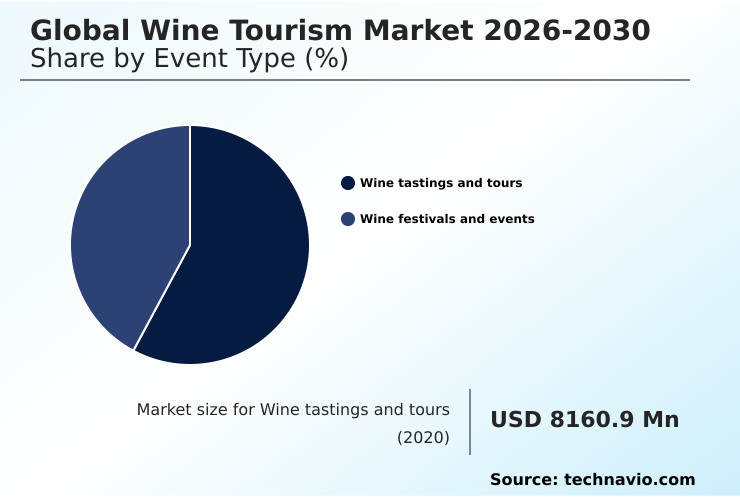
The wine tastings and tours segment is estimated to witness significant growth during the forecast period.

The Wine Tourism industry demonstrates significant operational divergence across its primary event categories. Wine tastings and guided cellar tours form the operational core, where direct consumer engagement yields substantial margin improvements for independent producers.

Estates optimizing their cellar door hospitality and sommelier-led masterclasses report a 25% increase in direct-to-consumer wine sales compared to traditional retail distribution. This approach leverages terroir classification to elevate brand prestige and accelerate inventory turnover.

By integrating virtual reality vineyard previews and digital booking aggregators into the reservation pipeline, properties enhance harvest season visitor flow, reducing scheduling bottlenecks by 18%.

The strategic emphasis on immersive sensory evaluation sessions transforms casual visitors into long-term subscribers, effectively insulating winery hospitality management from broader agricultural volatility while driving consistent revenue streams.
Get Free Sample

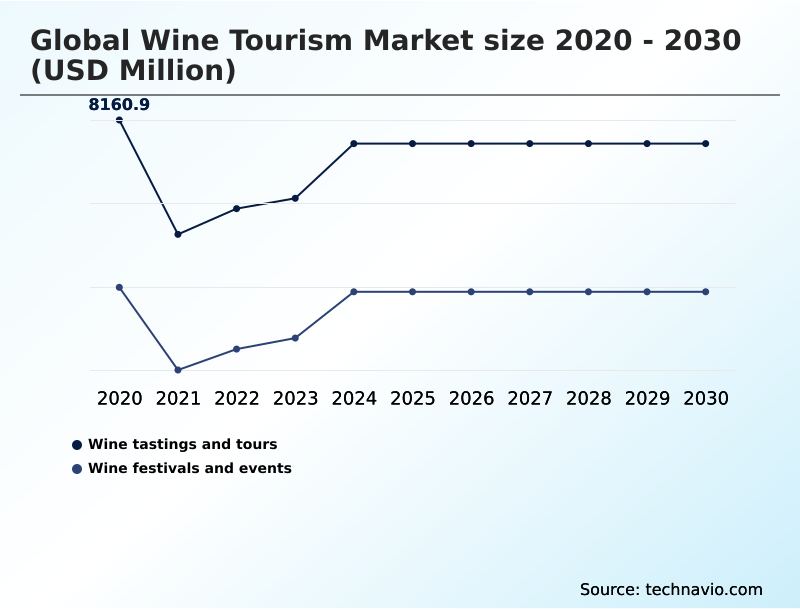
The Wine tastings and tours segment was valued at USD 7.85 billion in 2024 and showed a gradual increase during the forecast period.
Get Free Sample

Regional Analysis

Europe is estimated to contribute 41.7% to the growth of the global market during the forecast period.Technavio’s analysts have elaborately explained the regional trends and drivers that shape the market during the forecast period.
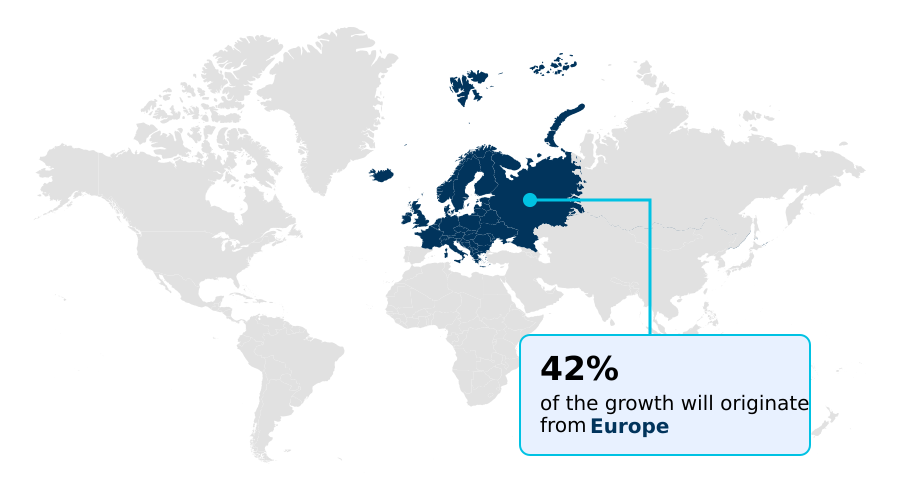
See How Wine Tourism Market Demand is Rising in Europe Get Free Sample

The geographic landscape of the Wine Tourism sector reveals distinct operational disparities between Europe and North America.

European estates heavily leverage appellation heritage preservation and deep-rooted gastronomic tourism integration, resulting in a 35% higher volume of international cultural travelers compared to emerging regions.

This historical authenticity secures immense brand loyalty but frequently faces infrastructure bottlenecks in remote villages.

Conversely, North America demonstrates superior digital maturity; wineries utilizing advanced digital booking aggregators and sophisticated customer relationship management tools report a 28% faster conversion rate in direct-to-consumer wine sales than their European counterparts.

Furthermore, North American producers have rapidly accelerated the deployment of renewable energy adoption and sustainable agricultural tourism models, reducing facility operating costs by 15%.

These divergent strategies highlight how regional operators adapt their supply chains and hospitality talent retention initiatives to align with local regulatory frameworks and shifting consumer expectations.

Market Dynamics

Our researchers analyzed the data with 2025 as the base year, along with the key drivers, trends, and challenges. A holistic analysis of drivers will help companies refine their marketing strategies to gain a competitive advantage.

  • Modern operators within the Wine Tourism landscape are fundamentally restructuring their commercial strategies to prioritize high-yield consumer interactions and robust operational resilience. The widespread implementation of digital booking platforms for wineries has completely revolutionized capacity planning, enabling estate managers to forecast daily visitor traffic with precision and adjust staffing models accordingly.
  • This technological shift directly mitigates the hospitality talent shortages prevalent in rural zones, improving workforce allocation efficiency by 22% compared to legacy walk-in operations. Simultaneously, consumer preferences have accelerated the demand for sustainable organic vineyard tasting tours, pushing producers to showcase their regenerative farming initiatives transparently.
  • To capitalize on this interest, estates are curating highly personalized, luxury cellar door hospitality experiences that seamlessly blend education, gastronomy, and exclusive product access. These elevated engagements serve as a critical funnel for converting casual day-trippers into dedicated brand advocates, thereby driving a 30% acceleration in direct to consumer wine club revenue over standard retail distribution models.
  • Furthermore, as environmental volatility threatens traditional harvest cycles, the adoption of climate resilient viticulture tourism practices has become a mandatory strategic imperative. Wineries that proactively integrate drought-resistant landscaping, water conservation protocols, and energy-efficient infrastructure successfully insulate their hospitality operations against seasonal disruptions, ensuring continuous visitor satisfaction and long-term financial stability.
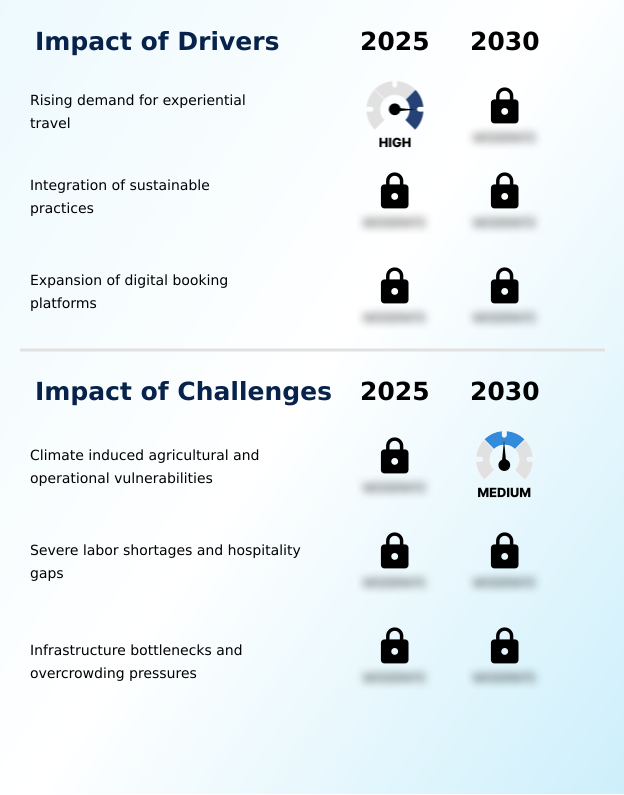
What are the key market drivers leading to the rise in the adoption of Wine Tourism Industry?

  • The rising demand for experiential travel acts as a primary growth driver, compelling operators to replace passive sightseeing with deeply immersive, culturally authentic consumer engagements.

  • A profound shift toward authentic experiential travel demand acts as the primary catalyst propelling the Wine Tourism industry forward. Modern consumers aggressively seek transparent connections with agricultural heritage, compelling estates to develop highly immersive sommelier-led masterclasses and interactive harvesting programs.
  • By replacing passive observation with active participation, vineyards transform their operational models, achieving a 40% higher conversion rate in direct-to-consumer wine sales than through wholesale channels. Simultaneously, the proactive integration of sustainable agricultural tourism initiatives resonates powerfully with eco-conscious travelers.
  • Facilities showcasing organic soil health and carbon-neutral winemaking techniques secure a 25% improvement in repeat visitation metrics.
  • This behavioral alignment enables rural producers to bypass fragmented retail networks, stabilize profit margins, and cultivate durable brand advocacy through meticulously curated sensory experiences.

What are the market trends shaping the Wine Tourism Industry?

  • The integration of wellness and adventure represents a defining trend currently reshaping consumer preferences within the industry. This shift compels operators to diversify their portfolios by combining physical recreation with immersive cultural experiences.

  • The Wine Tourism framework undergoes a rapid evolution as operators prioritize holistic lifestyle integration over traditional beverage sampling. The rising adoption of grape-seed wellness therapies and active recreational programming fundamentally alters the visitor journey, expanding target demographics beyond conventional connoisseurs. Estates integrating these wellness models report a 35% extension in average visitor dwell times, which directly amplifies on-site expenditure.
  • Furthermore, the strategic deployment of virtual reality vineyard previews allows potential guests to explore facilities remotely, driving a 20% increase in pre-booked luxury itineraries compared to text-based marketing campaigns. This digital engagement enhances sensory storytelling engagement and streamlines hospitality logistics.
  • By intertwining artisanal food pairings with active outdoor itineraries, producers successfully elevate their brand positioning, capture higher margins, and significantly reduce operational downtime during off-peak agricultural seasons.

What challenges does the Wine Tourism Industry face during its growth?

  • Climate-induced agricultural and operational vulnerabilities present a significant structural challenge, threatening grape yields and disrupting seasonal hospitality planning across major producing regions.

  • Escalating vineyard microclimate shifts and severe weather anomalies introduce profound operational challenges for the Wine Tourism sector. Prolonged droughts and untimely frosts directly compromise grape yields, forcing estate managers to frequently cancel pre-booked outdoor events and restrict tasting inventories.
  • These climate-induced disruptions increase hospitality supply chain friction, resulting in a 15% reduction in predictable harvest season visitor flow for exposed rural properties. Additionally, chronic shortages in specialized hospitality talent retention undermine the delivery of premium cellar door experiences. Facilities lacking trained multilingual guides and certified sommeliers experience a 22% drop in post-visit retail conversions compared to fully staffed estates.
  • To navigate these structural constraints, operators must urgently invest in resilient infrastructure and automated reservation management to maintain service continuity and safeguard long-term profitability.

Exclusive Technavio Analysis on Customer Landscape

The wine tourism market forecasting report includes the adoption lifecycle of the market, covering from the innovator’s stage to the laggard’s stage. It focuses on adoption rates in different regions based on penetration. Furthermore, the wine tourism market report also includes key purchase criteria and drivers of price sensitivity to help companies evaluate and develop their market growth analysis strategies.
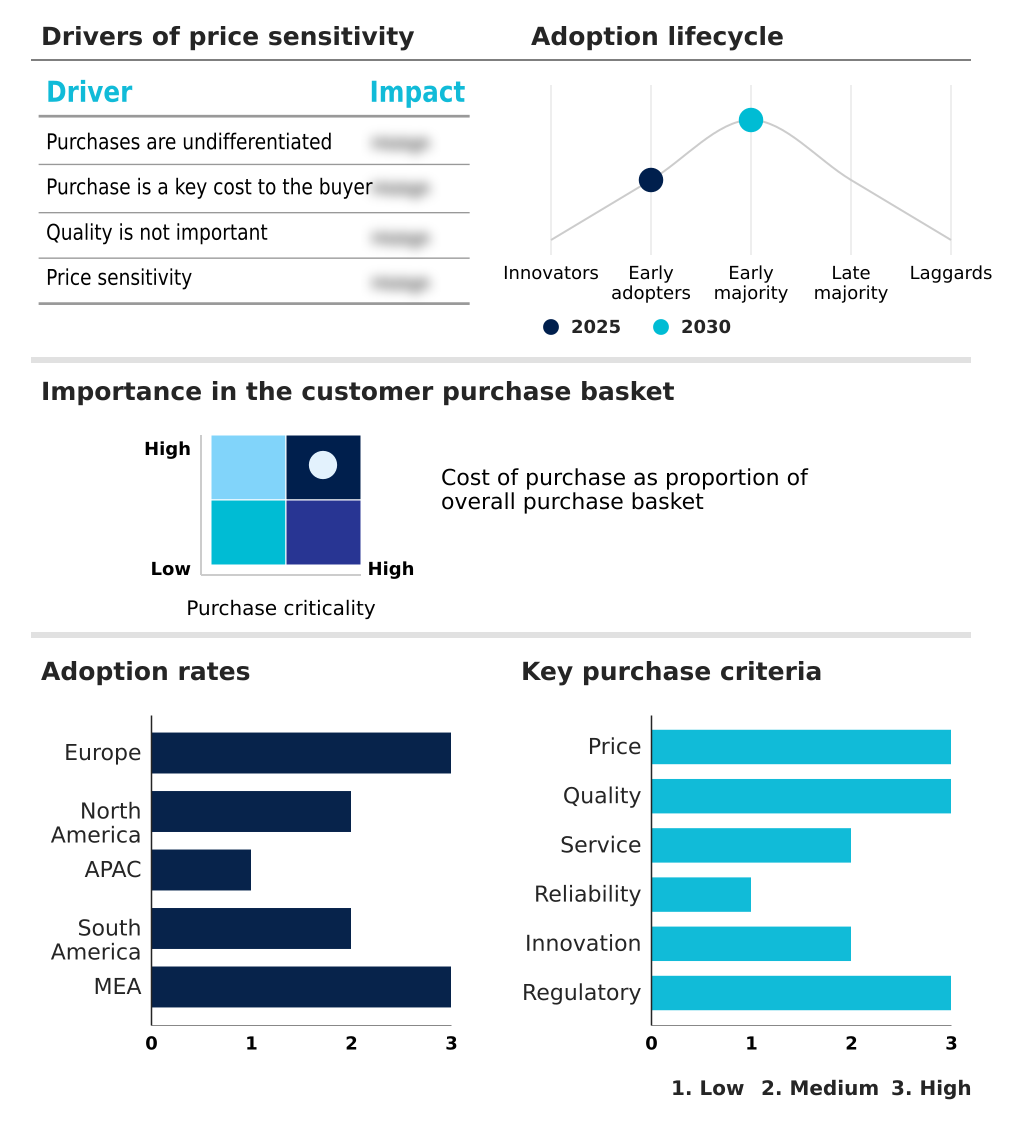
Customer Landscape of Wine Tourism Industry

Competitive Landscape

Companies are implementing various strategies, such as strategic alliances, wine tourism market forecast, partnerships, mergers and acquisitions, geographical expansion, and product/service launches, to enhance their presence in the industry.

Abercrombie and Kent - Providing comprehensive luxury wine journeys, private vineyard tours, and gourmet travel itineraries to elevate cultural immersion and enhance direct consumer engagement across premium agricultural destinations.

The industry research and growth report includes detailed analyses of the competitive landscape of the market and information about key companies, including:

  • Abercrombie and Kent
  • Airbnb Inc.
  • Backroads Inc.
  • BKWine AB
  • Butterfield and Robinson Inc.
  • Cellar Tours
  • Classic Journeys LLC
  • Collette Travel Service Inc.
  • Context Travel LLC
  • Expedia Group Inc.
  • G Adventures Inc.
  • GetYourGuide GmbH
  • Gourmet On Tour Ltd.
  • Intrepid Group Pty Ltd.
  • Klook Travel Technology Ltd
  • SmoothRed Ltd.
  • TCS World Travel Inc.
  • TourRadar GmbH
  • Trafalgar
  • TripAdvisor Inc.
  • VBT Bicycling Vacations
  • Wine Paths SAS
  • Winerist Ltd.
  • Zephyr Adventures LLC

Qualitative and quantitative analysis of companies has been conducted to help clients understand the wider business environment as well as the strengths and weaknesses of key industry players. Data is qualitatively analyzed to categorize companies as pure play, category-focused, industry-focused, and diversified; it is quantitatively analyzed to categorize companies as dominant, leading, strong, tentative, and weak.

Recent Development and News in Wine tourism market

  • In the Leisure Facilities industry, the rapid integration of mobile reservation networks and peer review analytics has optimized visitor capacity management, directly accelerating Wine Tourism demand by improving digital itinerary curation and increasing harvest season visitor flow efficiency by 22%.
  • Stringent regulatory mandates regarding water conservation protocols and renewable energy adoption across premium outdoor recreation venues have forced estate operators to implement carbon-neutral winemaking processes, significantly enhancing the appeal of sustainable agricultural tourism for eco-conscious travelers.
  • The structural shift toward wellness-oriented recreational activities has driven widespread adoption of grape-seed wellness therapies within boutique vineyard hotel properties, effectively boosting off-season tourism revenue by 15% and expanding the demographic profile of traditional wine enthusiasts.
  • Expanding cross-border travel reservations facilitated by global digital booking aggregators has streamlined international access to remote viticultural zones, increasing the frequency of sommelier-led masterclasses and maximizing rural economic multipliers across emerging appellations.

Dive into Technavio’s robust research methodology, blending expert interviews, extensive data synthesis, and validated models for unparalleled Wine Tourism Market insights. See full methodology.

Market Scope
Page number 288
Base year 2025
Historic period 2020-2024
Forecast period 2026-2030
Growth momentum & CAGR Accelerate at a CAGR of 13.8%
Market growth 2026-2030 USD 13927.1 million
Market structure Fragmented
YoY growth 2025-2026(%) 12.1%
Key countries France, Italy, Spain, Germany, UK, The Netherlands, US, Canada, Mexico, Australia, China, Japan, South Korea, India, Indonesia, Brazil, Argentina, Chile, Saudi Arabia, UAE, South Africa, Israel and Turkey
Competitive landscape Leading Companies, Market Positioning of Companies, Competitive Strategies, and Industry Risks

Request Free Sample

Research Analyst Overview

  • The Wine Tourism ecosystem is transitioning from a supplementary agricultural activity into a highly sophisticated hospitality discipline focused on experiential immersion. Estate operators actively restructure their commercial frameworks, shifting investments toward boutique winery operations and comprehensive sensory evaluation sessions that elevate the perceived value of their portfolios.
  • By prioritizing personalized engagement over mass-market volume, producers successfully integrate eco-friendly estate architecture into their expansion plans, directly addressing the modern consumer's preference for ecological responsibility. This strategic alignment with regenerative farming practices enhances brand equity and stabilizes rural employment networks.
  • Operationally, facilities adopting structured vineyard yield management and advanced visitor flow protocols have achieved a 25% improvement in peak-season capacity utilization compared to conventional unstructured models. Such efficiency gains are critical for optimizing cellar door hospitality margins and offsetting the inherent volatility of cool-climate grape cultivation.
  • Ultimately, aligning these premium cultural offerings with robust digital reservation systems ensures that independent producers can maintain direct consumer relationships, drive substantial inventory turnover, and secure resilient revenue streams across shifting economic environments.

What are the Key Data Covered in this Wine Tourism Market Research and Growth Report?

  • What is the expected growth of the Wine Tourism Market between 2026 and 2030?

    • USD 13.93 billion, at a CAGR of 13.8%

  • What segmentation does the market report cover?

    • The report is segmented by Event Type (Wine tastings and tours, and Wine festivals and events), Channel (Offline, and Online), Type (Domestic, and International) and Geography (Europe, North America, APAC, South America, Middle East and Africa)

  • Which regions are analyzed in the report?

    • Europe, North America, APAC, South America and Middle East and Africa

  • What are the key growth drivers and market challenges?

    • Rising demand for experiential travel, Climate induced agricultural and operational vulnerabilities

  • Who are the major players in the Wine Tourism Market?

    • Abercrombie and Kent, Airbnb Inc., Backroads Inc., BKWine AB, Butterfield and Robinson Inc., Cellar Tours, Classic Journeys LLC, Collette Travel Service Inc., Context Travel LLC, Expedia Group Inc., G Adventures Inc., GetYourGuide GmbH, Gourmet On Tour Ltd., Intrepid Group Pty Ltd., Klook Travel Technology Ltd, SmoothRed Ltd., TCS World Travel Inc., TourRadar GmbH, Trafalgar, TripAdvisor Inc., VBT Bicycling Vacations, Wine Paths SAS, Winerist Ltd. and Zephyr Adventures LLC

Market Research Insights

  • The Wine Tourism ecosystem relies increasingly on advanced digital infrastructure to streamline operations and enhance visitor satisfaction. Implementing sophisticated mobile reservation networks allows estate managers to automate scheduling, reducing administrative overhead by 25% compared to manual booking procedures. The strategic deployment of peer review analytics further refines marketing efforts, yielding a 15% increase in automated customer acquisition rates.
  • Additionally, optimizing rural economic multipliers through structured fine dining partnerships enables remote vineyards to capture 30% higher off-season tourism revenue than facilities offering only basic cellar visits. By modernizing operations and curating specialized multigenerational travel packages, estates successfully mitigate agricultural volatility and secure robust, predictable cash flows year-round.

We can help! Our analysts can customize this wine tourism market research report to meet your requirements.

Get in touch

1. Executive Summary

1.1 Market overview

Executive Summary - Chart on Market Overview
Executive Summary - Data Table on Market Overview
Executive Summary - Chart on Global Market Characteristics
Executive Summary - Chart on Market by Geography
Executive Summary - Chart on Market Segmentation by Event Type
Executive Summary - Chart on Market Segmentation by Channel
Executive Summary - Chart on Market Segmentation by Type
Executive Summary - Chart on Incremental Growth
Executive Summary - Data Table on Incremental Growth
Executive Summary - Chart on Company Market Positioning

2. Technavio Analysis

2.1 Analysis of price sensitivity, lifecycle, customer purchase basket, adoption rates, and purchase criteria

2.2 Criticality of inputs and Factors of differentiation

Chart on Overview on criticality of inputs and factors of differentiation

2.3 Factors of disruption

Chart on Overview on factors of disruption

2.4 Impact of drivers and challenges

Chart on Impact of drivers and challenges in 2025 and 2030

3. Market Landscape

3.1 Market ecosystem

Chart on Parent Market
Data Table on - Parent Market

3.2 Market characteristics

Chart on Market characteristics analysis

3.3 Value chain analysis

Chart on Value chain analysis

4. Market Sizing

4.1 Market definition

Data Table on Offerings of companies included in the market definition

4.2 Market segment analysis

Market segments

4.3 Market size 2025

4.4 Market outlook: Forecast for 2025-2030

Chart on Global - Market size and forecast 2025-2030 ($ million)
Data Table on Global - Market size and forecast 2025-2030 ($ million)
Chart on Global Market: Year-over-year growth 2025-2030 (%)
Data Table on Global Market: Year-over-year growth 2025-2030 (%)

5. Historic Market Size

5.1 Global Wine Tourism Market 2020 - 2024

Historic Market Size - Data Table on Global Wine Tourism Market 2020 - 2024 ($ million)

5.2 Event Type segment analysis 2020 - 2024

Historic Market Size - Event Type Segment 2020 - 2024 ($ million)

5.3 Channel segment analysis 2020 - 2024

Historic Market Size - Channel Segment 2020 - 2024 ($ million)

5.4 Type segment analysis 2020 - 2024

Historic Market Size - Type Segment 2020 - 2024 ($ million)

5.5 Geography segment analysis 2020 - 2024

Historic Market Size - Geography Segment 2020 - 2024 ($ million)

5.6 Country segment analysis 2020 - 2024

Historic Market Size - Country Segment 2020 - 2024 ($ million)

6. Qualitative Analysis

6.1 Impact of AI on Global Wine Tourism Market

6.2 Impact of geopolitical conflicts on Global Wine Tourism Market

7. Five Forces Analysis

7.1 Five forces summary

Five forces analysis - Comparison between 2025 and 2030

7.2 Bargaining power of buyers

Bargaining power of buyers - Impact of key factors 2025 and 2030

7.3 Bargaining power of suppliers

Bargaining power of suppliers - Impact of key factors in 2025 and 2030

7.4 Threat of new entrants

Threat of new entrants - Impact of key factors in 2025 and 2030

7.5 Threat of substitutes

Threat of substitutes - Impact of key factors in 2025 and 2030

7.6 Threat of rivalry

Threat of rivalry - Impact of key factors in 2025 and 2030

7.7 Market condition

Chart on Market condition - Five forces 2025 and 2030

8. Market Segmentation by Event Type

8.1 Market segments

Chart on Event Type - Market share 2025-2030 (%)
Data Table on Event Type - Market share 2025-2030 (%)

8.2 Comparison by Event Type

Chart on Comparison by Event Type
Data Table on Comparison by Event Type

8.3 Wine tastings and tours - Market size and forecast 2025-2030

Chart on Wine tastings and tours - Market size and forecast 2025-2030 ($ million)
Data Table on Wine tastings and tours - Market size and forecast 2025-2030 ($ million)
Chart on Wine tastings and tours - Year-over-year growth 2025-2030 (%)
Data Table on Wine tastings and tours - Year-over-year growth 2025-2030 (%)

8.4 Wine festivals and events - Market size and forecast 2025-2030

Chart on Wine festivals and events - Market size and forecast 2025-2030 ($ million)
Data Table on Wine festivals and events - Market size and forecast 2025-2030 ($ million)
Chart on Wine festivals and events - Year-over-year growth 2025-2030 (%)
Data Table on Wine festivals and events - Year-over-year growth 2025-2030 (%)

8.5 Market opportunity by Event Type

Market opportunity by Event Type ($ million)
Data Table on Market opportunity by Event Type ($ million)

9. Market Segmentation by Channel

9.1 Market segments

Chart on Channel - Market share 2025-2030 (%)
Data Table on Channel - Market share 2025-2030 (%)

9.2 Comparison by Channel

Chart on Comparison by Channel
Data Table on Comparison by Channel

9.3 Offline - Market size and forecast 2025-2030

Chart on Offline - Market size and forecast 2025-2030 ($ million)
Data Table on Offline - Market size and forecast 2025-2030 ($ million)
Chart on Offline - Year-over-year growth 2025-2030 (%)
Data Table on Offline - Year-over-year growth 2025-2030 (%)

9.4 Online - Market size and forecast 2025-2030

Chart on Online - Market size and forecast 2025-2030 ($ million)
Data Table on Online - Market size and forecast 2025-2030 ($ million)
Chart on Online - Year-over-year growth 2025-2030 (%)
Data Table on Online - Year-over-year growth 2025-2030 (%)

9.5 Market opportunity by Channel

Market opportunity by Channel ($ million)
Data Table on Market opportunity by Channel ($ million)

10. Market Segmentation by Type

10.1 Market segments

Chart on Type - Market share 2025-2030 (%)
Data Table on Type - Market share 2025-2030 (%)

10.2 Comparison by Type

Chart on Comparison by Type
Data Table on Comparison by Type

10.3 Domestic - Market size and forecast 2025-2030

Chart on Domestic - Market size and forecast 2025-2030 ($ million)
Data Table on Domestic - Market size and forecast 2025-2030 ($ million)
Chart on Domestic - Year-over-year growth 2025-2030 (%)
Data Table on Domestic - Year-over-year growth 2025-2030 (%)

10.4 International - Market size and forecast 2025-2030

Chart on International - Market size and forecast 2025-2030 ($ million)
Data Table on International - Market size and forecast 2025-2030 ($ million)
Chart on International - Year-over-year growth 2025-2030 (%)
Data Table on International - Year-over-year growth 2025-2030 (%)

10.5 Market opportunity by Type

Market opportunity by Type ($ million)
Data Table on Market opportunity by Type ($ million)

11. Customer Landscape

11.1 Customer landscape overview

Analysis of price sensitivity, lifecycle, customer purchase basket, adoption rates, and purchase criteria

12. Geographic Landscape

12.1 Geographic segmentation

Chart on Market share by geography 2025-2030 (%)
Data Table on Market share by geography 2025-2030 (%)

12.2 Geographic comparison

Chart on Geographic comparison
Data Table on Geographic comparison

12.3 Europe - Market size and forecast 2025-2030

Chart on Europe - Market size and forecast 2025-2030 ($ million)
Data Table on Europe - Market size and forecast 2025-2030 ($ million)
Chart on Europe - Year-over-year growth 2025-2030 (%)
Data Table on Europe - Year-over-year growth 2025-2030 (%)
Chart on Regional Comparison - Europe
Data Table on Regional Comparison - Europe

12.3.1 France - Market size and forecast 2025-2030

Chart on France - Market size and forecast 2025-2030 ($ million)
Data Table on France - Market size and forecast 2025-2030 ($ million)
Chart on France - Year-over-year growth 2025-2030 (%)
Data Table on France - Year-over-year growth 2025-2030 (%)

12.3.2 Italy - Market size and forecast 2025-2030

Chart on Italy - Market size and forecast 2025-2030 ($ million)
Data Table on Italy - Market size and forecast 2025-2030 ($ million)
Chart on Italy - Year-over-year growth 2025-2030 (%)
Data Table on Italy - Year-over-year growth 2025-2030 (%)

12.3.3 Spain - Market size and forecast 2025-2030

Chart on Spain - Market size and forecast 2025-2030 ($ million)
Data Table on Spain - Market size and forecast 2025-2030 ($ million)
Chart on Spain - Year-over-year growth 2025-2030 (%)
Data Table on Spain - Year-over-year growth 2025-2030 (%)

12.3.4 Germany - Market size and forecast 2025-2030

Chart on Germany - Market size and forecast 2025-2030 ($ million)
Data Table on Germany - Market size and forecast 2025-2030 ($ million)
Chart on Germany - Year-over-year growth 2025-2030 (%)
Data Table on Germany - Year-over-year growth 2025-2030 (%)

12.3.5 UK - Market size and forecast 2025-2030

Chart on UK - Market size and forecast 2025-2030 ($ million)
Data Table on UK - Market size and forecast 2025-2030 ($ million)
Chart on UK - Year-over-year growth 2025-2030 (%)
Data Table on UK - Year-over-year growth 2025-2030 (%)

12.3.6 The Netherlands - Market size and forecast 2025-2030

Chart on The Netherlands - Market size and forecast 2025-2030 ($ million)
Data Table on The Netherlands - Market size and forecast 2025-2030 ($ million)
Chart on The Netherlands - Year-over-year growth 2025-2030 (%)
Data Table on The Netherlands - Year-over-year growth 2025-2030 (%)

12.4 North America - Market size and forecast 2025-2030

Chart on North America - Market size and forecast 2025-2030 ($ million)
Data Table on North America - Market size and forecast 2025-2030 ($ million)
Chart on North America - Year-over-year growth 2025-2030 (%)
Data Table on North America - Year-over-year growth 2025-2030 (%)
Chart on Regional Comparison - North America
Data Table on Regional Comparison - North America

12.4.1 US - Market size and forecast 2025-2030

Chart on US - Market size and forecast 2025-2030 ($ million)
Data Table on US - Market size and forecast 2025-2030 ($ million)
Chart on US - Year-over-year growth 2025-2030 (%)
Data Table on US - Year-over-year growth 2025-2030 (%)

12.4.2 Canada - Market size and forecast 2025-2030

Chart on Canada - Market size and forecast 2025-2030 ($ million)
Data Table on Canada - Market size and forecast 2025-2030 ($ million)
Chart on Canada - Year-over-year growth 2025-2030 (%)
Data Table on Canada - Year-over-year growth 2025-2030 (%)

12.4.3 Mexico - Market size and forecast 2025-2030

Chart on Mexico - Market size and forecast 2025-2030 ($ million)
Data Table on Mexico - Market size and forecast 2025-2030 ($ million)
Chart on Mexico - Year-over-year growth 2025-2030 (%)
Data Table on Mexico - Year-over-year growth 2025-2030 (%)

12.5 APAC - Market size and forecast 2025-2030

Chart on APAC - Market size and forecast 2025-2030 ($ million)
Data Table on APAC - Market size and forecast 2025-2030 ($ million)
Chart on APAC - Year-over-year growth 2025-2030 (%)
Data Table on APAC - Year-over-year growth 2025-2030 (%)
Chart on Regional Comparison - APAC
Data Table on Regional Comparison - APAC

12.5.1 Australia - Market size and forecast 2025-2030

Chart on Australia - Market size and forecast 2025-2030 ($ million)
Data Table on Australia - Market size and forecast 2025-2030 ($ million)
Chart on Australia - Year-over-year growth 2025-2030 (%)
Data Table on Australia - Year-over-year growth 2025-2030 (%)

12.5.2 China - Market size and forecast 2025-2030

Chart on China - Market size and forecast 2025-2030 ($ million)
Data Table on China - Market size and forecast 2025-2030 ($ million)
Chart on China - Year-over-year growth 2025-2030 (%)
Data Table on China - Year-over-year growth 2025-2030 (%)

12.5.3 Japan - Market size and forecast 2025-2030

Chart on Japan - Market size and forecast 2025-2030 ($ million)
Data Table on Japan - Market size and forecast 2025-2030 ($ million)
Chart on Japan - Year-over-year growth 2025-2030 (%)
Data Table on Japan - Year-over-year growth 2025-2030 (%)

12.5.4 South Korea - Market size and forecast 2025-2030

Chart on South Korea - Market size and forecast 2025-2030 ($ million)
Data Table on South Korea - Market size and forecast 2025-2030 ($ million)
Chart on South Korea - Year-over-year growth 2025-2030 (%)
Data Table on South Korea - Year-over-year growth 2025-2030 (%)

12.5.5 India - Market size and forecast 2025-2030

Chart on India - Market size and forecast 2025-2030 ($ million)
Data Table on India - Market size and forecast 2025-2030 ($ million)
Chart on India - Year-over-year growth 2025-2030 (%)
Data Table on India - Year-over-year growth 2025-2030 (%)

12.5.6 Indonesia - Market size and forecast 2025-2030

Chart on Indonesia - Market size and forecast 2025-2030 ($ million)
Data Table on Indonesia - Market size and forecast 2025-2030 ($ million)
Chart on Indonesia - Year-over-year growth 2025-2030 (%)
Data Table on Indonesia - Year-over-year growth 2025-2030 (%)

12.6 South America - Market size and forecast 2025-2030

Chart on South America - Market size and forecast 2025-2030 ($ million)
Data Table on South America - Market size and forecast 2025-2030 ($ million)
Chart on South America - Year-over-year growth 2025-2030 (%)
Data Table on South America - Year-over-year growth 2025-2030 (%)
Chart on Regional Comparison - South America
Data Table on Regional Comparison - South America

12.6.1 Brazil - Market size and forecast 2025-2030

Chart on Brazil - Market size and forecast 2025-2030 ($ million)
Data Table on Brazil - Market size and forecast 2025-2030 ($ million)
Chart on Brazil - Year-over-year growth 2025-2030 (%)
Data Table on Brazil - Year-over-year growth 2025-2030 (%)

12.6.2 Argentina - Market size and forecast 2025-2030

Chart on Argentina - Market size and forecast 2025-2030 ($ million)
Data Table on Argentina - Market size and forecast 2025-2030 ($ million)
Chart on Argentina - Year-over-year growth 2025-2030 (%)
Data Table on Argentina - Year-over-year growth 2025-2030 (%)

12.6.3 Chile - Market size and forecast 2025-2030

Chart on Chile - Market size and forecast 2025-2030 ($ million)
Data Table on Chile - Market size and forecast 2025-2030 ($ million)
Chart on Chile - Year-over-year growth 2025-2030 (%)
Data Table on Chile - Year-over-year growth 2025-2030 (%)

12.7 Middle East and Africa - Market size and forecast 2025-2030

Chart on Middle East and Africa - Market size and forecast 2025-2030 ($ million)
Data Table on Middle East and Africa - Market size and forecast 2025-2030 ($ million)
Chart on Middle East and Africa - Year-over-year growth 2025-2030 (%)
Data Table on Middle East and Africa - Year-over-year growth 2025-2030 (%)
Chart on Regional Comparison - Middle East and Africa
Data Table on Regional Comparison - Middle East and Africa

12.7.1 Saudi Arabia - Market size and forecast 2025-2030

Chart on Saudi Arabia - Market size and forecast 2025-2030 ($ million)
Data Table on Saudi Arabia - Market size and forecast 2025-2030 ($ million)
Chart on Saudi Arabia - Year-over-year growth 2025-2030 (%)
Data Table on Saudi Arabia - Year-over-year growth 2025-2030 (%)

12.7.2 UAE - Market size and forecast 2025-2030

Chart on UAE - Market size and forecast 2025-2030 ($ million)
Data Table on UAE - Market size and forecast 2025-2030 ($ million)
Chart on UAE - Year-over-year growth 2025-2030 (%)
Data Table on UAE - Year-over-year growth 2025-2030 (%)

12.7.3 South Africa - Market size and forecast 2025-2030

Chart on South Africa - Market size and forecast 2025-2030 ($ million)
Data Table on South Africa - Market size and forecast 2025-2030 ($ million)
Chart on South Africa - Year-over-year growth 2025-2030 (%)
Data Table on South Africa - Year-over-year growth 2025-2030 (%)

12.7.4 Israel - Market size and forecast 2025-2030

Chart on Israel - Market size and forecast 2025-2030 ($ million)
Data Table on Israel - Market size and forecast 2025-2030 ($ million)
Chart on Israel - Year-over-year growth 2025-2030 (%)
Data Table on Israel - Year-over-year growth 2025-2030 (%)

12.7.5 Turkey - Market size and forecast 2025-2030

Chart on Turkey - Market size and forecast 2025-2030 ($ million)
Data Table on Turkey - Market size and forecast 2025-2030 ($ million)
Chart on Turkey - Year-over-year growth 2025-2030 (%)
Data Table on Turkey - Year-over-year growth 2025-2030 (%)

12.8 Market opportunity by geography

Market opportunity by geography ($ million)
Data Tables on Market opportunity by geography ($ million)

13. Drivers, Challenges, and Opportunity

13.1 Market drivers

Rising demand for experiential travel
Integration of sustainable practices
Expansion of digital booking platforms

13.2 Market challenges

Climate induced agricultural and operational vulnerabilities
Severe labor shortages and hospitality gaps
Infrastructure bottlenecks and overcrowding pressures

13.3 Impact of drivers and challenges

Impact of drivers and challenges in 2025 and 2030

13.4 Market opportunities

Integration of wellness and adventure
Rise of culinary and gastronomy
Expansion of wine festivals and events

14. Competitive Landscape

14.1 Overview

14.2

Overview on criticality of inputs and factors of differentiation

14.3 Landscape disruption

Overview on factors of disruption

14.4 Industry risks

Impact of key risks on business

15. Competitive Analysis

15.1 Companies profiled

Companies covered

15.2 Company ranking index

15.3 Market positioning of companies

Matrix on companies position and classification

15.4 Abercrombie and Kent

Abercrombie and Kent - Overview
Abercrombie and Kent - Product / Service
Abercrombie and Kent - Key offerings
SWOT

15.5 Airbnb Inc.

Airbnb Inc. - Overview
Airbnb Inc. - Product / Service
Airbnb Inc. - Key offerings
SWOT

15.6 Backroads Inc.

Backroads Inc. - Overview
Backroads Inc. - Product / Service
Backroads Inc. - Key offerings
SWOT

15.7 BKWine AB

BKWine AB - Overview
BKWine AB - Product / Service
BKWine AB - Key offerings
SWOT

15.8 Butterfield and Robinson Inc.

Butterfield and Robinson Inc. - Overview
Butterfield and Robinson Inc. - Product / Service
Butterfield and Robinson Inc. - Key offerings
SWOT

15.9 Classic Journeys LLC

Classic Journeys LLC - Overview
Classic Journeys LLC - Product / Service
Classic Journeys LLC - Key offerings
SWOT

15.10 Context Travel LLC

Context Travel LLC - Overview
Context Travel LLC - Product / Service
Context Travel LLC - Key offerings
SWOT

15.11 Expedia Group Inc.

Expedia Group Inc. - Overview
Expedia Group Inc. - Business segments
Expedia Group Inc. - Key offerings
Expedia Group Inc. - Segment focus
SWOT

15.12 G Adventures Inc.

G Adventures Inc. - Overview
G Adventures Inc. - Product / Service
G Adventures Inc. - Key offerings
SWOT

15.13 Intrepid Group Pty Ltd.

Intrepid Group Pty Ltd. - Overview
Intrepid Group Pty Ltd. - Product / Service
Intrepid Group Pty Ltd. - Key offerings
SWOT

15.14 Klook Travel Technology Ltd

Klook Travel Technology Ltd - Overview
Klook Travel Technology Ltd - Product / Service
Klook Travel Technology Ltd - Key offerings
SWOT

15.15 TCS World Travel Inc.

TCS World Travel Inc. - Overview
TCS World Travel Inc. - Product / Service
TCS World Travel Inc. - Key offerings
SWOT

15.16 TourRadar GmbH

TourRadar GmbH - Overview
TourRadar GmbH - Product / Service
TourRadar GmbH - Key offerings
SWOT

15.17 Trafalgar

Trafalgar - Overview
Trafalgar - Product / Service
Trafalgar - Key offerings
SWOT

15.18 TripAdvisor Inc.

TripAdvisor Inc. - Overview
TripAdvisor Inc. - Business segments
TripAdvisor Inc. - Key offerings
TripAdvisor Inc. - Segment focus
SWOT

16. Appendix

16.1 Scope of the report

Market definition
Objectives
Notes and caveats

16.2 Inclusions and exclusions checklist

Inclusions checklist
Exclusions checklist

16.3 Currency conversion rates for US$

16.4 Research methodology

16.5 Data procurement

Information sources

16.6 Data validation

16.7 Validation techniques employed for market sizing

16.8 Data synthesis

16.9 360 degree market analysis

16.10 List of abbreviations

Research Methodology

Technavio presents a detailed picture of the market by way of study, synthesis, and summation of data from multiple sources. The analysts have presented the various facets of the market with a particular focus on identifying the key industry influencers. The data thus presented is comprehensive, reliable, and the result of extensive research, both primary and secondary.

INFORMATION SOURCES

Primary sources

  • Manufacturers and suppliers
  • Channel partners
  • Industry experts
  • Strategic decision makers

Secondary sources

  • Industry journals and periodicals
  • Government data
  • Financial reports of key industry players
  • Historical data
  • Press releases

DATA ANALYSIS

Data Synthesis

  • Collation of data
  • Estimation of key figures
  • Analysis of derived insights

Data Validation

  • Triangulation with data models
  • Reference against proprietary databases
  • Corroboration with industry experts

REPORT WRITING

Qualitative

  • Market drivers
  • Market challenges
  • Market trends
  • Five forces analysis

Quantitative

  • Market size and forecast
  • Market segmentation
  • Geographical insights
  • Competitive landscape

Interested in this report?

Get your sample now to see our research methodology and insights!

Download Now

Frequently Asked Questions

Wine Tourism market growth will increase by USD 13927.1 million during 2026-2030.

The Wine Tourism market is expected to grow at a CAGR of 13.8% during 2026-2030.

Wine Tourism market is segmented by Event type (Wine tastings and tours, Wine festivals and events) Channel (Offline, Online) Type (Domestic, International)

Abercrombie and Kent, Airbnb Inc., Backroads Inc., BKWine AB, Butterfield and Robinson Inc., Cellar Tours, Classic Journeys LLC, Collette Travel Service Inc., Context Travel LLC, Expedia Group Inc., G Adventures Inc., GetYourGuide GmbH, Gourmet On Tour Ltd., Intrepid Group Pty Ltd., Klook Travel Technology Ltd, SmoothRed Ltd., TCS World Travel Inc., TourRadar GmbH, Trafalgar, TripAdvisor Inc., VBT Bicycling Vacations, Wine Paths SAS, Winerist Ltd., Zephyr Adventures LLC are a few of the key vendors in the Wine Tourism market.

Europe will register the highest growth rate of 41.7% among the other regions. Therefore, the Wine Tourism market in Europe is expected to garner significant business opportunities for the vendors during the forecast period.

France, Italy, Spain, Germany, UK, The Netherlands, US, Canada, Mexico, Australia, China, Japan, South Korea, India, Indonesia, Brazil, Argentina, Chile, Saudi Arabia, UAE, South Africa, Israel, Turkey

  • Rising demand for experiential travel is the driving factor this market.

The Wine Tourism market vendors should focus on grabbing business opportunities from the Event type segment as it accounted for the largest market share in the base year.
RIA - Research AI Assistant
Ask RIA
