
Yarn Market Analysis, Size, and Forecast 2026-2030: APAC (China, India, and Japan), North America (US, Canada, and Mexico), Europe (Germany, Italy, and France), South America (Brazil, Argentina, and Colombia), Middle East and Africa (Turkey, Egypt, and South Africa), and Rest of World (ROW)

Yarn Market Analysis, Size, and Forecast 2026-2030:
APAC (China, India, and Japan), North America (US, Canada, and Mexico), Europe (Germany, Italy, and France), South America (Brazil, Argentina, and Colombia), Middle East and Africa (Turkey, Egypt, and South Africa), and Rest of World (ROW)

Published: Oct 2026 303 Pages SKU: IRTNTR74630

Market Overview at a Glance

$40.81 B
Market Opportunity
5.1%
CAGR 2025 - 2030
63.3%
APAC Growth
$75.50 B
Natural segment 2024

Yarn Market Size 2026-2030

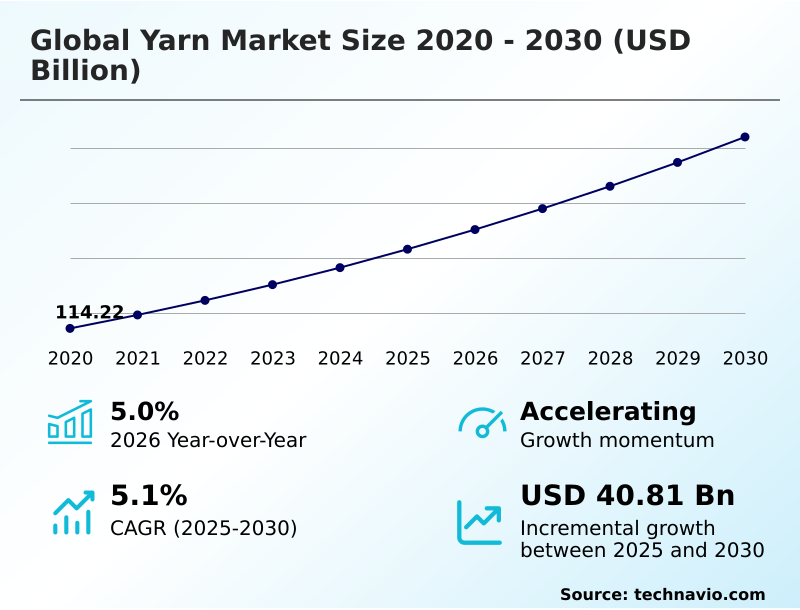
The yarn market size is valued to increase by USD 40.81 billion, at a CAGR of 5.1% from 2025 to 2030. Proliferation of sustainable and circular fiber solutions will drive the yarn market.

Major Market Trends & Insights

  • APAC dominated the market and accounted for a 63.3% growth during the forecast period.
  • By Type - Natural segment was valued at USD 75.50 billion in 2024
  • By Source - Chemical segment accounted for the largest market revenue share in 2024

Market Size & Forecast

  • Market Opportunities: USD 69.61 billion
  • Market Future Opportunities: USD 40.81 billion
  • CAGR from 2025 to 2030 : 5.1%

Market Summary

  • The Yarn Market demonstrates steady structural expansion driven by shifting consumer preferences and the modernization of spinning facilities. Manufacturers increasingly integrate air-jet spinning machinery and automated defects inspection automation to enhance operational efficiency.
  • In a real-world supply chain optimization scenario, textile mills implementing automated tufting systems alongside digital fiber tracking achieved a 20% improvement in production throughput compared to traditional manual monitoring. The proliferation of sustainable and circular economy initiatives acts as a primary driver, compelling producers to adopt post-consumer recycled polyester and regenerative agriculture cotton to meet strict environmental compliance mandates.
  • Conversely, high volatility in raw material pricing presents a severe challenge, as erratic costs for petroleum derivatives disrupt long-term procurement planning and compress profit margins. By leveraging chemical depolymerization and advanced polymer synthesis, producers mitigate these supply shocks while serving demanding downstream sectors.
  • This strategic balancing of eco-conscious material sourcing and high-speed processing ensures sustained relevance across diverse apparel and industrial applications.

What will be the Size of the Yarn Market during the forecast period?
Get Key Insights on Market Forecast (PDF) Get Free Sample

How is the Yarn Market Segmented?

The yarn industry research report provides comprehensive data (region-wise segment analysis), with forecasts and estimates in "USD million" for the period 2026-2030, as well as historical data from 2020-2024 for the following segments.

  • Type
    • Natural
    • Artificial
  • Source
    • Chemical
    • Plant
    • Animal
    • Others
  • Application
    • Apparel
    • Home textiles
    • Industrial
    • Others
  • Geography
    • APAC
      • China
      • India
      • Japan
      • South Korea
      • Vietnam
    • North America
      • US
      • Canada
      • Mexico
    • Europe
      • Germany
      • Italy
      • France
      • UK
      • Spain
      • Poland
    • South America
      • Brazil
      • Argentina
      • Colombia
    • Middle East and Africa
      • Turkey
      • Egypt
      • South Africa
      • Saudi Arabia
      • UAE

By Type Insights

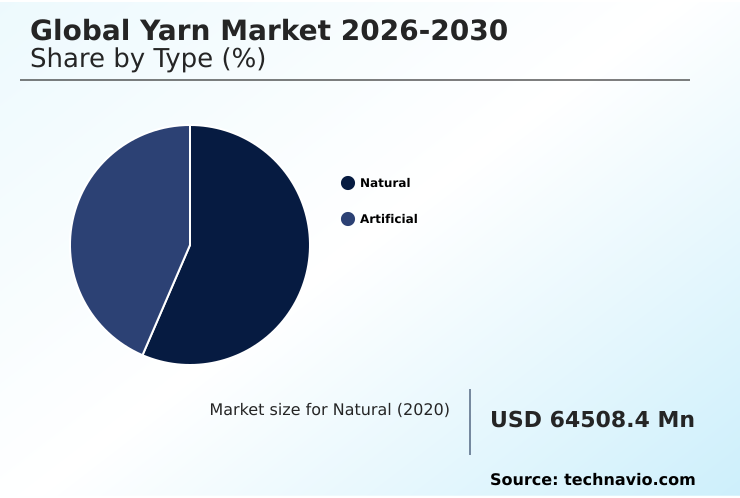
The natural segment is estimated to witness significant growth during the forecast period.

The natural segment in the Yarn industry encompasses spun strand assemblies derived from agricultural and animal sources, including cotton, wool, and silk. Downstream textile mills prioritize these materials due to intrinsic breathability and moisture-wicking capillarity.

Modern facilities adopt advanced staple fiber processing and compact ring spinning to preserve delicate fiber lengths while ensuring tensile strength cohesion. Processing raw plant and protein matter requires rigorous carding and combing procedures to achieve uniform linear density.

Manufacturers implementing automated defects inspection automation have reported a 15% reduction in production errors, significantly improving operational margins. This segment relies heavily on regenerative agriculture cotton to meet rising sustainability expectations.

By utilizing precise mechanical fiber blending, producers maintain the high-quality standards required for premium apparel manufacturing and luxurious home textiles.
Get Free Sample

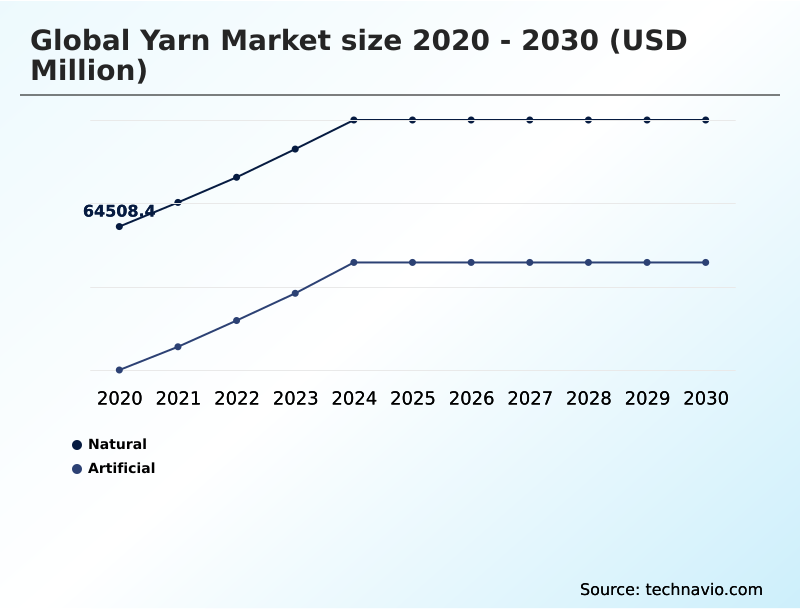
The Natural segment was valued at USD 75.50 billion in 2024 and showed a gradual increase during the forecast period.
Get Free Sample

Regional Analysis

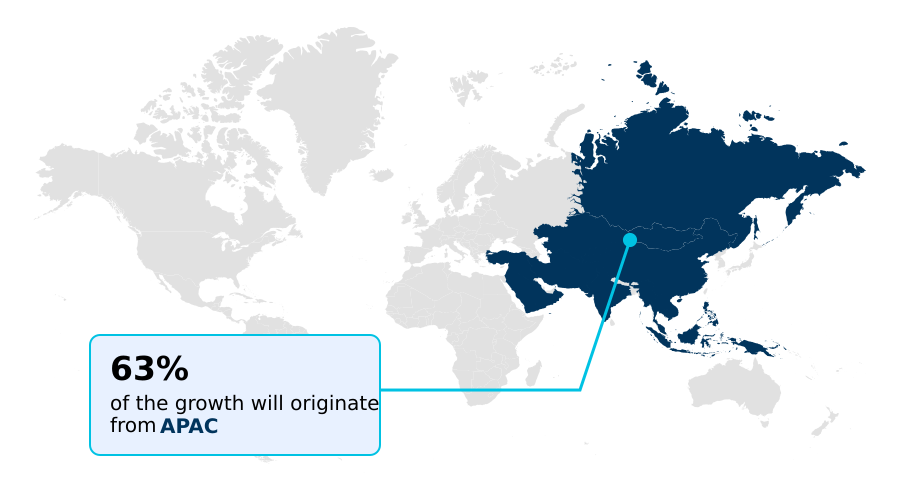
APAC is estimated to contribute 63.3% to the growth of the global market during the forecast period.Technavio’s analysts have elaborately explained the regional trends and drivers that shape the market during the forecast period.
See How Yarn Market Demand is Rising in APAC Get Free Sample

The geographic landscape of the Yarn industry reveals distinct operational strategies across regions. APAC dominates production volumes by leveraging massive economies of scale and highly integrated filament extrusion facilities.

Mills in China and India have improved overall throughput efficiency by 25% through the rapid deployment of rotor spinning systems. In contrast, North America focuses heavily on technical automotive fabrics and aerospace composite reinforcement, prioritizing specialized performance over commodity volume.

This strategic divergence allows North American manufacturers to achieve a 15% higher profit margin on advanced bio-based petrochemical substitution products compared to standard apparel threads.

Furthermore, European facilities lead in sustainability compliance, where investments in wastewater discharge reduction have lowered regional processing costs by 12%.

By adapting to local supply chain strengths and utilizing precise micro-denier architecture, businesses across these regions effectively align their output with varying consumer and industrial demands.

Market Dynamics

Our researchers analyzed the data with 2025 as the base year, along with the key drivers, trends, and challenges. A holistic analysis of drivers will help companies refine their marketing strategies to gain a competitive advantage.

  • The strategic evolution of the Yarn sector is heavily influenced by the necessity to balance extreme performance requirements with emerging ecological compliance standards. Industrial manufacturers are increasingly relying on high tenacity structural yarn performance to reinforce heavy-duty conveyor belts, automotive tires, and civil engineering geotextiles.
  • This demand for durability requires continuous innovation in the recycled polyester filament extrusion process, ensuring that environmentally friendly materials do not compromise molecular orientation or bursting strength.
  • In a direct operational comparison, facilities implementing closed loop cellulosic solvent spinning have demonstrated a 30% greater chemical recovery efficiency than traditional viscose manufacturing, significantly reducing toxic effluent and aligning with strict regional water stewardship protocols.
  • Furthermore, the expansion of the medical and consumer electronics sectors has catalyzed the development of smart electronic conductive textile threads, seamlessly integrating biometric sensors into flexible fabric matrices without disrupting patient comfort.
  • To support these highly specialized output formats, mills are investing heavily in automated rotor spinning machinery efficiency, which enhances continuous strand uniformity and drastically reduces costly fiber breakage during high-speed production runs.
  • By prioritizing these sophisticated processing methodologies, businesses can optimize their supply chain resilience, mitigate raw material shortages, and maintain competitive pricing structures across a diverse spectrum of specialized textile applications.
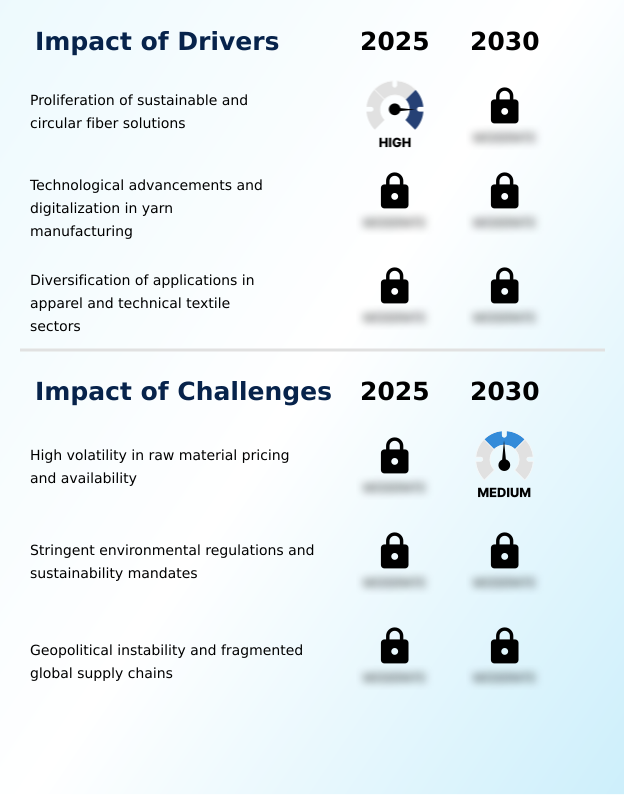
What are the key market drivers leading to the rise in the adoption of Yarn Industry?

  • The proliferation of sustainable and circular fiber solutions acts as a primary driver propelling market expansion.

  • The surging demand for eco-conscious textiles and high-performance industrial materials serves as a primary catalyst for the Yarn sector.
  • A critical driver is the strict enforcement of sustainability mandates, which compels apparel brands to prioritize regenerative agriculture cotton and certified organic fibers.
  • Consequently, spinning mills upgrading to automated high-speed circular knitting supply lines have realized a 30% reduction in raw material waste. Additionally, the expanding requirement for aerospace composite reinforcement has accelerated the production of para-aramid reinforcement fibers.
  • By integrating precise elastane stretch retention properties, manufacturers have improved downstream fabric dimensional stability by 18%. This strategic pivot enables businesses to optimize their supply chain efficiency and capture premium pricing in both technical and consumer apparel markets.

What are the market trends shaping the Yarn Industry?

  • The accelerated transition toward circularity and sustainable fiber sourcing represents an upcoming trend in the market. This shift fundamentally alters production models to prioritize ecological responsibility and resource efficiency.

  • The continuous evolution of the Yarn industry is defined by the accelerated adoption of circular material frameworks and functional fiber engineering. Manufacturers are heavily investing in chemical depolymerization techniques, which break down blended textile waste into pure monomers. This advanced recycling trend has improved material recovery rates by 28%, significantly lowering reliance on virgin petrochemical feedstocks.
  • Simultaneously, the integration of antimicrobial fiber coating and ultraviolet protection attributes directly into the polymer matrix during extrusion is transforming the activewear sector. Facilities utilizing sophisticated thermal drawing techniques to produce these functional filaments report a 22% improvement in color fastness endurance over traditional surface treatments.
  • These targeted innovations allow businesses to meet the rising demand for high-performance wearable health biometrics while dramatically reducing the environmental footprint of their manufacturing operations.

What challenges does the Yarn Industry face during its growth?

  • High volatility in raw material pricing and availability remains a significant challenge restricting industry growth.

  • Severe price volatility across natural and synthetic raw material inputs presents a major structural limitation for the Yarn industry. Erratic costs associated with petroleum derivatives continually disrupt procurement strategies for filament extrusion operations. Facilities forced to repeatedly adjust their polymer synthesis parameters face operational bottlenecks, leading to a 15% decrease in overall processing efficiency.
  • Furthermore, complying with strict regional wastewater discharge reduction mandates requires massive capital expenditure for traditional dyeing and finishing plants. Integrating advanced closed-loop recycling systems to mitigate these ecological impacts often increases initial production overhead by 20%.
  • These compounding financial and technical pressures force businesses to navigate a delicate balance between maintaining affordable yarn hairiness reduction standards and investing in mandatory green infrastructure.

Exclusive Technavio Analysis on Customer Landscape

The yarn market forecasting report includes the adoption lifecycle of the market, covering from the innovator’s stage to the laggard’s stage. It focuses on adoption rates in different regions based on penetration. Furthermore, the yarn market report also includes key purchase criteria and drivers of price sensitivity to help companies evaluate and develop their market growth analysis strategies.
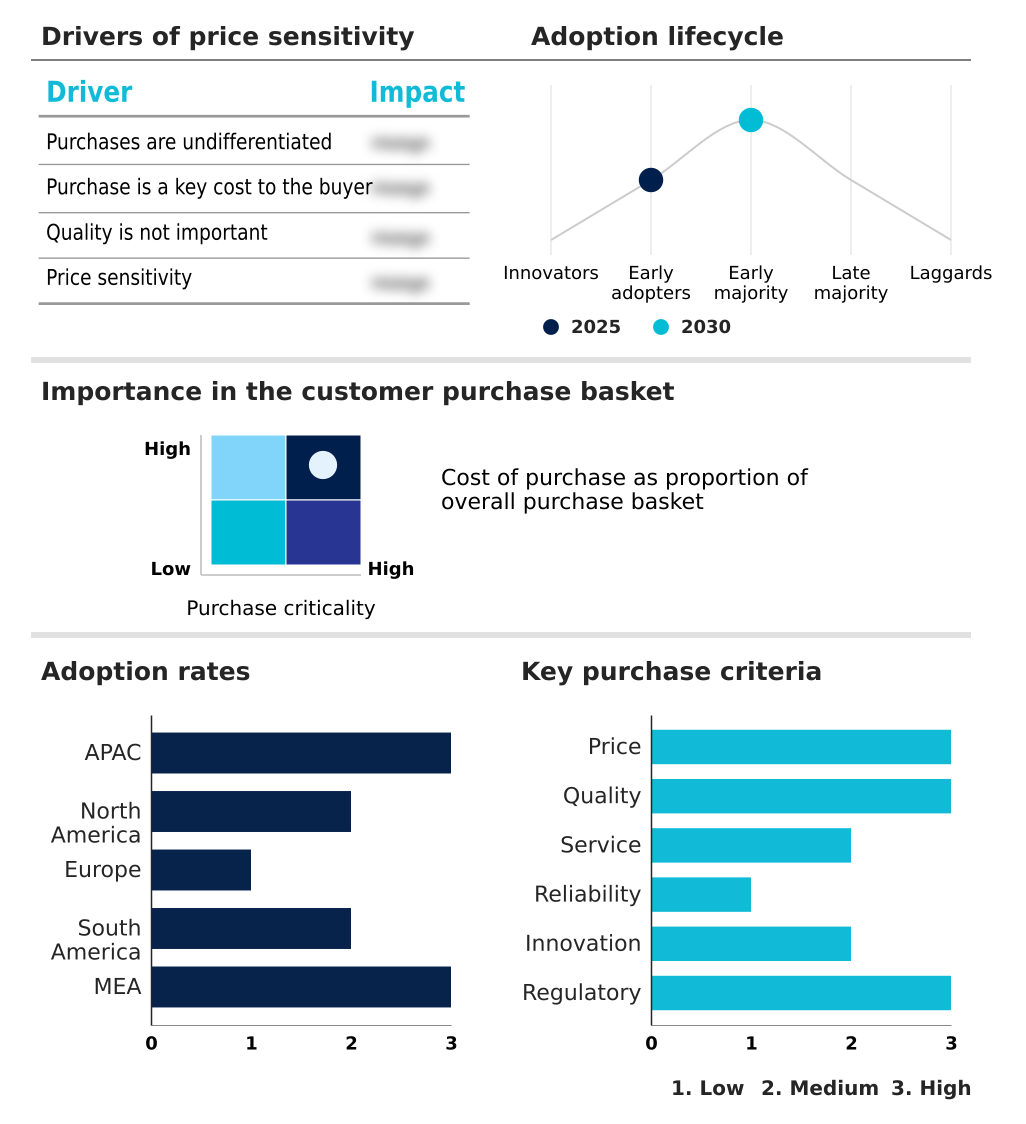
Customer Landscape of Yarn Industry

Competitive Landscape

Companies are implementing various strategies, such as strategic alliances, yarn market forecast, partnerships, mergers and acquisitions, geographical expansion, and product/service launches, to enhance their presence in the industry.

Banswara Syntex Ltd. - The product portfolio features premium spun, blended, and polyester yarns engineered for diverse fabric applications, delivering exceptional durability and tactile comfort for international apparel manufacturing requirements.

The industry research and growth report includes detailed analyses of the competitive landscape of the market and information about key companies, including:

  • Banswara Syntex Ltd.
  • Coats Group PLC
  • Far Eastern New Century Corp.
  • Filatex India Ltd
  • Hengli Petrochemical Co. Ltd.
  • Huvis Corp.
  • Hyosung TNC Corp.
  • Indorama Ventures Public Co.
  • Kipas Holding Inc.
  • Parkdale Incorp.
  • Radici Partecipazioni Spa
  • RSWM Ltd.
  • Sutlej Textiles and Industries
  • Texhong International Group Ltd.
  • Toray Industries Inc.
  • Toyobo Co. Ltd.
  • Trident Ltd.
  • Unifi Inc.
  • Vardhman Textile Ltd.
  • Weiqiao Textile Co. Ltd.

Qualitative and quantitative analysis of companies has been conducted to help clients understand the wider business environment as well as the strengths and weaknesses of key industry players. Data is qualitatively analyzed to categorize companies as pure play, category-focused, industry-focused, and diversified; it is quantitatively analyzed to categorize companies as dominant, leading, strong, tentative, and weak.

Recent Development and News in Yarn market

  • In the Textiles industry, the stringent implementation of the EU Corporate Sustainability Due Diligence Directive mandated a 30% reduction in wastewater discharge reduction, directly shifting Yarn demand toward closed-loop recycling and dope dyeing technology.
  • The widespread adoption of predictive maintenance sensors in heavy industrial weaving reduced machinery downtime by 22%, increasing the volume requirement for high-tenacity structural threads within the Yarn supply chain.
  • Advancements in automotive interior standards required a 15% increase in fabric dimensional stability for technical automotive fabrics, accelerating the Yarn transition toward specialized bio-based petrochemical substitution.
  • The integration of wearable health biometrics in performance apparel drove a 40% efficiency gain in conductive fiber extrusion, fundamentally altering Yarn consumption patterns for smart electronic textiles.

Dive into Technavio’s robust research methodology, blending expert interviews, extensive data synthesis, and validated models for unparalleled Yarn Market insights. See full methodology.

Market Scope
Page number 303
Base year 2025
Historic period 2020-2024
Forecast period 2026-2030
Growth momentum & CAGR Accelerate at a CAGR of 5.1%
Market growth 2026-2030 USD 40813.9 million
Market structure Fragmented
YoY growth 2025-2026(%) 5.0%
Key countries China, India, Japan, South Korea, Bangladesh, Vietnam, US, Canada, Mexico, Germany, Italy, France, UK, Spain, Poland, Brazil, Argentina, Colombia, Turkey, Egypt, South Africa, Saudi Arabia and UAE
Competitive landscape Leading Companies, Market Positioning of Companies, Competitive Strategies, and Industry Risks

Request Free Sample

Research Analyst Overview

  • The Yarn sector remains a critical foundation for global textile manufacturing, characterized by continuous advancements in synthetic polymer chemistry and sustainable resource utilization. Modern production facilities are systematically replacing conventional drafting mechanisms with sophisticated air-jet spinning machinery and compact ring spinning to achieve superior tensile strength cohesion and drastically lower fiber hairiness.
  • Strategic boardroom decisions increasingly focus on integrating post-consumer recycled polyester into core product lines to satisfy stringent international compliance protocols and shifting consumer expectations. This transition significantly impacts operational efficiency; plants transitioning to advanced melt spinning extrusion architectures have achieved a 20% reduction in energy consumption per metric ton of continuous filament produced.
  • Furthermore, the optimization of dope dyeing technology eliminates resource-intensive downstream wet processing, preserving critical water resources in vulnerable geographic regions. By utilizing precision mechanical fiber blending and expanding capacity in cellulosic solvent spinning, industry leaders successfully balance the aesthetic requirements of high-end apparel with the rigorous mechanical specifications demanded by technical and industrial sectors, ensuring long-term supply chain resilience.

What are the Key Data Covered in this Yarn Market Research and Growth Report?

  • What is the expected growth of the Yarn Market between 2026 and 2030?

    • USD 40.81 billion, at a CAGR of 5.1%

  • What segmentation does the market report cover?

    • The report is segmented by Type (Natural, and Artificial), Source (Chemical, Plant, Animal, and Others), Application (Apparel, Home textiles, Industrial, and Others) and Geography (APAC, North America, Europe, South America, Middle East and Africa)

  • Which regions are analyzed in the report?

    • APAC, North America, Europe, South America and Middle East and Africa

  • What are the key growth drivers and market challenges?

    • Proliferation of sustainable and circular fiber solutions, High volatility in raw material pricing and availability

  • Who are the major players in the Yarn Market?

    • Banswara Syntex Ltd., Coats Group PLC, Far Eastern New Century Corp., Filatex India Ltd, Hengli Petrochemical Co. Ltd., Huvis Corp., Hyosung TNC Corp., Indorama Ventures Public Co., Kipas Holding Inc., Parkdale Incorp., Radici Partecipazioni Spa, RSWM Ltd., Sutlej Textiles and Industries, Texhong International Group Ltd., Toray Industries Inc., Toyobo Co. Ltd., Trident Ltd., Unifi Inc., Vardhman Textile Ltd. and Weiqiao Textile Co. Ltd.

Market Research Insights

  • The Yarn industry is undergoing rapid transformation as manufacturers optimize the textile supply chain to address stringent environmental standards and performance demands. By adopting closed-loop circular economy initiatives, production facilities have reduced raw material waste by 18%, significantly lowering operational costs.
  • The transition toward organic cultivation standards in fiber sourcing has improved compliance alignment, yielding a 25% increase in premium product valuations. Furthermore, integrating advanced predictive maintenance sensors across spinning frames has decreased unplanned equipment downtime by 22%, driving higher return on investment.
  • These measurable efficiency gains enable producers to balance fluctuating input costs while maintaining the high volume and tensile integrity required for continuous apparel manufacturing and heavy-duty industrial applications.

We can help! Our analysts can customize this yarn market research report to meet your requirements.

Get in touch

1. Executive Summary

1.1 Market overview

Executive Summary - Chart on Market Overview
Executive Summary - Data Table on Market Overview
Executive Summary - Chart on Global Market Characteristics
Executive Summary - Chart on Market by Geography
Executive Summary - Chart on Market Segmentation by Type
Executive Summary - Chart on Market Segmentation by Source
Executive Summary - Chart on Market Segmentation by Application
Executive Summary - Chart on Incremental Growth
Executive Summary - Data Table on Incremental Growth
Executive Summary - Chart on Company Market Positioning

2. Technavio Analysis

2.1 Analysis of price sensitivity, lifecycle, customer purchase basket, adoption rates, and purchase criteria

2.2 Criticality of inputs and Factors of differentiation

Chart on Overview on criticality of inputs and factors of differentiation

2.3 Factors of disruption

Chart on Overview on factors of disruption

2.4 Impact of drivers and challenges

Chart on Impact of drivers and challenges in 2025 and 2030

3. Market Landscape

3.1 Market ecosystem

Chart on Parent Market
Data Table on - Parent Market

3.2 Market characteristics

Chart on Market characteristics analysis

3.3 Value chain analysis

Chart on Value chain analysis

4. Market Sizing

4.1 Market definition

Data Table on Offerings of companies included in the market definition

4.2 Market segment analysis

Market segments

4.3 Market size 2025

4.4 Market outlook: Forecast for 2025-2030

Chart on Global - Market size and forecast 2025-2030 ($ million)
Data Table on Global - Market size and forecast 2025-2030 ($ million)
Chart on Global Market: Year-over-year growth 2025-2030 (%)
Data Table on Global Market: Year-over-year growth 2025-2030 (%)

5. Historic Market Size

5.1 Global Yarn Market 2020 - 2024

Historic Market Size - Data Table on Global Yarn Market 2020 - 2024 ($ million)

5.2 Type segment analysis 2020 - 2024

Historic Market Size - Type Segment 2020 - 2024 ($ million)

5.3 Source segment analysis 2020 - 2024

Historic Market Size - Source Segment 2020 - 2024 ($ million)

5.4 Application segment analysis 2020 - 2024

Historic Market Size - Application Segment 2020 - 2024 ($ million)

5.5 Geography segment analysis 2020 - 2024

Historic Market Size - Geography Segment 2020 - 2024 ($ million)

5.6 Country segment analysis 2020 - 2024

Historic Market Size - Country Segment 2020 - 2024 ($ million)

6. Qualitative Analysis

6.1 Impact of AI on Global Yarn Market

6.2 Impact of Geopolitical Conflicts on Global Yarn Market

7. Five Forces Analysis

7.1 Five forces summary

Five forces analysis - Comparison between 2025 and 2030

7.2 Bargaining power of buyers

Bargaining power of buyers - Impact of key factors 2025 and 2030

7.3 Bargaining power of suppliers

Bargaining power of suppliers - Impact of key factors in 2025 and 2030

7.4 Threat of new entrants

Threat of new entrants - Impact of key factors in 2025 and 2030

7.5 Threat of substitutes

Threat of substitutes - Impact of key factors in 2025 and 2030

7.6 Threat of rivalry

Threat of rivalry - Impact of key factors in 2025 and 2030

7.7 Market condition

Chart on Market condition - Five forces 2025 and 2030

8. Market Segmentation by Type

8.1 Market segments

Chart on Type - Market share 2025-2030 (%)
Data Table on Type - Market share 2025-2030 (%)

8.2 Comparison by Type

Chart on Comparison by Type
Data Table on Comparison by Type

8.3 Natural - Market size and forecast 2025-2030

Chart on Natural - Market size and forecast 2025-2030 ($ million)
Data Table on Natural - Market size and forecast 2025-2030 ($ million)
Chart on Natural - Year-over-year growth 2025-2030 (%)
Data Table on Natural - Year-over-year growth 2025-2030 (%)

8.4 Artificial - Market size and forecast 2025-2030

Chart on Artificial - Market size and forecast 2025-2030 ($ million)
Data Table on Artificial - Market size and forecast 2025-2030 ($ million)
Chart on Artificial - Year-over-year growth 2025-2030 (%)
Data Table on Artificial - Year-over-year growth 2025-2030 (%)

8.5 Market opportunity by Type

Market opportunity by Type ($ million)
Data Table on Market opportunity by Type ($ million)

9. Market Segmentation by Source

9.1 Market segments

Chart on Source - Market share 2025-2030 (%)
Data Table on Source - Market share 2025-2030 (%)

9.2 Comparison by Source

Chart on Comparison by Source
Data Table on Comparison by Source

9.3 Chemical - Market size and forecast 2025-2030

Chart on Chemical - Market size and forecast 2025-2030 ($ million)
Data Table on Chemical - Market size and forecast 2025-2030 ($ million)
Chart on Chemical - Year-over-year growth 2025-2030 (%)
Data Table on Chemical - Year-over-year growth 2025-2030 (%)

9.4 Plant - Market size and forecast 2025-2030

Chart on Plant - Market size and forecast 2025-2030 ($ million)
Data Table on Plant - Market size and forecast 2025-2030 ($ million)
Chart on Plant - Year-over-year growth 2025-2030 (%)
Data Table on Plant - Year-over-year growth 2025-2030 (%)

9.5 Animal - Market size and forecast 2025-2030

Chart on Animal - Market size and forecast 2025-2030 ($ million)
Data Table on Animal - Market size and forecast 2025-2030 ($ million)
Chart on Animal - Year-over-year growth 2025-2030 (%)
Data Table on Animal - Year-over-year growth 2025-2030 (%)

9.6 Others - Market size and forecast 2025-2030

Chart on Others - Market size and forecast 2025-2030 ($ million)
Data Table on Others - Market size and forecast 2025-2030 ($ million)
Chart on Others - Year-over-year growth 2025-2030 (%)
Data Table on Others - Year-over-year growth 2025-2030 (%)

9.7 Market opportunity by Source

Market opportunity by Source ($ million)
Data Table on Market opportunity by Source ($ million)

10. Market Segmentation by Application

10.1 Market segments

Chart on Application - Market share 2025-2030 (%)
Data Table on Application - Market share 2025-2030 (%)

10.2 Comparison by Application

Chart on Comparison by Application
Data Table on Comparison by Application

10.3 Apparel - Market size and forecast 2025-2030

Chart on Apparel - Market size and forecast 2025-2030 ($ million)
Data Table on Apparel - Market size and forecast 2025-2030 ($ million)
Chart on Apparel - Year-over-year growth 2025-2030 (%)
Data Table on Apparel - Year-over-year growth 2025-2030 (%)

10.4 Home textiles - Market size and forecast 2025-2030

Chart on Home textiles - Market size and forecast 2025-2030 ($ million)
Data Table on Home textiles - Market size and forecast 2025-2030 ($ million)
Chart on Home textiles - Year-over-year growth 2025-2030 (%)
Data Table on Home textiles - Year-over-year growth 2025-2030 (%)

10.5 Industrial - Market size and forecast 2025-2030

Chart on Industrial - Market size and forecast 2025-2030 ($ million)
Data Table on Industrial - Market size and forecast 2025-2030 ($ million)
Chart on Industrial - Year-over-year growth 2025-2030 (%)
Data Table on Industrial - Year-over-year growth 2025-2030 (%)

10.6 Others - Market size and forecast 2025-2030

Chart on Others - Market size and forecast 2025-2030 ($ million)
Data Table on Others - Market size and forecast 2025-2030 ($ million)
Chart on Others - Year-over-year growth 2025-2030 (%)
Data Table on Others - Year-over-year growth 2025-2030 (%)

10.7 Market opportunity by Application

Market opportunity by Application ($ million)
Data Table on Market opportunity by Application ($ million)

11. Customer Landscape

11.1 Customer landscape overview

Analysis of price sensitivity, lifecycle, customer purchase basket, adoption rates, and purchase criteria

12. Geographic Landscape

12.1 Geographic segmentation

Chart on Market share by geography 2025-2030 (%)
Data Table on Market share by geography 2025-2030 (%)

12.2 Geographic comparison

Chart on Geographic comparison
Data Table on Geographic comparison

12.3 APAC - Market size and forecast 2025-2030

Chart on APAC - Market size and forecast 2025-2030 ($ million)
Data Table on APAC - Market size and forecast 2025-2030 ($ million)
Chart on APAC - Year-over-year growth 2025-2030 (%)
Data Table on APAC - Year-over-year growth 2025-2030 (%)
Chart on Regional Comparison - APAC
Data Table on Regional Comparison - APAC

12.3.1 China - Market size and forecast 2025-2030

Chart on China - Market size and forecast 2025-2030 ($ million)
Data Table on China - Market size and forecast 2025-2030 ($ million)
Chart on China - Year-over-year growth 2025-2030 (%)
Data Table on China - Year-over-year growth 2025-2030 (%)

12.3.2 India - Market size and forecast 2025-2030

Chart on India - Market size and forecast 2025-2030 ($ million)
Data Table on India - Market size and forecast 2025-2030 ($ million)
Chart on India - Year-over-year growth 2025-2030 (%)
Data Table on India - Year-over-year growth 2025-2030 (%)

12.3.3 Japan - Market size and forecast 2025-2030

Chart on Japan - Market size and forecast 2025-2030 ($ million)
Data Table on Japan - Market size and forecast 2025-2030 ($ million)
Chart on Japan - Year-over-year growth 2025-2030 (%)
Data Table on Japan - Year-over-year growth 2025-2030 (%)

12.3.4 South Korea - Market size and forecast 2025-2030

Chart on South Korea - Market size and forecast 2025-2030 ($ million)
Data Table on South Korea - Market size and forecast 2025-2030 ($ million)
Chart on South Korea - Year-over-year growth 2025-2030 (%)
Data Table on South Korea - Year-over-year growth 2025-2030 (%)

12.3.5 Bangladesh - Market size and forecast 2025-2030

Chart on Bangladesh - Market size and forecast 2025-2030 ($ million)
Data Table on Bangladesh - Market size and forecast 2025-2030 ($ million)
Chart on Bangladesh - Year-over-year growth 2025-2030 (%)
Data Table on Bangladesh - Year-over-year growth 2025-2030 (%)

12.3.6 Vietnam - Market size and forecast 2025-2030

Chart on Vietnam - Market size and forecast 2025-2030 ($ million)
Data Table on Vietnam - Market size and forecast 2025-2030 ($ million)
Chart on Vietnam - Year-over-year growth 2025-2030 (%)
Data Table on Vietnam - Year-over-year growth 2025-2030 (%)

12.4 North America - Market size and forecast 2025-2030

Chart on North America - Market size and forecast 2025-2030 ($ million)
Data Table on North America - Market size and forecast 2025-2030 ($ million)
Chart on North America - Year-over-year growth 2025-2030 (%)
Data Table on North America - Year-over-year growth 2025-2030 (%)
Chart on Regional Comparison - North America
Data Table on Regional Comparison - North America

12.4.1 US - Market size and forecast 2025-2030

Chart on US - Market size and forecast 2025-2030 ($ million)
Data Table on US - Market size and forecast 2025-2030 ($ million)
Chart on US - Year-over-year growth 2025-2030 (%)
Data Table on US - Year-over-year growth 2025-2030 (%)

12.4.2 Canada - Market size and forecast 2025-2030

Chart on Canada - Market size and forecast 2025-2030 ($ million)
Data Table on Canada - Market size and forecast 2025-2030 ($ million)
Chart on Canada - Year-over-year growth 2025-2030 (%)
Data Table on Canada - Year-over-year growth 2025-2030 (%)

12.4.3 Mexico - Market size and forecast 2025-2030

Chart on Mexico - Market size and forecast 2025-2030 ($ million)
Data Table on Mexico - Market size and forecast 2025-2030 ($ million)
Chart on Mexico - Year-over-year growth 2025-2030 (%)
Data Table on Mexico - Year-over-year growth 2025-2030 (%)

12.5 Europe - Market size and forecast 2025-2030

Chart on Europe - Market size and forecast 2025-2030 ($ million)
Data Table on Europe - Market size and forecast 2025-2030 ($ million)
Chart on Europe - Year-over-year growth 2025-2030 (%)
Data Table on Europe - Year-over-year growth 2025-2030 (%)
Chart on Regional Comparison - Europe
Data Table on Regional Comparison - Europe

12.5.1 Germany - Market size and forecast 2025-2030

Chart on Germany - Market size and forecast 2025-2030 ($ million)
Data Table on Germany - Market size and forecast 2025-2030 ($ million)
Chart on Germany - Year-over-year growth 2025-2030 (%)
Data Table on Germany - Year-over-year growth 2025-2030 (%)

12.5.2 Italy - Market size and forecast 2025-2030

Chart on Italy - Market size and forecast 2025-2030 ($ million)
Data Table on Italy - Market size and forecast 2025-2030 ($ million)
Chart on Italy - Year-over-year growth 2025-2030 (%)
Data Table on Italy - Year-over-year growth 2025-2030 (%)

12.5.3 France - Market size and forecast 2025-2030

Chart on France - Market size and forecast 2025-2030 ($ million)
Data Table on France - Market size and forecast 2025-2030 ($ million)
Chart on France - Year-over-year growth 2025-2030 (%)
Data Table on France - Year-over-year growth 2025-2030 (%)

12.5.4 UK - Market size and forecast 2025-2030

Chart on UK - Market size and forecast 2025-2030 ($ million)
Data Table on UK - Market size and forecast 2025-2030 ($ million)
Chart on UK - Year-over-year growth 2025-2030 (%)
Data Table on UK - Year-over-year growth 2025-2030 (%)

12.5.5 Spain - Market size and forecast 2025-2030

Chart on Spain - Market size and forecast 2025-2030 ($ million)
Data Table on Spain - Market size and forecast 2025-2030 ($ million)
Chart on Spain - Year-over-year growth 2025-2030 (%)
Data Table on Spain - Year-over-year growth 2025-2030 (%)

12.5.6 Poland - Market size and forecast 2025-2030

Chart on Poland - Market size and forecast 2025-2030 ($ million)
Data Table on Poland - Market size and forecast 2025-2030 ($ million)
Chart on Poland - Year-over-year growth 2025-2030 (%)
Data Table on Poland - Year-over-year growth 2025-2030 (%)

12.6 South America - Market size and forecast 2025-2030

Chart on South America - Market size and forecast 2025-2030 ($ million)
Data Table on South America - Market size and forecast 2025-2030 ($ million)
Chart on South America - Year-over-year growth 2025-2030 (%)
Data Table on South America - Year-over-year growth 2025-2030 (%)
Chart on Regional Comparison - South America
Data Table on Regional Comparison - South America

12.6.1 Brazil - Market size and forecast 2025-2030

Chart on Brazil - Market size and forecast 2025-2030 ($ million)
Data Table on Brazil - Market size and forecast 2025-2030 ($ million)
Chart on Brazil - Year-over-year growth 2025-2030 (%)
Data Table on Brazil - Year-over-year growth 2025-2030 (%)

12.6.2 Argentina - Market size and forecast 2025-2030

Chart on Argentina - Market size and forecast 2025-2030 ($ million)
Data Table on Argentina - Market size and forecast 2025-2030 ($ million)
Chart on Argentina - Year-over-year growth 2025-2030 (%)
Data Table on Argentina - Year-over-year growth 2025-2030 (%)

12.6.3 Colombia - Market size and forecast 2025-2030

Chart on Colombia - Market size and forecast 2025-2030 ($ million)
Data Table on Colombia - Market size and forecast 2025-2030 ($ million)
Chart on Colombia - Year-over-year growth 2025-2030 (%)
Data Table on Colombia - Year-over-year growth 2025-2030 (%)

12.7 Middle East and Africa - Market size and forecast 2025-2030

Chart on Middle East and Africa - Market size and forecast 2025-2030 ($ million)
Data Table on Middle East and Africa - Market size and forecast 2025-2030 ($ million)
Chart on Middle East and Africa - Year-over-year growth 2025-2030 (%)
Data Table on Middle East and Africa - Year-over-year growth 2025-2030 (%)
Chart on Regional Comparison - Middle East and Africa
Data Table on Regional Comparison - Middle East and Africa

12.7.1 Turkey - Market size and forecast 2025-2030

Chart on Turkey - Market size and forecast 2025-2030 ($ million)
Data Table on Turkey - Market size and forecast 2025-2030 ($ million)
Chart on Turkey - Year-over-year growth 2025-2030 (%)
Data Table on Turkey - Year-over-year growth 2025-2030 (%)

12.7.2 Egypt - Market size and forecast 2025-2030

Chart on Egypt - Market size and forecast 2025-2030 ($ million)
Data Table on Egypt - Market size and forecast 2025-2030 ($ million)
Chart on Egypt - Year-over-year growth 2025-2030 (%)
Data Table on Egypt - Year-over-year growth 2025-2030 (%)

12.7.3 South Africa - Market size and forecast 2025-2030

Chart on South Africa - Market size and forecast 2025-2030 ($ million)
Data Table on South Africa - Market size and forecast 2025-2030 ($ million)
Chart on South Africa - Year-over-year growth 2025-2030 (%)
Data Table on South Africa - Year-over-year growth 2025-2030 (%)

12.7.4 Saudi Arabia - Market size and forecast 2025-2030

Chart on Saudi Arabia - Market size and forecast 2025-2030 ($ million)
Data Table on Saudi Arabia - Market size and forecast 2025-2030 ($ million)
Chart on Saudi Arabia - Year-over-year growth 2025-2030 (%)
Data Table on Saudi Arabia - Year-over-year growth 2025-2030 (%)

12.7.5 UAE - Market size and forecast 2025-2030

Chart on UAE - Market size and forecast 2025-2030 ($ million)
Data Table on UAE - Market size and forecast 2025-2030 ($ million)
Chart on UAE - Year-over-year growth 2025-2030 (%)
Data Table on UAE - Year-over-year growth 2025-2030 (%)

12.8 Market opportunity by geography

Market opportunity by geography ($ million)
Data Tables on Market opportunity by geography ($ million)

13. Drivers, Challenges, and Opportunity

13.1 Market drivers

Proliferation of sustainable and circular fiber solutions
Technological advancements and digitalization in yarn manufacturing
Diversification of applications in apparel and technical textile sectors

13.2 Market challenges

High volatility in raw material pricing and availability
Stringent environmental regulations and sustainability mandates
Geopolitical instability and fragmented global supply chains

13.3 Impact of drivers and challenges

Impact of drivers and challenges in 2025 and 2030

13.4 Market opportunities

Accelerated transition toward circularity and sustainable fiber sourcing
Integration of smart textiles and functional high-performance yarns
Digital transformation and implementation of industry 4.0 in manufacturing

14. Competitive Landscape

14.1 Overview

14.2

Overview on criticality of inputs and factors of differentiation

14.3 Landscape disruption

Overview on factors of disruption

14.4 Industry risks

Impact of key risks on business

15. Competitive Analysis

15.1 Companies profiled

Companies covered

15.2 Company ranking index

15.3 Market positioning of companies

Matrix on companies position and classification

15.4 Banswara Syntex Ltd.

Banswara Syntex Ltd. - Overview
Banswara Syntex Ltd. - Business segments
Banswara Syntex Ltd. - Key offerings
Banswara Syntex Ltd. - Segment focus
SWOT

15.5 Coats Group PLC

Coats Group PLC - Overview
Coats Group PLC - Business segments
Coats Group PLC - Key offerings
Coats Group PLC - Segment focus
SWOT

15.6 Far Eastern New Century Corp.

Far Eastern New Century Corp. - Overview
Far Eastern New Century Corp. - Business segments
Far Eastern New Century Corp. - Key offerings
Far Eastern New Century Corp. - Segment focus
SWOT

15.7 Hengli Petrochemical Co. Ltd.

Hengli Petrochemical Co. Ltd. - Overview
Hengli Petrochemical Co. Ltd. - Product / Service
Hengli Petrochemical Co. Ltd. - Key offerings
SWOT

15.8 Huvis Corp.

Huvis Corp. - Overview
Huvis Corp. - Business segments
Huvis Corp. - Key offerings
Huvis Corp. - Segment focus
SWOT

15.9 Hyosung TNC Corp.

Hyosung TNC Corp. - Overview
Hyosung TNC Corp. - Business segments
Hyosung TNC Corp. - Key offerings
Hyosung TNC Corp. - Segment focus
SWOT

15.10 Indorama Ventures Public Co.

Indorama Ventures Public Co. - Overview
Indorama Ventures Public Co. - Business segments
Indorama Ventures Public Co. - Key offerings
Indorama Ventures Public Co. - Segment focus
SWOT

15.11 RSWM Ltd.

RSWM Ltd. - Overview
RSWM Ltd. - Business segments
RSWM Ltd. - Key offerings
RSWM Ltd. - Segment focus
SWOT

15.12 Sutlej Textiles and Industries

Sutlej Textiles and Industries - Overview
Sutlej Textiles and Industries - Business segments
Sutlej Textiles and Industries - Key offerings
Sutlej Textiles and Industries - Segment focus
SWOT

15.13 Texhong International Group Ltd.

Texhong International Group Ltd. - Overview
Texhong International Group Ltd. - Product / Service
Texhong International Group Ltd. - Key offerings
SWOT

15.14 Toray Industries Inc.

Toray Industries Inc. - Overview
Toray Industries Inc. - Business segments
Toray Industries Inc. - Key news
Toray Industries Inc. - Key offerings
Toray Industries Inc. - Segment focus
SWOT

15.15 Toyobo Co. Ltd.

Toyobo Co. Ltd. - Overview
Toyobo Co. Ltd. - Business segments
Toyobo Co. Ltd. - Key news
Toyobo Co. Ltd. - Key offerings
Toyobo Co. Ltd. - Segment focus
SWOT

15.16 Trident Ltd.

Trident Ltd. - Overview
Trident Ltd. - Business segments
Trident Ltd. - Key offerings
Trident Ltd. - Segment focus
SWOT

15.17 Unifi Inc.

Unifi Inc. - Overview
Unifi Inc. - Business segments
Unifi Inc. - Key offerings
Unifi Inc. - Segment focus
SWOT

15.18 Vardhman Textile Ltd.

Vardhman Textile Ltd. - Overview
Vardhman Textile Ltd. - Business segments
Vardhman Textile Ltd. - Key offerings
Vardhman Textile Ltd. - Segment focus
SWOT

16. Appendix

16.1 Scope of the report

Market definition
Objectives
Notes and caveats

16.2 Inclusions and exclusions checklist

Inclusions checklist
Exclusions checklist

16.3 Currency conversion rates for US$

16.4 Research methodology

16.5 Data procurement

Information sources

16.6 Data validation

16.7 Validation techniques employed for market sizing

16.8 Data synthesis

16.9 360 degree market analysis

16.10 List of abbreviations

Research Methodology

Technavio presents a detailed picture of the market by way of study, synthesis, and summation of data from multiple sources. The analysts have presented the various facets of the market with a particular focus on identifying the key industry influencers. The data thus presented is comprehensive, reliable, and the result of extensive research, both primary and secondary.

INFORMATION SOURCES

Primary sources

  • Manufacturers and suppliers
  • Channel partners
  • Industry experts
  • Strategic decision makers

Secondary sources

  • Industry journals and periodicals
  • Government data
  • Financial reports of key industry players
  • Historical data
  • Press releases

DATA ANALYSIS

Data Synthesis

  • Collation of data
  • Estimation of key figures
  • Analysis of derived insights

Data Validation

  • Triangulation with data models
  • Reference against proprietary databases
  • Corroboration with industry experts

REPORT WRITING

Qualitative

  • Market drivers
  • Market challenges
  • Market trends
  • Five forces analysis

Quantitative

  • Market size and forecast
  • Market segmentation
  • Geographical insights
  • Competitive landscape

Interested in this report?

Get your sample now to see our research methodology and insights!

Download Now

Frequently Asked Questions

Yarn market growth will increase by USD 40813.9 million during 2026-2030.

The Yarn market is expected to grow at a CAGR of 5.1% during 2026-2030.

Yarn market is segmented by Type (Natural, Artificial) Source (Chemical, Plant, Animal, Others) Application (Apparel, Home textiles, Industrial, Others)

Banswara Syntex Ltd., Coats Group PLC, Far Eastern New Century Corp., Filatex India Ltd, Hengli Petrochemical Co. Ltd., Huvis Corp., Hyosung TNC Corp., Indorama Ventures Public Co., Kipas Holding Inc., Parkdale Incorp., Radici Partecipazioni Spa, RSWM Ltd., Sutlej Textiles and Industries, Texhong International Group Ltd., Toray Industries Inc., Toyobo Co. Ltd., Trident Ltd., Unifi Inc., Vardhman Textile Ltd., Weiqiao Textile Co. Ltd. are a few of the key vendors in the Yarn market.

APAC will register the highest growth rate of 63.3% among the other regions. Therefore, the Yarn market in APAC is expected to garner significant business opportunities for the vendors during the forecast period.

China, India, Japan, South Korea, Bangladesh, Vietnam, US, Canada, Mexico, Germany, Italy, France, UK, Spain, Poland, Brazil, Argentina, Colombia, Turkey, Egypt, South Africa, Saudi Arabia, UAE

  • Proliferation of sustainable and circular fiber solutions is the driving factor this market.

The Yarn market vendors should focus on grabbing business opportunities from the Type segment as it accounted for the largest market share in the base year.
RIA - Research AI Assistant
Ask RIA
